| Param | Original file | Final file |
|---|---|---|
| Filename | modeM0/AS1C07_001T05_9000004902_34338cztM0_level2.evt | modeM0/AS1C07_001T05_9000004902_34338cztM0_level2_quad_clean.evt |
| Size (bytes) | 595,851,840 | 93,317,760 |
| Size | 568.2 MB | 89.0 MB |
| Events in quadrant A | 2,291,539 | 651,172 |
| Events in quadrant B | 2,976,285 | 661,693 |
| Events in quadrant C | 2,934,250 | 658,169 |
| Events in quadrant D | 9,492,415 | 491,036 |
| Mode SS | |||
|---|---|---|---|
| Quadrant | BADHDUFLAG | Total packets | Discarded packets |
| A | 0 | 106 | 0 |
| B | 0 | 106 | 0 |
| C | 0 | 106 | 0 |
| D | 0 | 106 | 0 |
| Mode M9 | |||
|---|---|---|---|
| Quadrant | BADHDUFLAG | Total packets | Discarded packets |
| A | 0 | 37 | 0 |
| B | 0 | 37 | 0 |
| C | 0 | 37 | 0 |
| D | 0 | 38 | 0 |
| Mode M0 | |||
|---|---|---|---|
| Quadrant | BADHDUFLAG | Total packets | Discarded packets |
| A | 0 | 10484 | 3 |
| B | 0 | 12253 | 2 |
| C | 0 | 11871 | 2 |
| D | 0 | 31775 | 2 |
| Quadrant | Total seconds | Saturated seconds | Saturation percentage |
|---|---|---|---|
| A | 5181 | 7 | 0.135109% |
| B | 5181 | 82 | 1.582706% |
| C | 5181 | 120 | 2.316155% |
| D | 5181 | 2355 | 45.454545% |
Noise dominated data is calculated using 1-second bins in cleaned event files. If a bin has >2000 counts, and if more than 50% of those come from <1% of pixels, then it is considered to be noise-dominated and hence unusable.
| Quadrant | # 1 sec bins | Bins with >0 counts | Bins with >2000 counts | High rate bins dominated by noise | Noise dominated (total time) | Noise dominated (detector-on time) | Marked lightcurve |
|---|---|---|---|---|---|---|---|
| A | 7093 | 5182 | 2 | 2 | 0.03% | 0.04% | 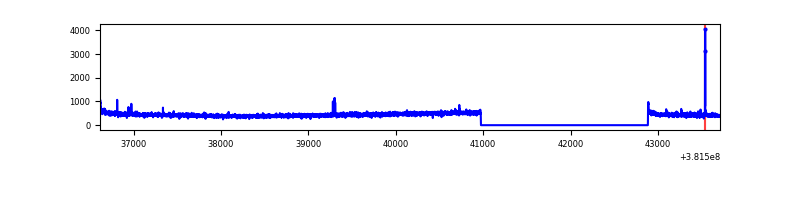 |
| B | 7093 | 5182 | 46 | 46 | 0.65% | 0.89% | 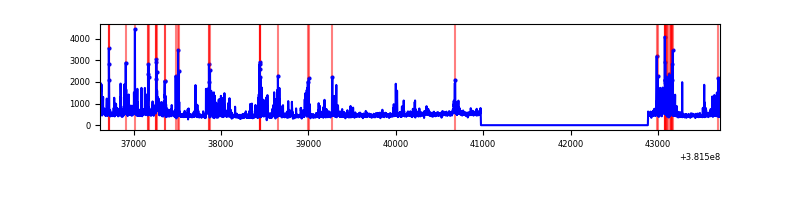 |
| C | 7093 | 5182 | 101 | 101 | 1.42% | 1.95% | 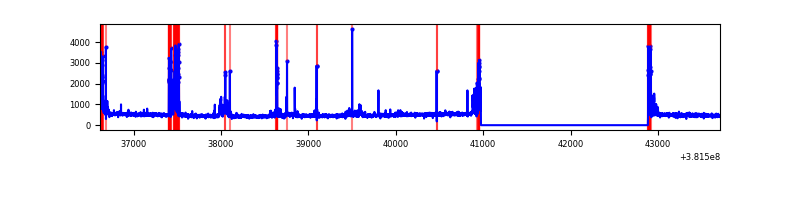 |
| D | 7093 | 5182 | 2316 | 2316 | 32.65% | 44.69% | 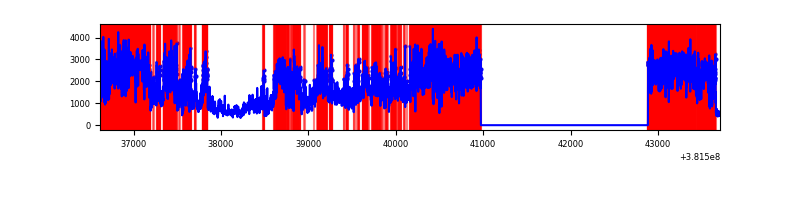 |
Top three noisy pixels from each quadrant. If the there are fewer than three noisy pixels in the level2.evt file, extra rows are filled as -1
| Pixel properties | Quadrant properties | ||||||
|---|---|---|---|---|---|---|---|
| Quadrant | DetID | PixID | Counts | Sigma | Mean | Median | Sigma |
| A | 10 | 83 | 29123 | 248.57 | 579 | 568 | 114.9 |
| A | 9 | 143 | 19560 | 165.32 | 579 | 568 | 114.9 |
| A | 13 | 254 | 7913 | 63.94 | 579 | 568 | 114.9 |
| B | 5 | 172 | 267986 | 2417.79 | 581 | 566 | 110.6 |
| B | 0 | 219 | 247062 | 2228.62 | 581 | 566 | 110.6 |
| B | 5 | 200 | 43233 | 385.76 | 581 | 566 | 110.6 |
| C | 14 | 254 | 348014 | 2652.52 | 567 | 571 | 131.0 |
| C | 15 | 214 | 216862 | 1651.25 | 567 | 571 | 131.0 |
| C | 0 | 10 | 137437 | 1044.89 | 567 | 571 | 131.0 |
| D | 12 | 235 | 3383148 | 29867.24 | 465 | 452 | 113.3 |
| D | 12 | 227 | 3260048 | 28780.34 | 465 | 452 | 113.3 |
| D | 8 | 195 | 880907 | 7773.91 | 465 | 452 | 113.3 |
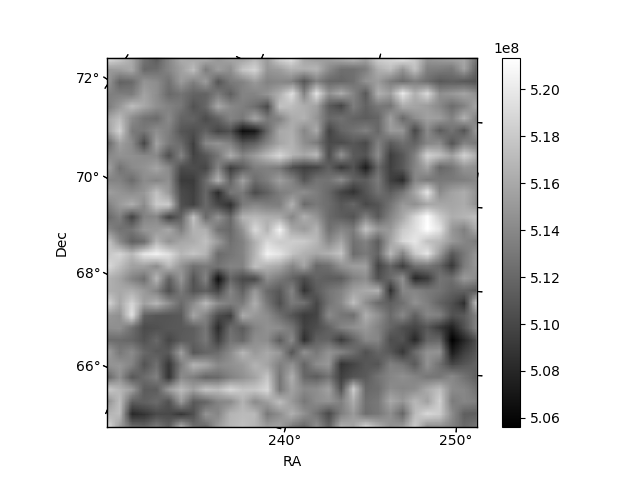
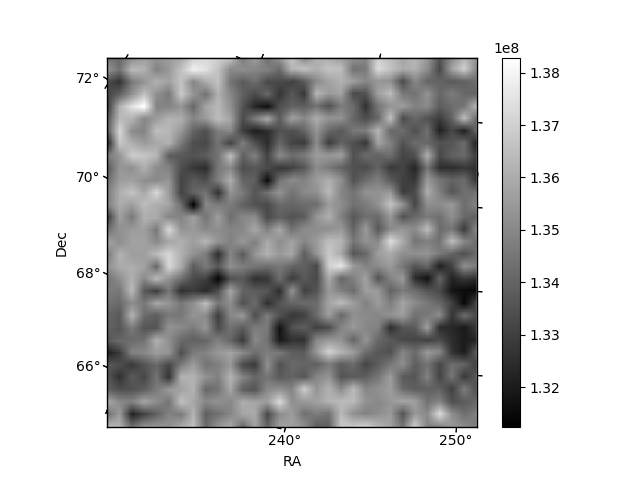
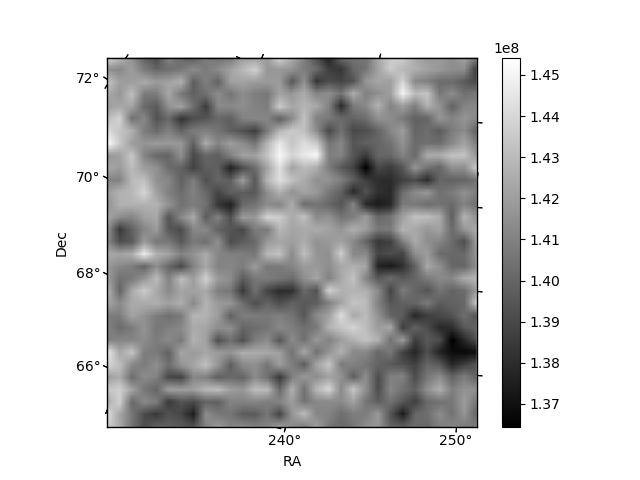
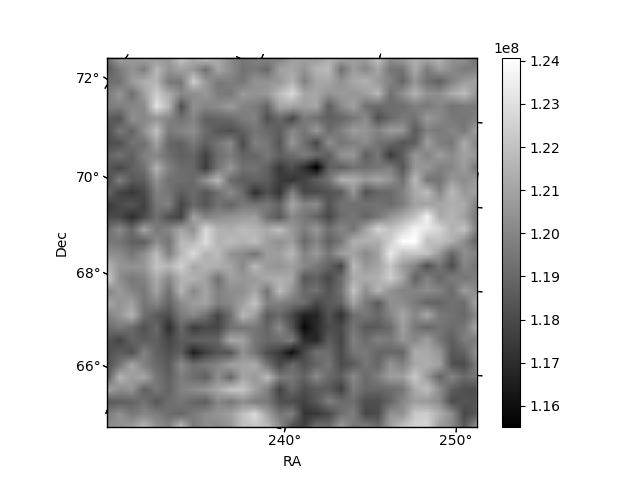
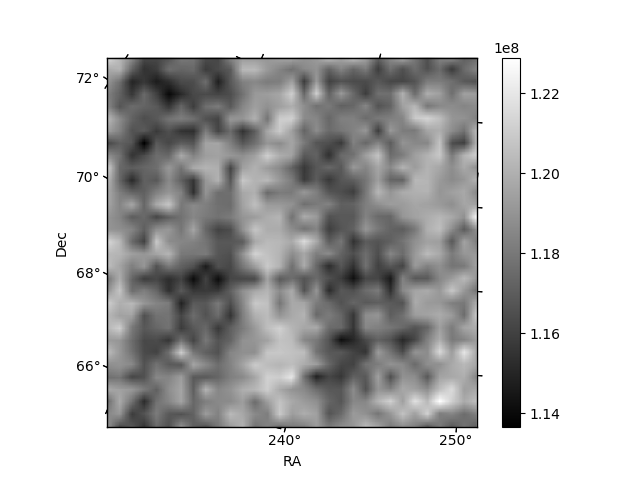
Histogram calculated using DETX and DETY for each event in the final _common_clean file
| Quadrant A | 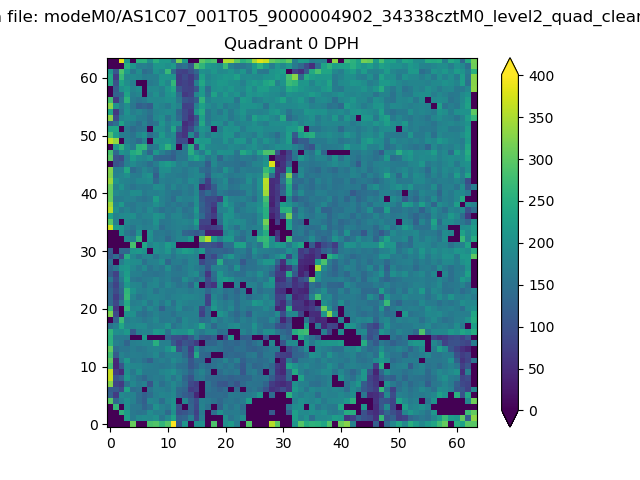 |
 |
Quadrant B |
|---|---|---|---|
| Quadrant D | 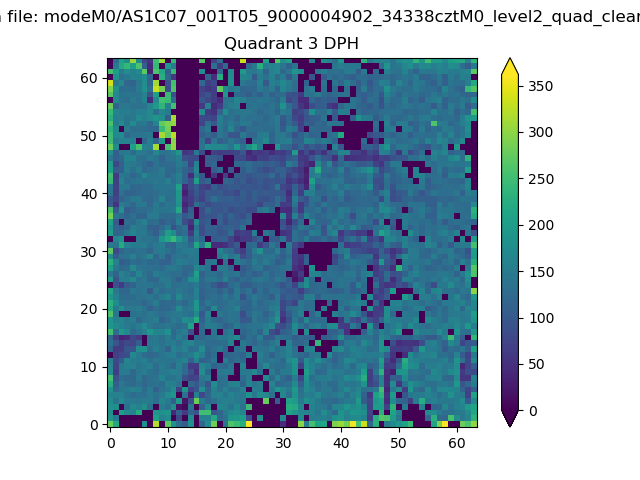 |
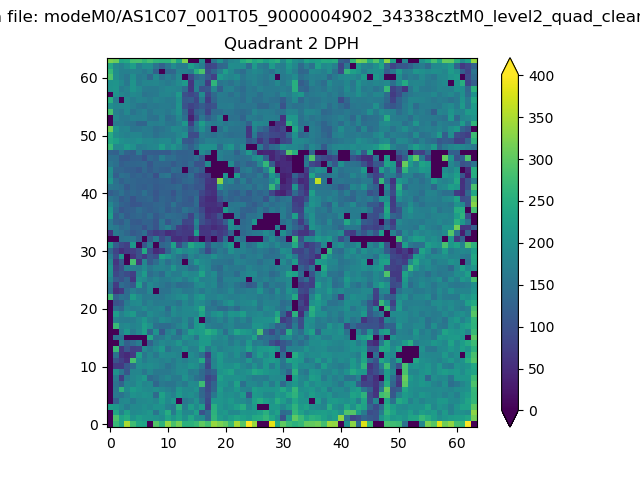 |
Quadrant C |
| Plot type | Count rate plots | Images |
|---|---|---|
| Comparison with Poisson distribution Blue bars denote a histogram of data divided into 1 sec bins. Red curve is a Poisson curve with rate = median count rate of data. |
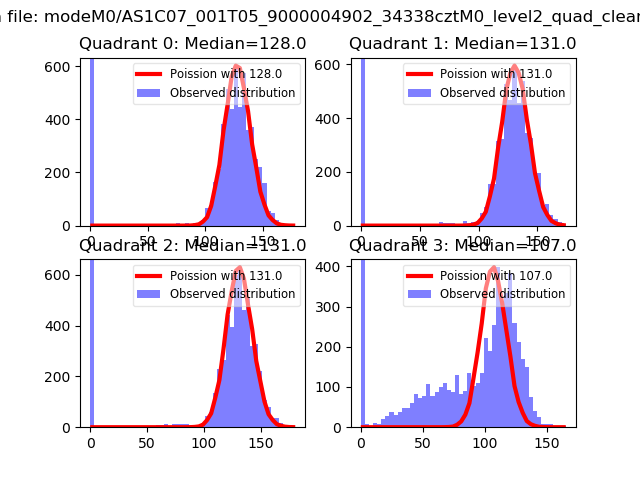 |
 |
| Quadrant-wise count rates Data is divided into 100 sec bins |
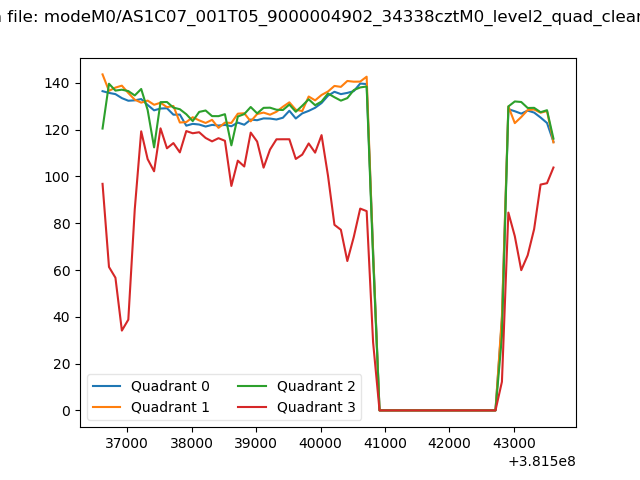 |
|
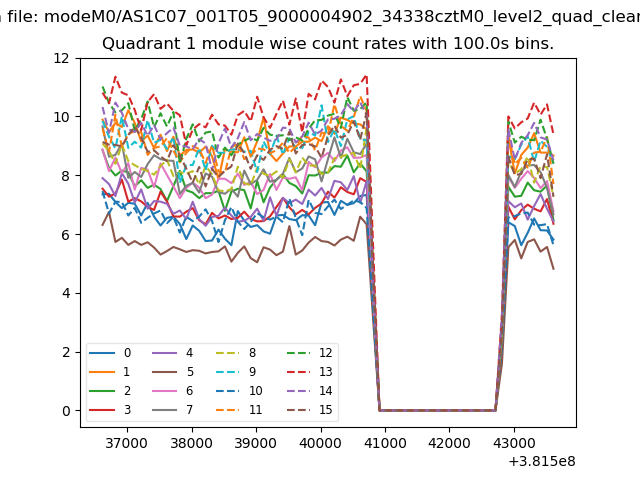
| Module-wise count rates for Quadrant A Data is divided into 100 sec bins |
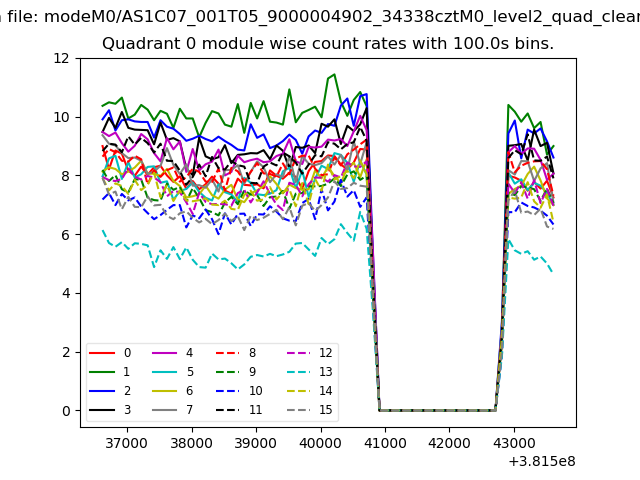 |
 |
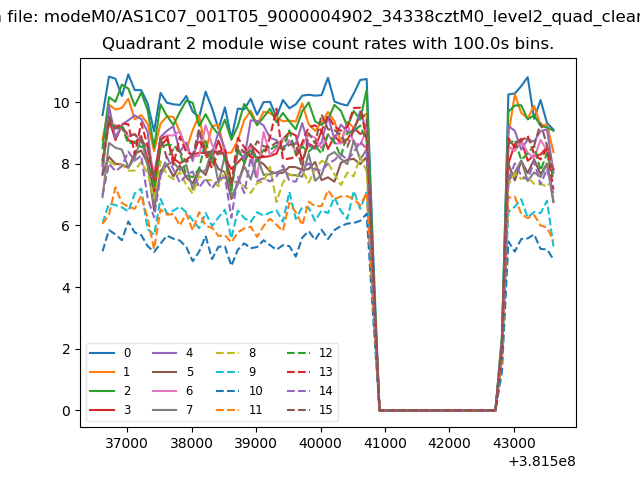
| Module-wise count rates for Quadrant B Data is divided into 100 sec bins |
 |
 |
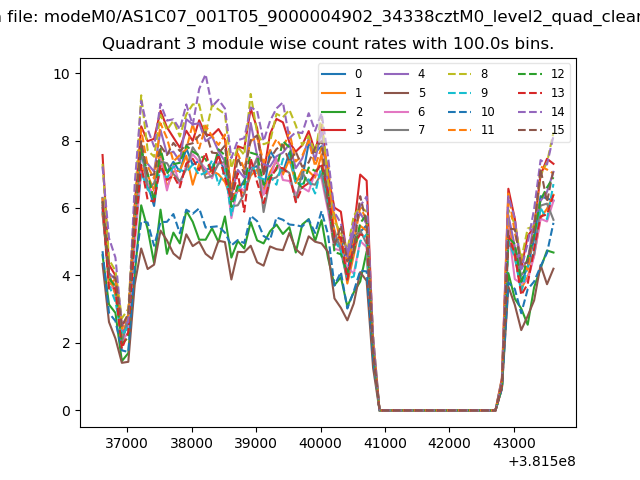
| Module-wise count rates for Quadrant C Data is divided into 100 sec bins |
 |
 |
| Module-wise count rates for Quadrant D Data is divided into 100 sec bins |
 |
 |
| Parameter | Plot |
|---|---|
| CZT HV Monitor | 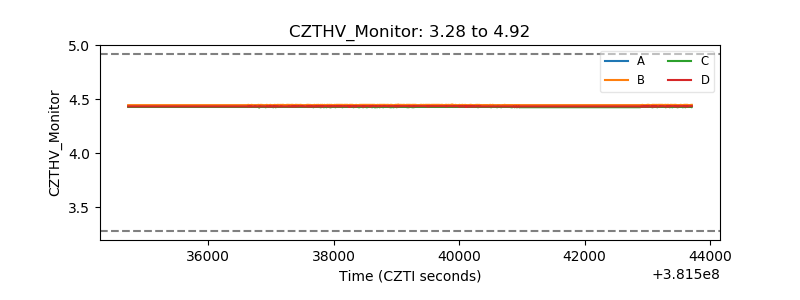 |
| D_VDD | 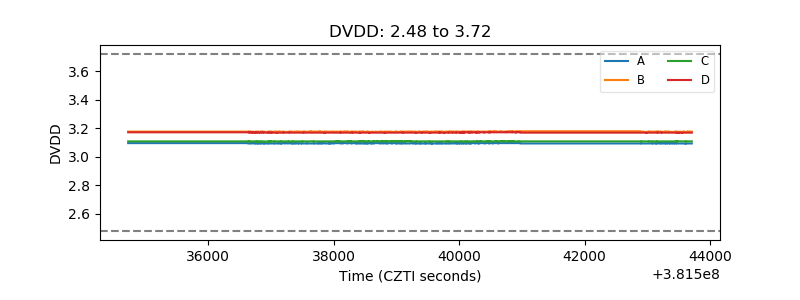 |
| Temperature 1 | 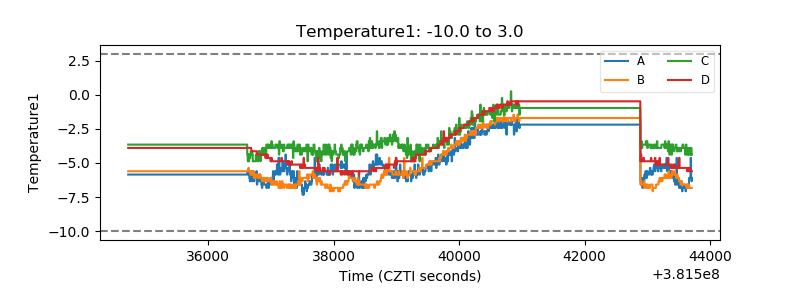 |
| Veto HV Monitor | 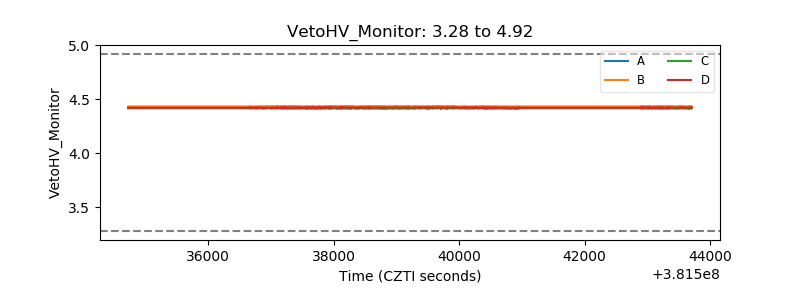 |
| Veto LLD | 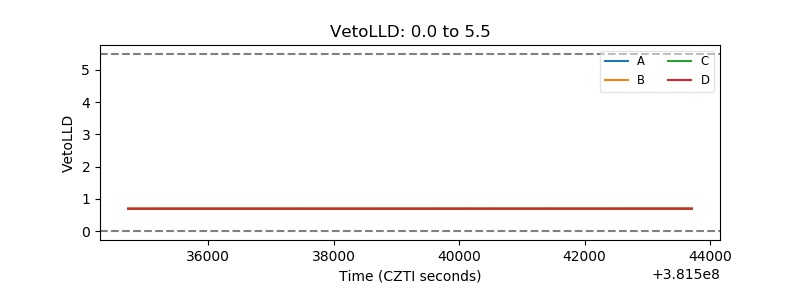 |
| Alpha Counter | 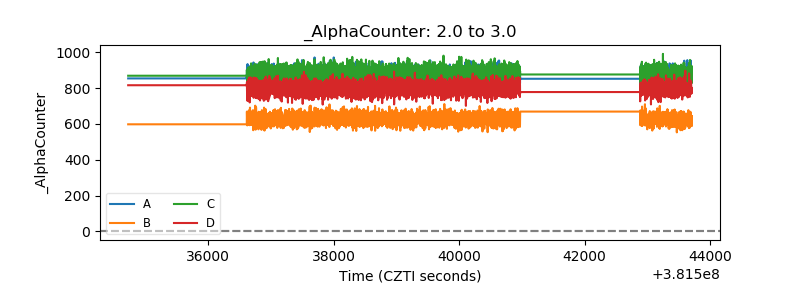 |
| _CPM_Rate | 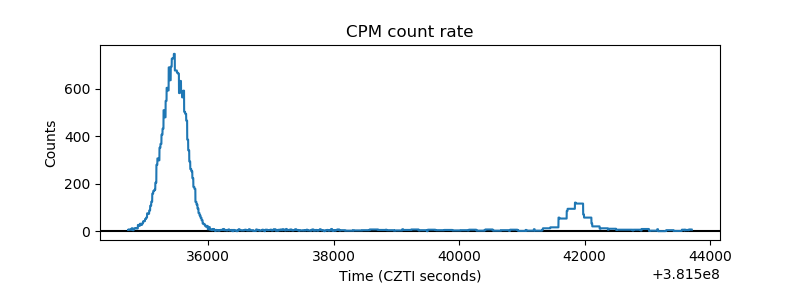 |
| CZT Counter | 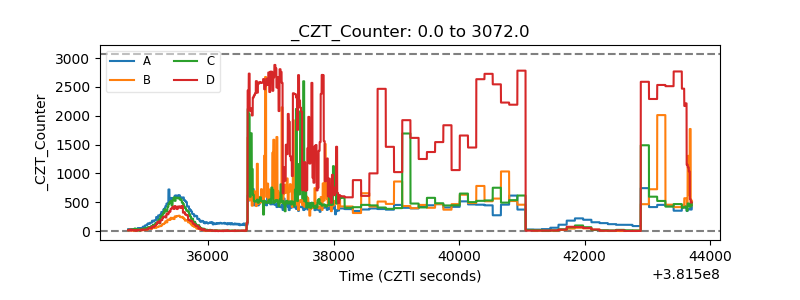 |
| +2.5 Volts monitor | 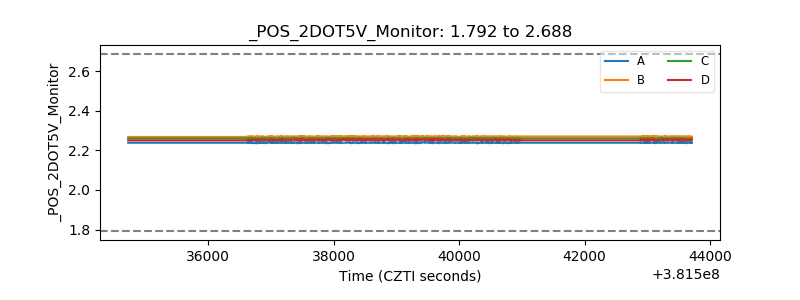 |
| +5 Volts monitor | 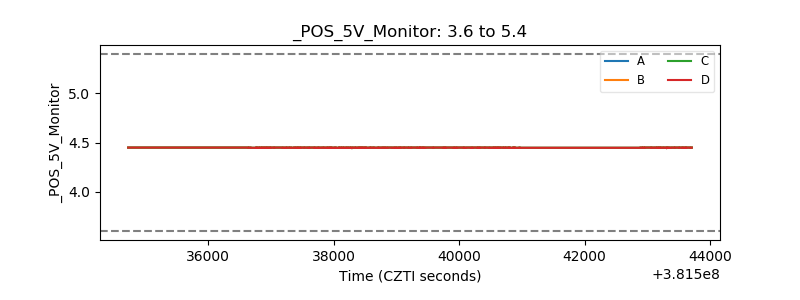 |
| _ROLL_ROT | 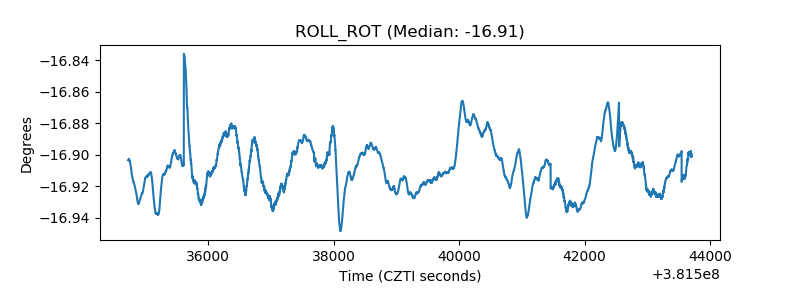 |
| _Roll_DEC | 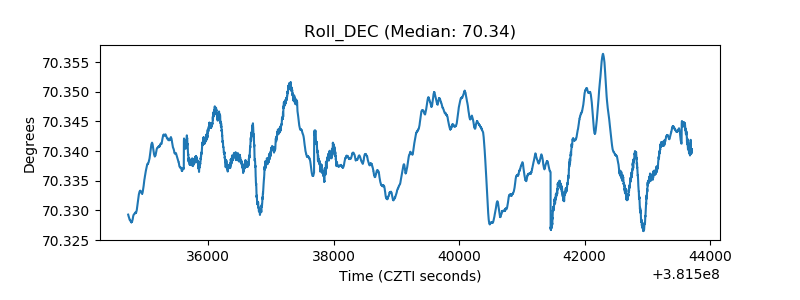 |
| _Roll_RA | 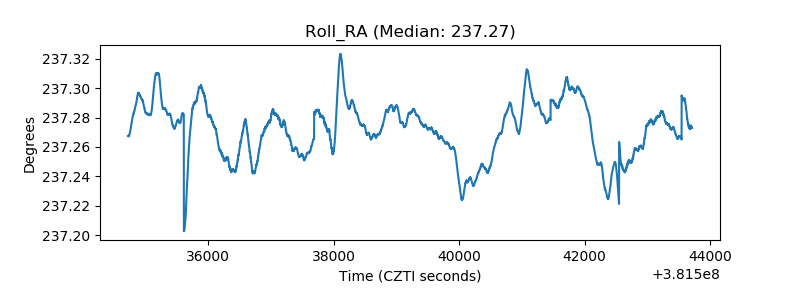 |
| Veto Counter | 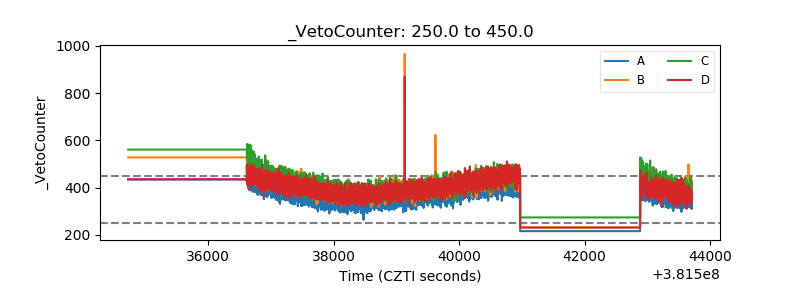 |