| Param | Original file | Final file |
|---|---|---|
| Filename | modeM0/AS1C07_001T05_9000004902_34337cztM0_level2.evt | modeM0/AS1C07_001T05_9000004902_34337cztM0_level2_quad_clean.evt |
| Size (bytes) | 541,817,280 | 96,736,320 |
| Size | 516.7 MB | 92.3 MB |
| Events in quadrant A | 2,263,675 | 672,096 |
| Events in quadrant B | 3,169,748 | 683,559 |
| Events in quadrant C | 2,828,915 | 688,970 |
| Events in quadrant D | 7,812,697 | 538,463 |
| Mode SS | |||
|---|---|---|---|
| Quadrant | BADHDUFLAG | Total packets | Discarded packets |
| A | 0 | 100 | 0 |
| B | 0 | 100 | 0 |
| C | 0 | 100 | 0 |
| D | 0 | 100 | 0 |
| Mode M9 | |||
|---|---|---|---|
| Quadrant | BADHDUFLAG | Total packets | Discarded packets |
| A | 0 | 36 | 0 |
| B | 0 | 36 | 0 |
| C | 0 | 36 | 0 |
| D | 0 | 37 | 0 |
| Mode M0 | |||
|---|---|---|---|
| Quadrant | BADHDUFLAG | Total packets | Discarded packets |
| A | 0 | 10035 | 3 |
| B | 0 | 12647 | 2 |
| C | 0 | 11347 | 2 |
| D | 0 | 26669 | 2 |
| Quadrant | Total seconds | Saturated seconds | Saturation percentage |
|---|---|---|---|
| A | 4933 | 5 | 0.101358% |
| B | 4933 | 143 | 2.898845% |
| C | 4933 | 74 | 1.500101% |
| D | 4933 | 1565 | 31.725117% |
Noise dominated data is calculated using 1-second bins in cleaned event files. If a bin has >2000 counts, and if more than 50% of those come from <1% of pixels, then it is considered to be noise-dominated and hence unusable.
| Quadrant | # 1 sec bins | Bins with >0 counts | Bins with >2000 counts | High rate bins dominated by noise | Noise dominated (total time) | Noise dominated (detector-on time) | Marked lightcurve |
|---|---|---|---|---|---|---|---|
| A | 7026 | 4934 | 0 | 0 | 0.00% | 0.00% | 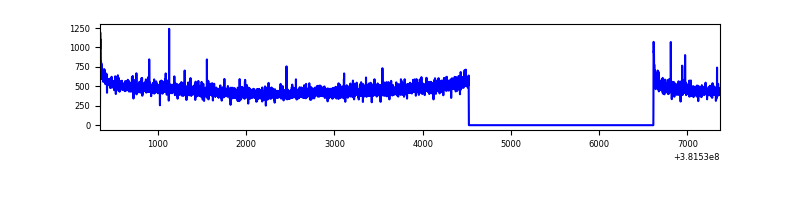 |
| B | 7026 | 4934 | 94 | 94 | 1.34% | 1.91% | 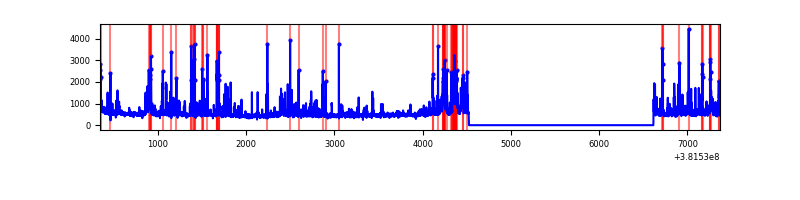 |
| C | 7026 | 4934 | 54 | 54 | 0.77% | 1.09% | 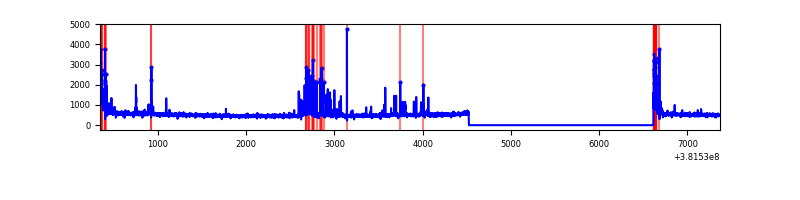 |
| D | 7026 | 4934 | 1490 | 1490 | 21.21% | 30.20% | 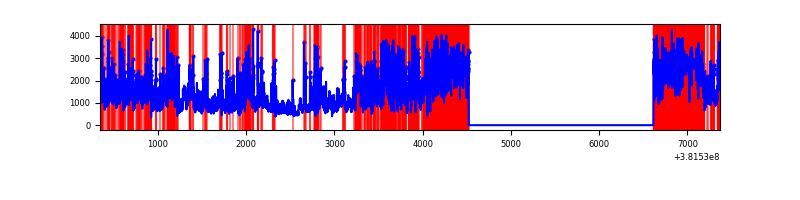 |
Top three noisy pixels from each quadrant. If the there are fewer than three noisy pixels in the level2.evt file, extra rows are filled as -1
| Pixel properties | Quadrant properties | ||||||
|---|---|---|---|---|---|---|---|
| Quadrant | DetID | PixID | Counts | Sigma | Mean | Median | Sigma |
| A | 10 | 83 | 29725 | 257.54 | 572 | 562 | 113.2 |
| A | 13 | 6 | 17102 | 146.07 | 572 | 562 | 113.2 |
| A | 9 | 143 | 8484 | 69.96 | 572 | 562 | 113.2 |
| B | 5 | 172 | 441251 | 4093.63 | 572 | 558 | 107.7 |
| B | 4 | 171 | 253613 | 2350.65 | 572 | 558 | 107.7 |
| B | 0 | 219 | 102910 | 950.76 | 572 | 558 | 107.7 |
| C | 14 | 254 | 248275 | 1917.41 | 566 | 573 | 129.2 |
| C | 15 | 214 | 208944 | 1612.96 | 566 | 573 | 129.2 |
| C | 0 | 10 | 141378 | 1089.94 | 566 | 573 | 129.2 |
| D | 12 | 235 | 4253939 | 34296.74 | 479 | 469 | 124.0 |
| D | 8 | 195 | 685219 | 5521.3 | 479 | 469 | 124.0 |
| D | 12 | 227 | 534143 | 4303.14 | 479 | 469 | 124.0 |
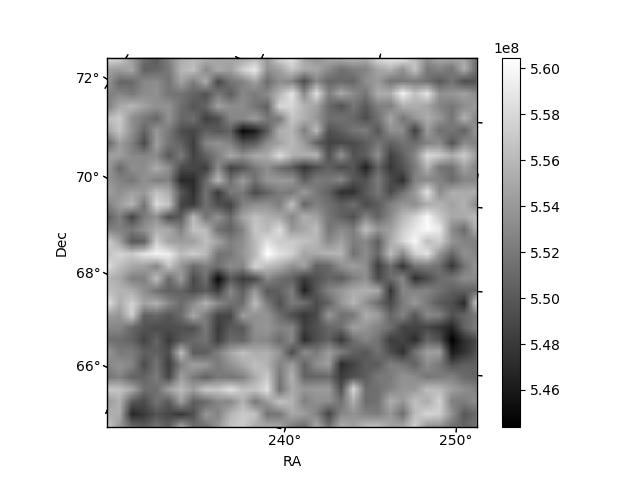
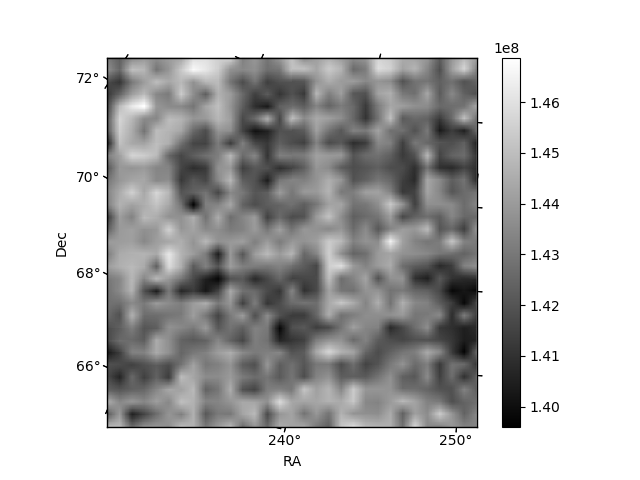
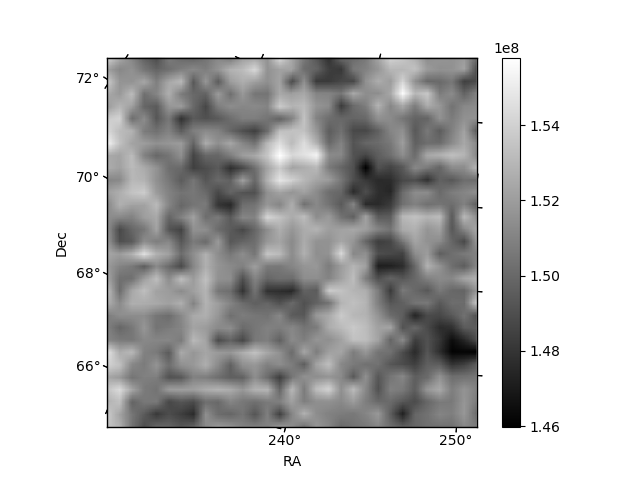
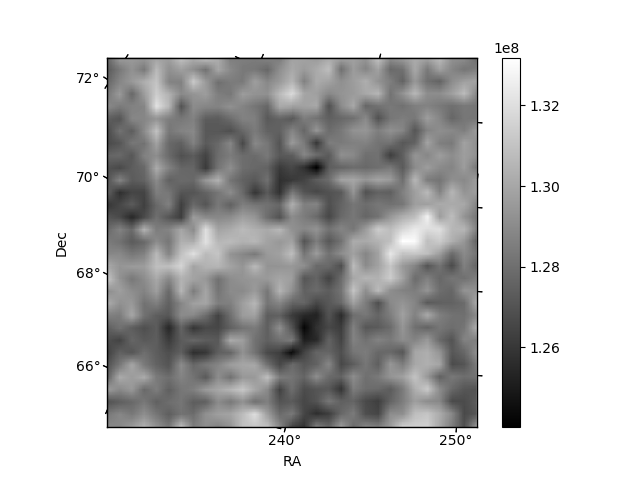
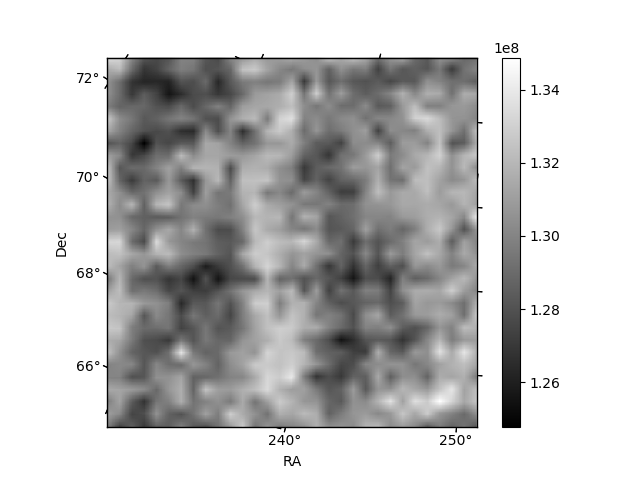
Histogram calculated using DETX and DETY for each event in the final _common_clean file
| Quadrant A | 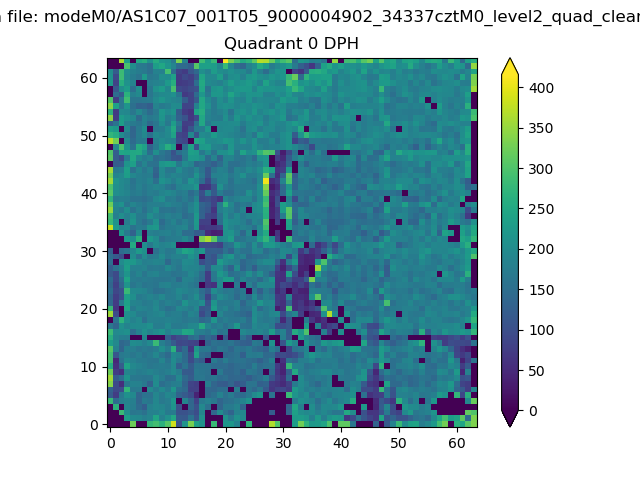 |
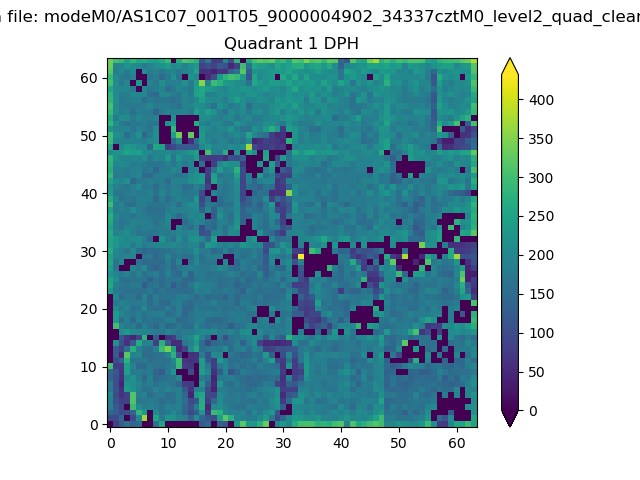 |
Quadrant B |
|---|---|---|---|
| Quadrant D | 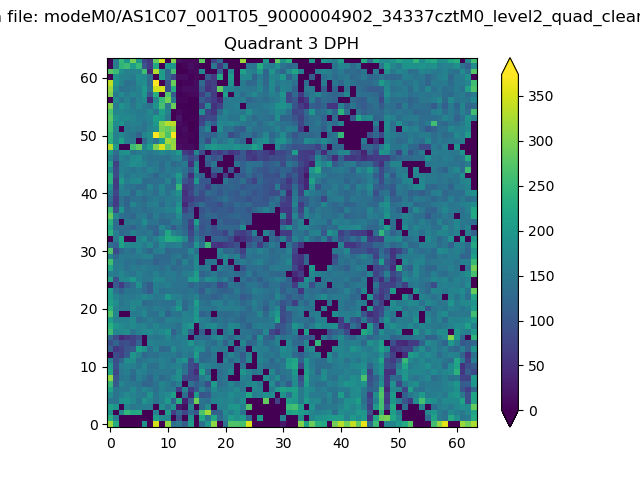 |
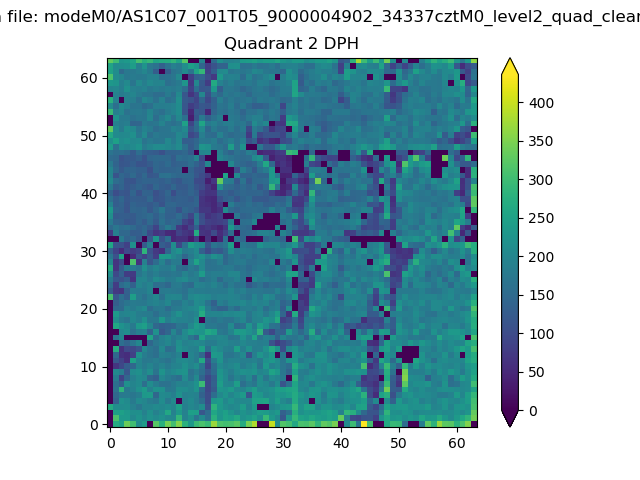 |
Quadrant C |
| Plot type | Count rate plots | Images |
|---|---|---|
| Comparison with Poisson distribution Blue bars denote a histogram of data divided into 1 sec bins. Red curve is a Poisson curve with rate = median count rate of data. |
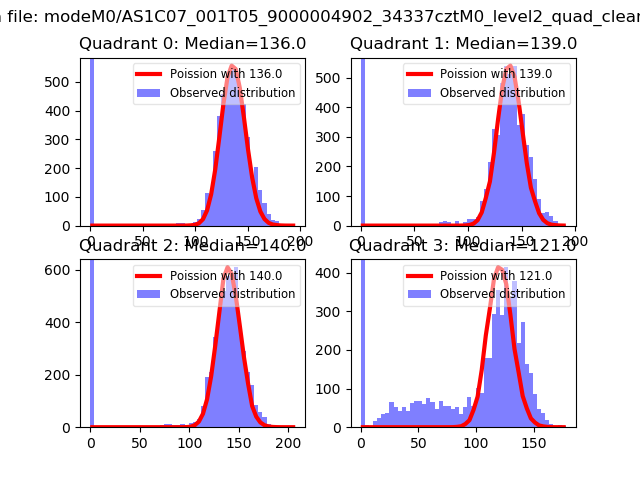 |
 |
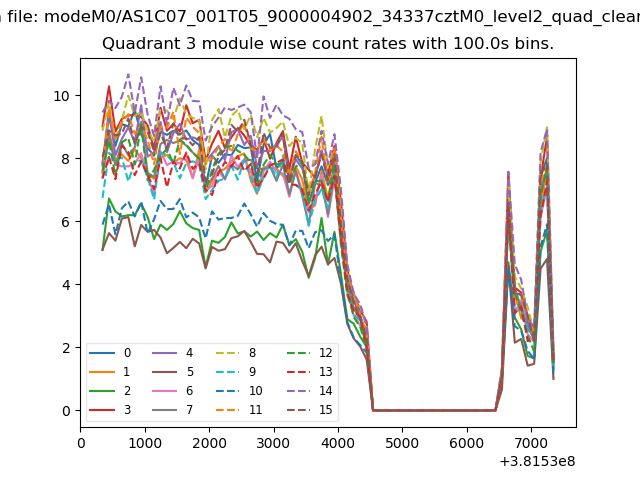
| Quadrant-wise count rates Data is divided into 100 sec bins |
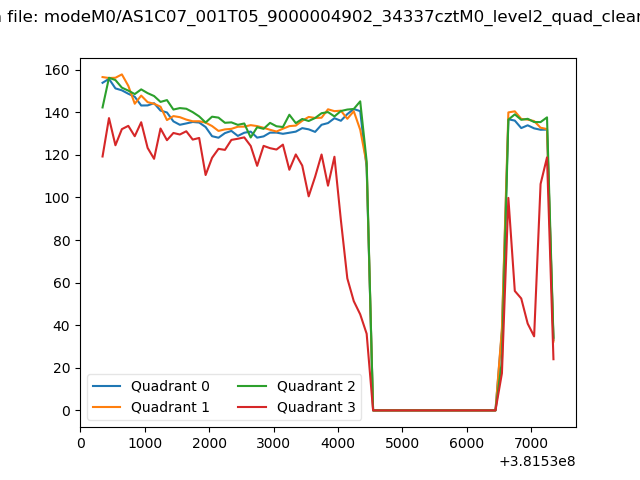 |
|
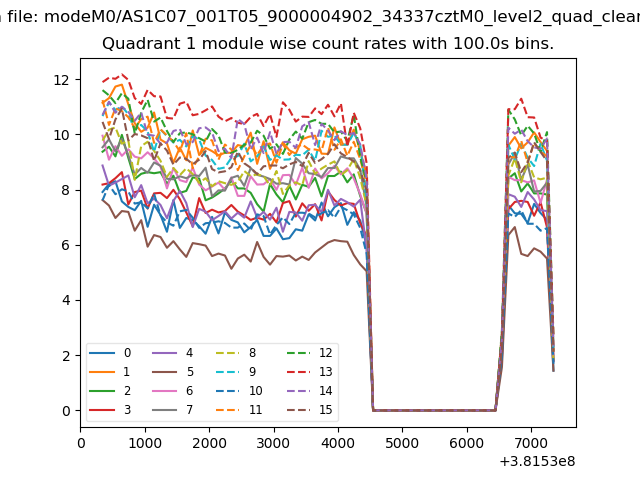
| Module-wise count rates for Quadrant A Data is divided into 100 sec bins |
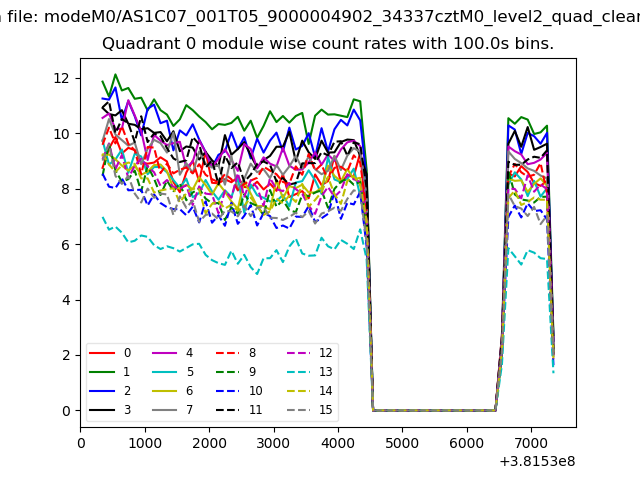 |
 |
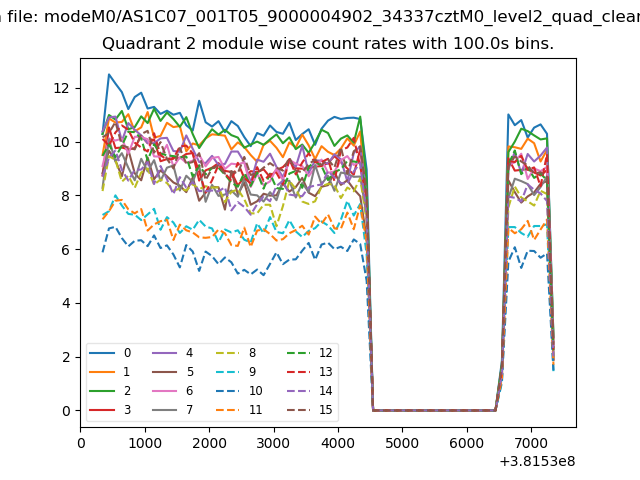
| Module-wise count rates for Quadrant B Data is divided into 100 sec bins |
 |
 |
| Module-wise count rates for Quadrant C Data is divided into 100 sec bins |
 |
 |
| Module-wise count rates for Quadrant D Data is divided into 100 sec bins |
 |
 |
| Parameter | Plot |
|---|---|
| CZT HV Monitor | 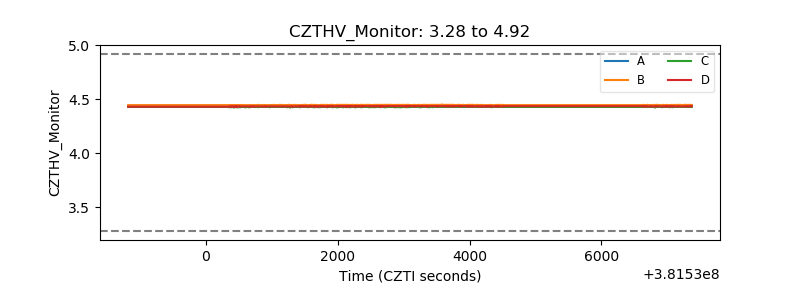 |
| D_VDD | 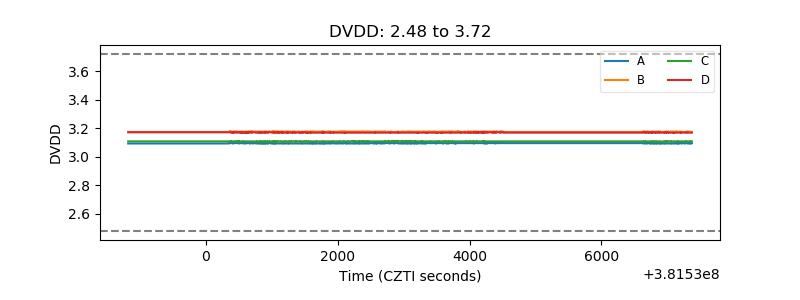 |
| Temperature 1 | 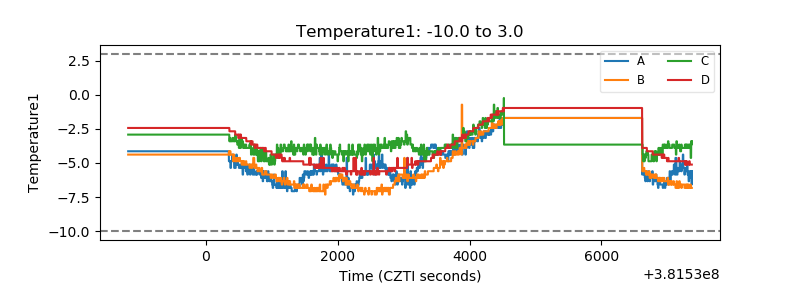 |
| Veto HV Monitor | 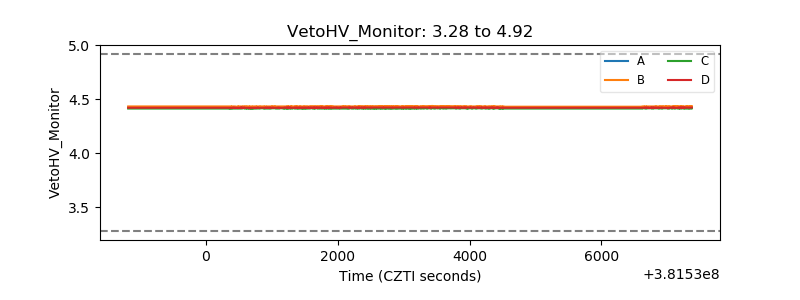 |
| Veto LLD | 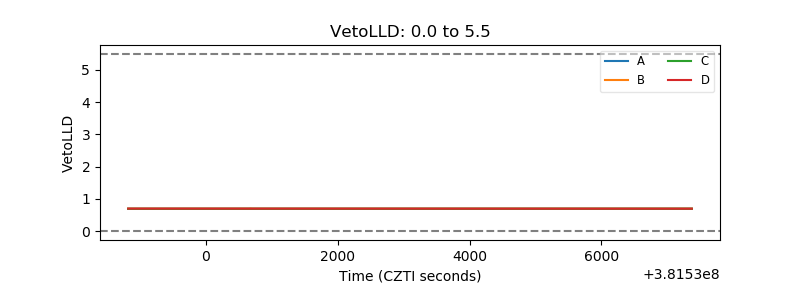 |
| Alpha Counter | 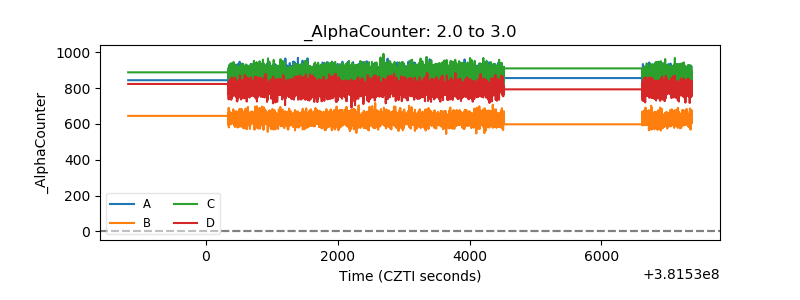 |
| _CPM_Rate | 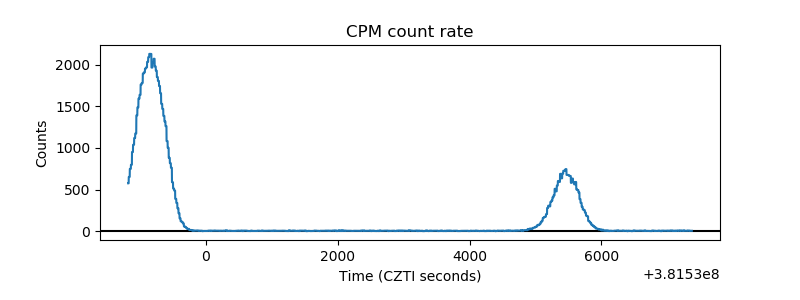 |
| CZT Counter | 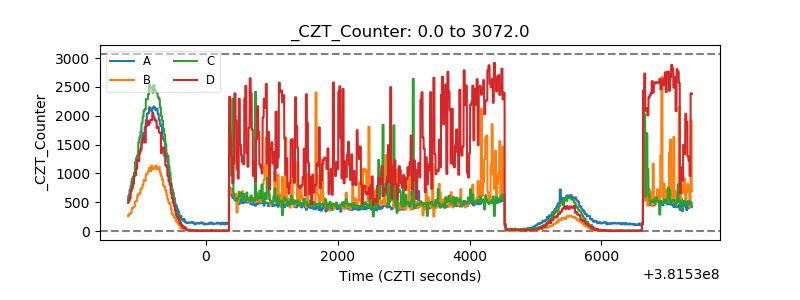 |
| +2.5 Volts monitor | 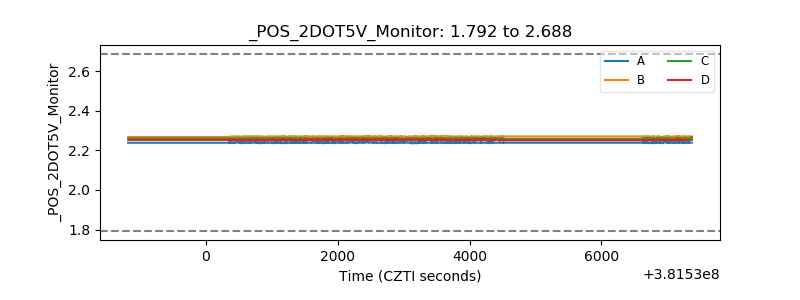 |
| +5 Volts monitor | 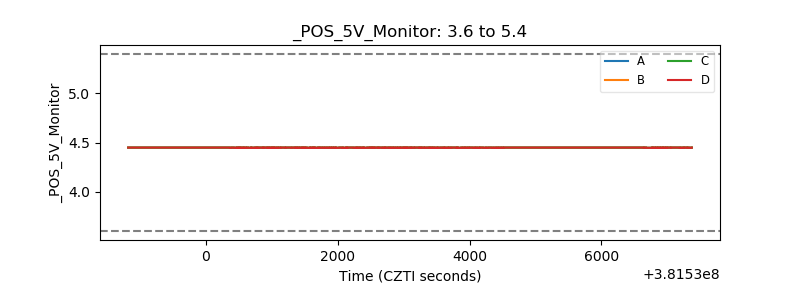 |
| _ROLL_ROT | 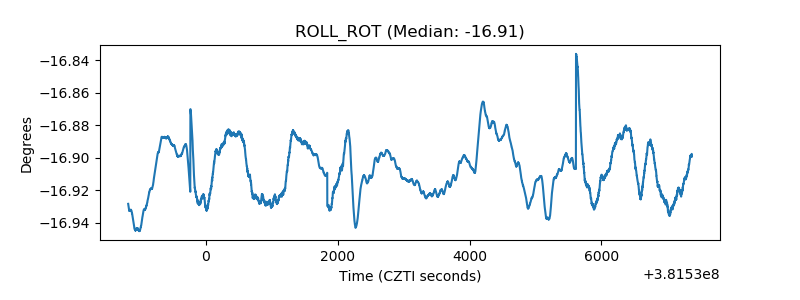 |
| _Roll_DEC | 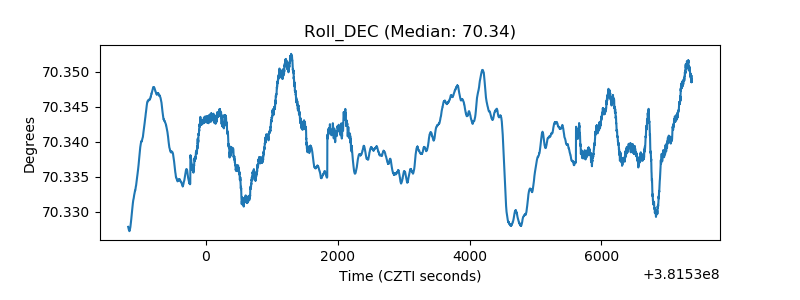 |
| _Roll_RA | 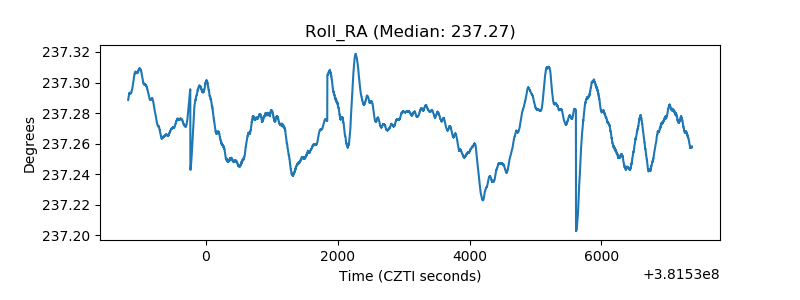 |
| Veto Counter | 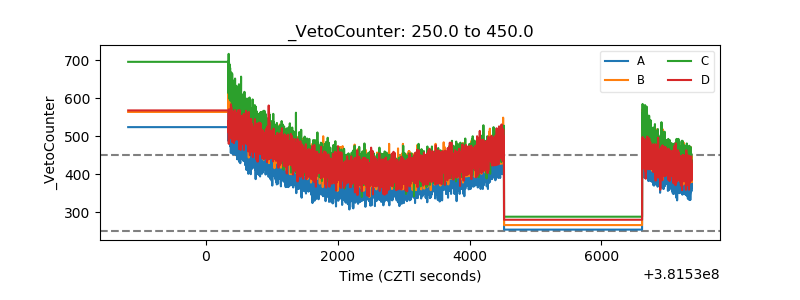 |