| Param | Original file | Final file |
|---|---|---|
| Filename | modeM0/AS1C07_001T05_9000004902_34335cztM0_level2.evt | modeM0/AS1C07_001T05_9000004902_34335cztM0_level2_quad_clean.evt |
| Size (bytes) | 509,520,960 | 104,100,480 |
| Size | 485.9 MB | 99.3 MB |
| Events in quadrant A | 2,528,567 | 712,764 |
| Events in quadrant B | 3,194,172 | 718,124 |
| Events in quadrant C | 3,049,771 | 727,845 |
| Events in quadrant D | 6,319,113 | 642,477 |
| Mode SS | |||
|---|---|---|---|
| Quadrant | BADHDUFLAG | Total packets | Discarded packets |
| A | 0 | 102 | 0 |
| B | 0 | 102 | 0 |
| C | 0 | 102 | 0 |
| D | 0 | 102 | 0 |
| Mode M9 | |||
|---|---|---|---|
| Quadrant | BADHDUFLAG | Total packets | Discarded packets |
| A | 0 | 22 | 0 |
| B | 0 | 22 | 0 |
| C | 0 | 22 | 0 |
| D | 0 | 23 | 0 |
| Mode M0 | |||
|---|---|---|---|
| Quadrant | BADHDUFLAG | Total packets | Discarded packets |
| A | 0 | 10626 | 3 |
| B | 0 | 12709 | 2 |
| C | 0 | 12295 | 2 |
| D | 0 | 22338 | 2 |
| Quadrant | Total seconds | Saturated seconds | Saturation percentage |
|---|---|---|---|
| A | 5011 | 7 | 0.139693% |
| B | 5011 | 160 | 3.192975% |
| C | 5011 | 79 | 1.576532% |
| D | 5011 | 767 | 15.306326% |
Noise dominated data is calculated using 1-second bins in cleaned event files. If a bin has >2000 counts, and if more than 50% of those come from <1% of pixels, then it is considered to be noise-dominated and hence unusable.
| Quadrant | # 1 sec bins | Bins with >0 counts | Bins with >2000 counts | High rate bins dominated by noise | Noise dominated (total time) | Noise dominated (detector-on time) | Marked lightcurve |
|---|---|---|---|---|---|---|---|
| A | 7104 | 5012 | 1 | 1 | 0.01% | 0.02% | 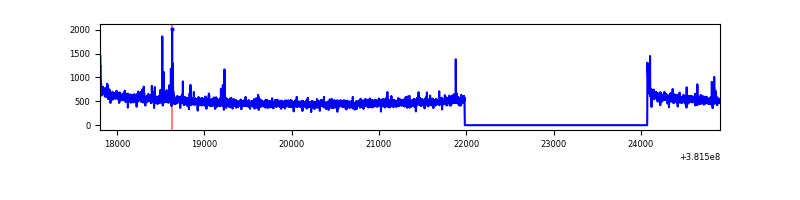 |
| B | 7104 | 5012 | 111 | 111 | 1.56% | 2.21% | 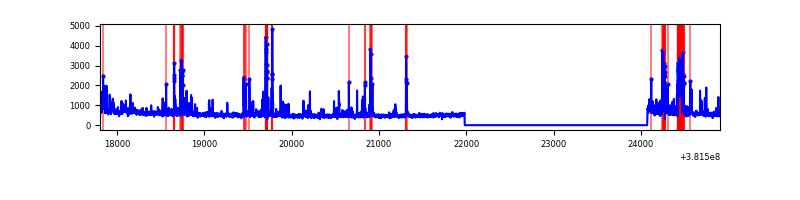 |
| C | 7104 | 5012 | 49 | 49 | 0.69% | 0.98% | 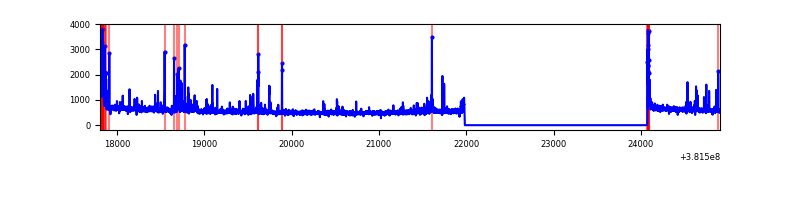 |
| D | 7104 | 5012 | 725 | 725 | 10.21% | 14.47% | 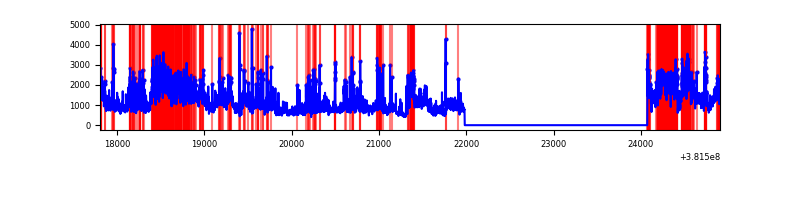 |
Top three noisy pixels from each quadrant. If the there are fewer than three noisy pixels in the level2.evt file, extra rows are filled as -1
| Pixel properties | Quadrant properties | ||||||
|---|---|---|---|---|---|---|---|
| Quadrant | DetID | PixID | Counts | Sigma | Mean | Median | Sigma |
| A | 10 | 83 | 31724 | 247.59 | 634 | 624 | 125.6 |
| A | 9 | 143 | 29645 | 231.04 | 634 | 624 | 125.6 |
| A | 13 | 6 | 17671 | 135.72 | 634 | 624 | 125.6 |
| B | 5 | 172 | 419900 | 3590.73 | 630 | 616 | 116.8 |
| B | 0 | 229 | 99943 | 850.63 | 630 | 616 | 116.8 |
| B | 5 | 255 | 72365 | 614.45 | 630 | 616 | 116.8 |
| C | 15 | 214 | 212986 | 1466.05 | 635 | 641 | 144.8 |
| C | 14 | 254 | 170415 | 1172.14 | 635 | 641 | 144.8 |
| C | 0 | 10 | 138504 | 951.82 | 635 | 641 | 144.8 |
| D | 12 | 235 | 2414684 | 15072.49 | 600 | 588 | 160.2 |
| D | 8 | 195 | 896011 | 5590.6 | 600 | 588 | 160.2 |
| D | 2 | 250 | 205023 | 1276.4 | 600 | 588 | 160.2 |
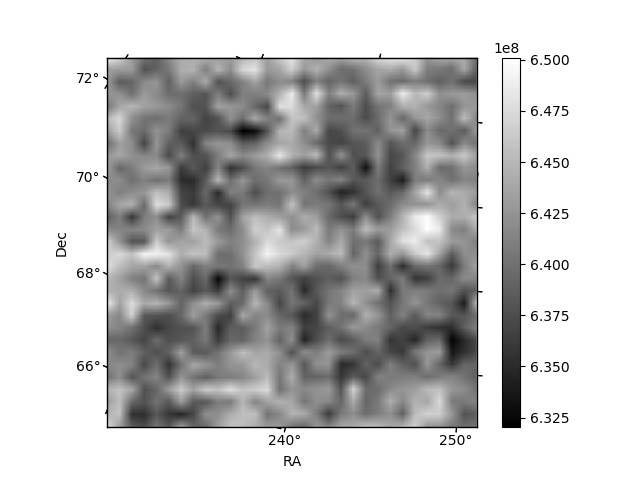
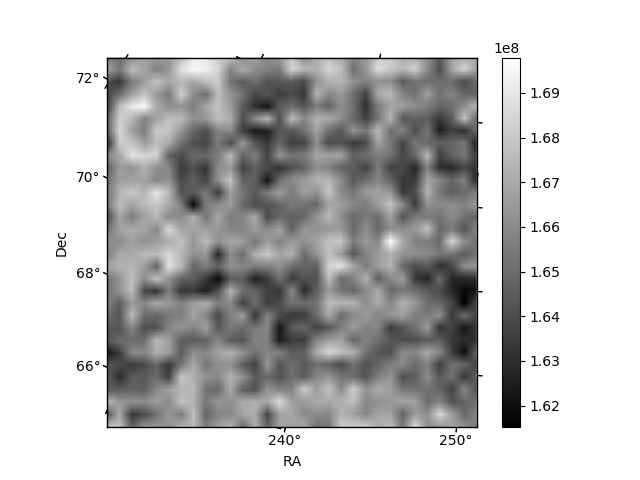
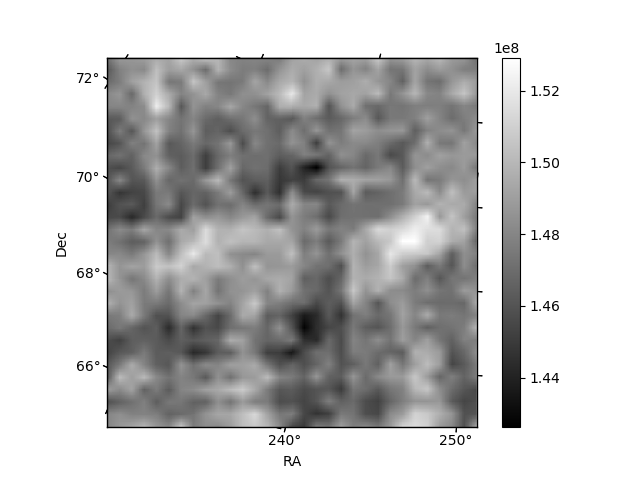
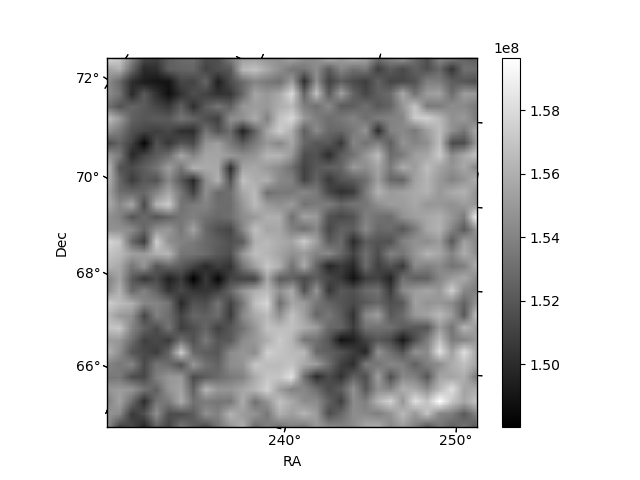
Histogram calculated using DETX and DETY for each event in the final _common_clean file
| Quadrant A | 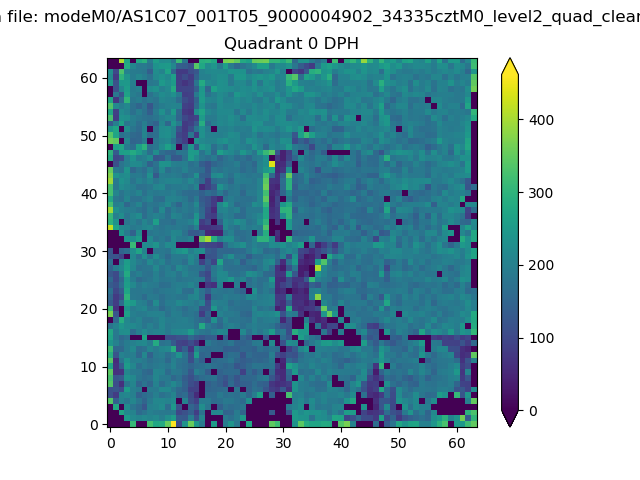 |
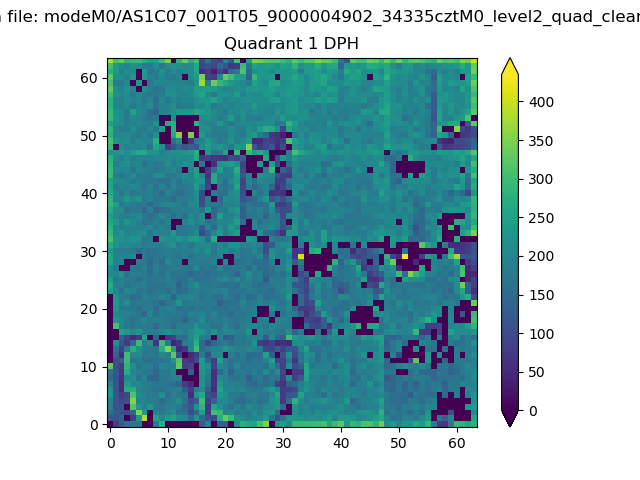 |
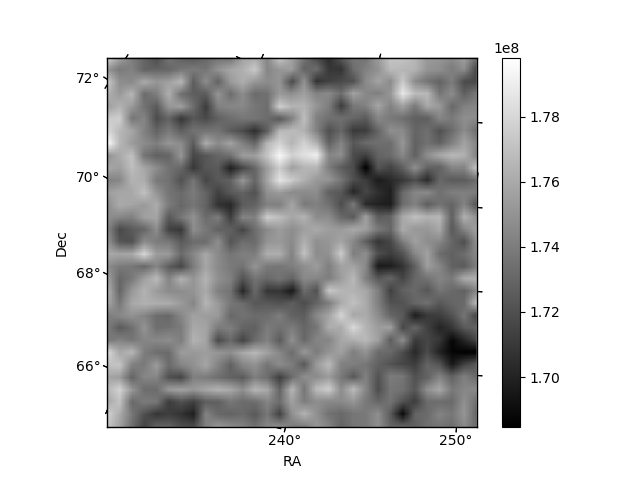
Quadrant B |
|---|---|---|---|
| Quadrant D | 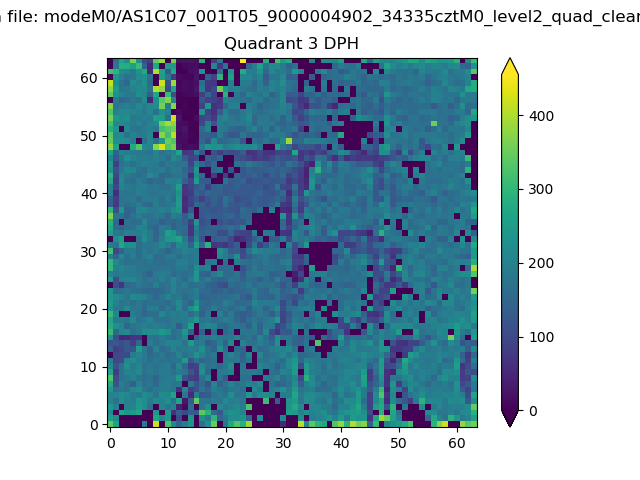 |
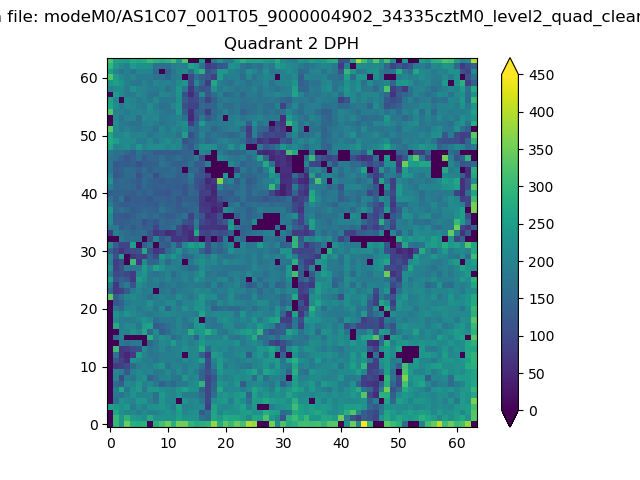 |
Quadrant C |
| Plot type | Count rate plots | Images |
|---|---|---|
| Comparison with Poisson distribution Blue bars denote a histogram of data divided into 1 sec bins. Red curve is a Poisson curve with rate = median count rate of data. |
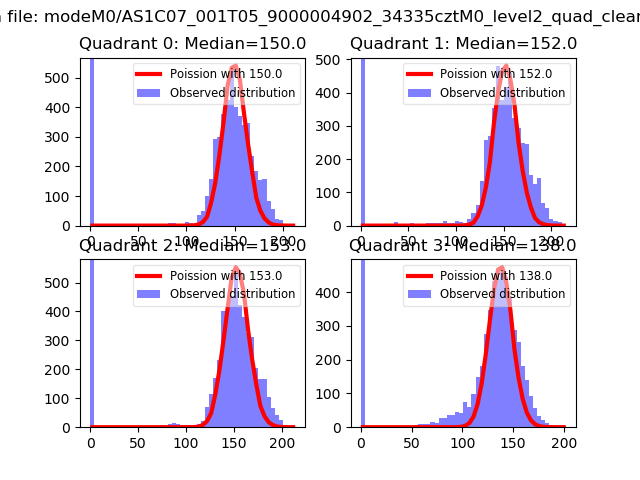 |
 |
| Quadrant-wise count rates Data is divided into 100 sec bins |
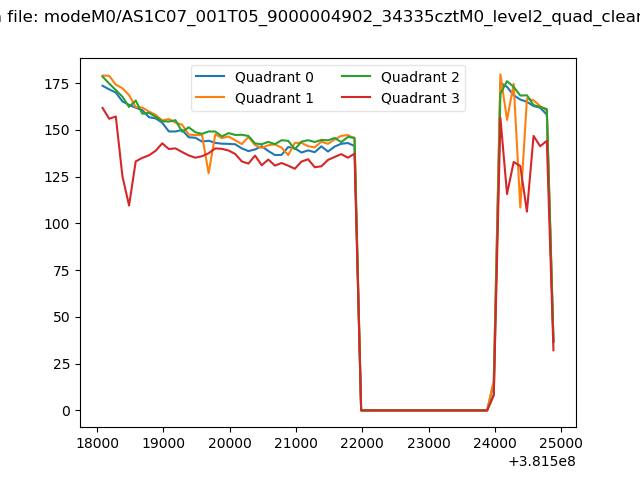 |
|
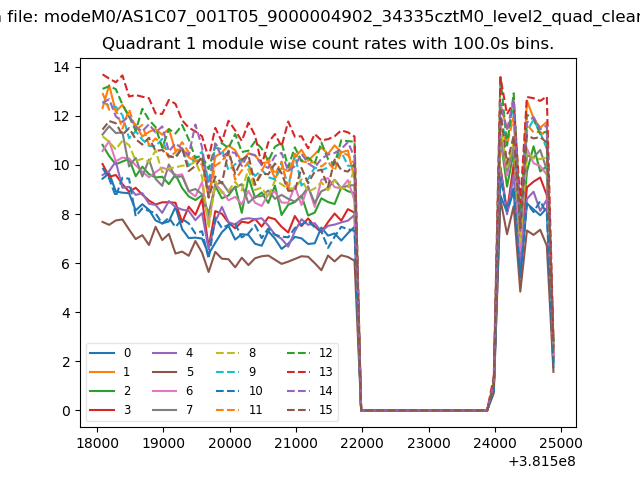
| Module-wise count rates for Quadrant A Data is divided into 100 sec bins |
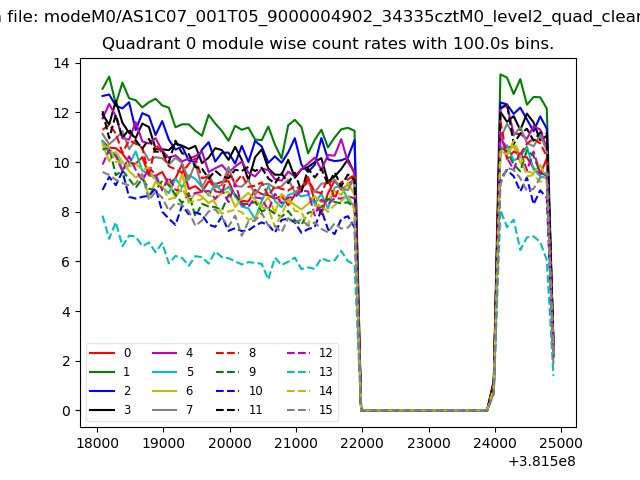 |
 |
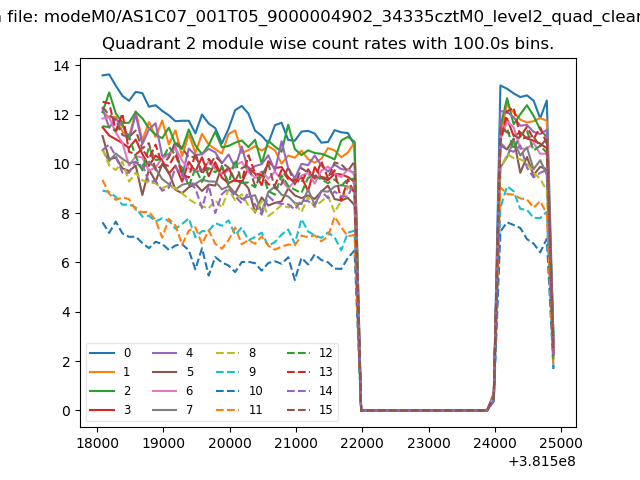
| Module-wise count rates for Quadrant B Data is divided into 100 sec bins |
 |
 |
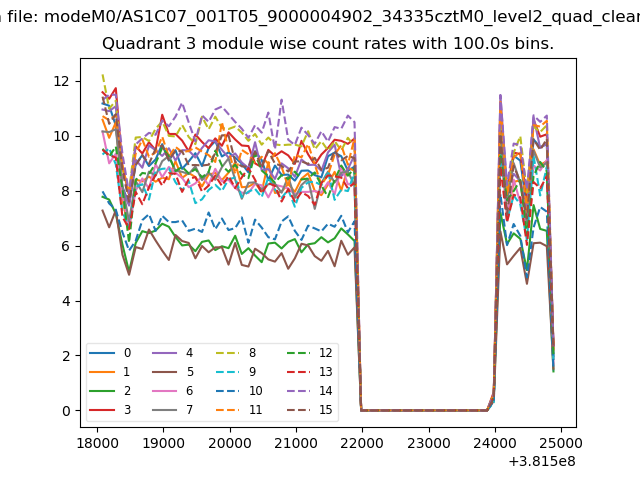
| Module-wise count rates for Quadrant C Data is divided into 100 sec bins |
 |
 |
| Module-wise count rates for Quadrant D Data is divided into 100 sec bins |
 |
 |
| Parameter | Plot |
|---|---|
| CZT HV Monitor | 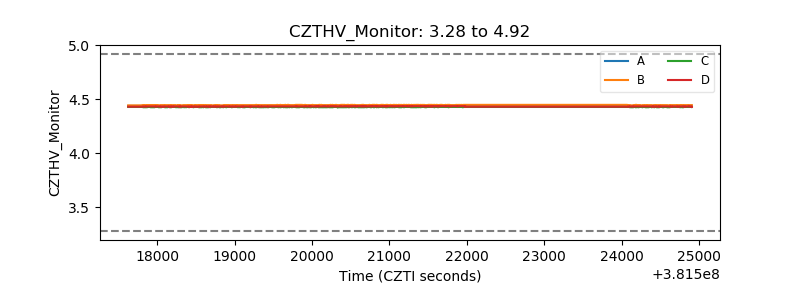 |
| D_VDD | 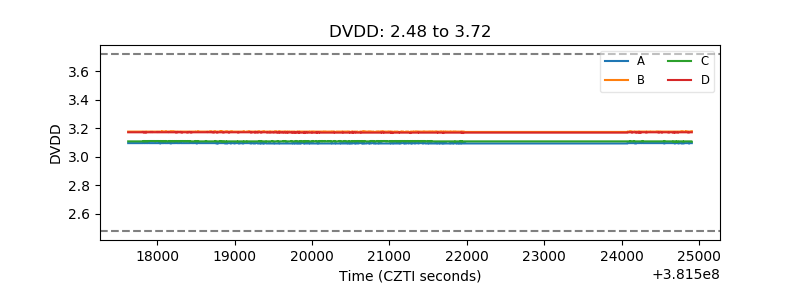 |
| Temperature 1 | 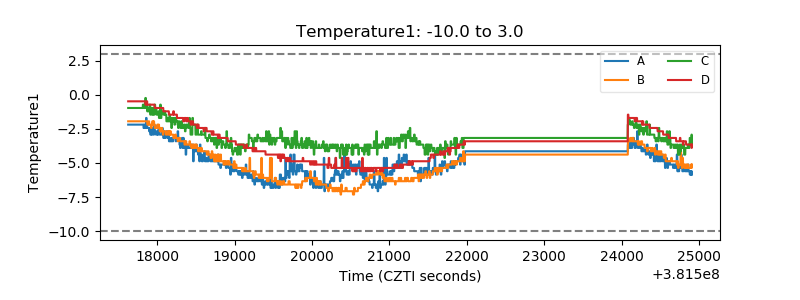 |
| Veto HV Monitor | 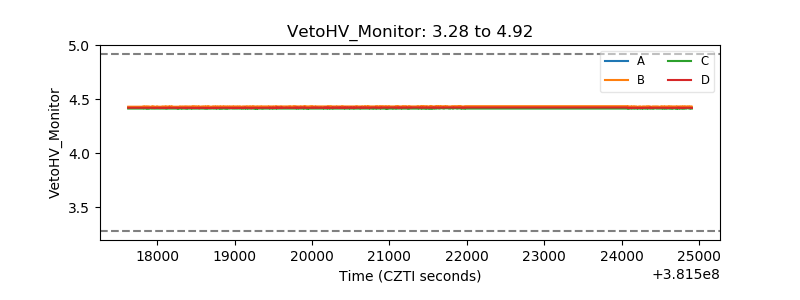 |
| Veto LLD | 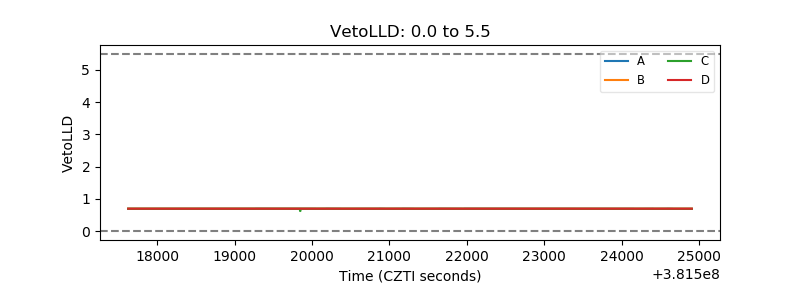 |
| Alpha Counter | 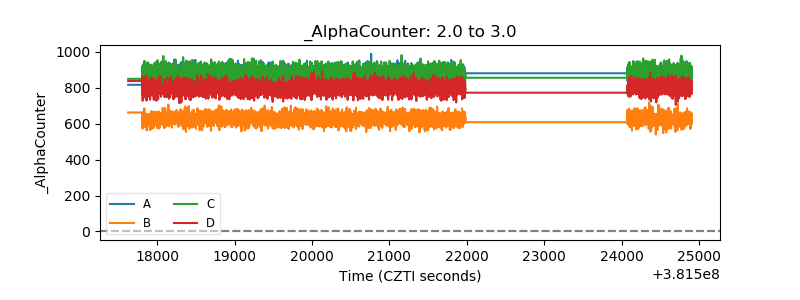 |
| _CPM_Rate | 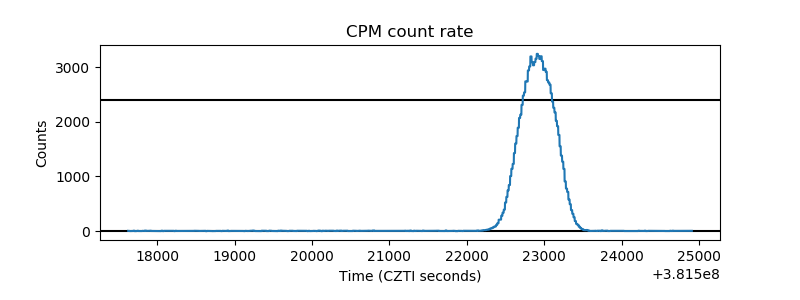 |
| CZT Counter | 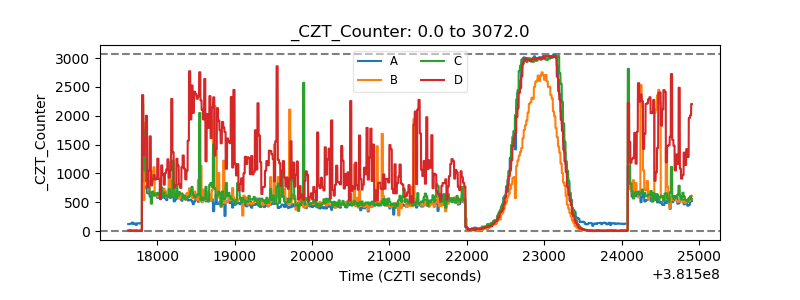 |
| +2.5 Volts monitor | 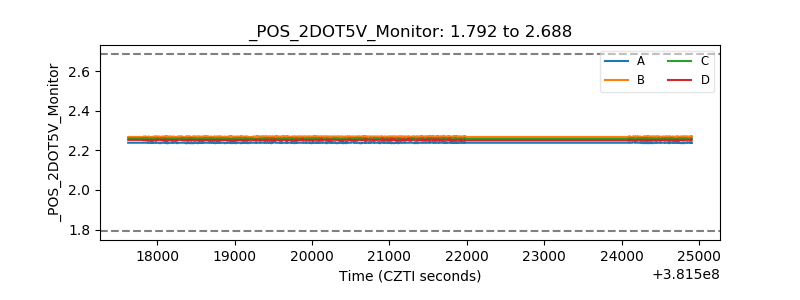 |
| +5 Volts monitor | 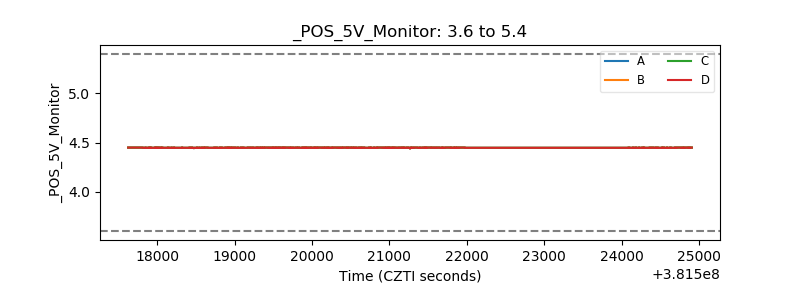 |
| _ROLL_ROT | 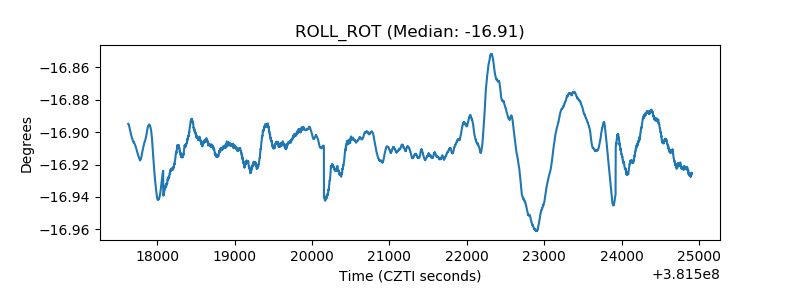 |
| _Roll_DEC | 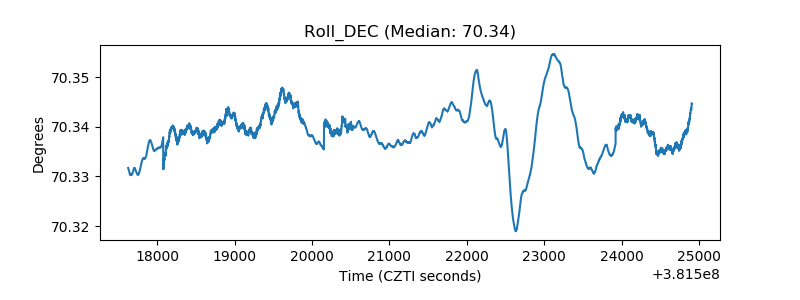 |
| _Roll_RA | 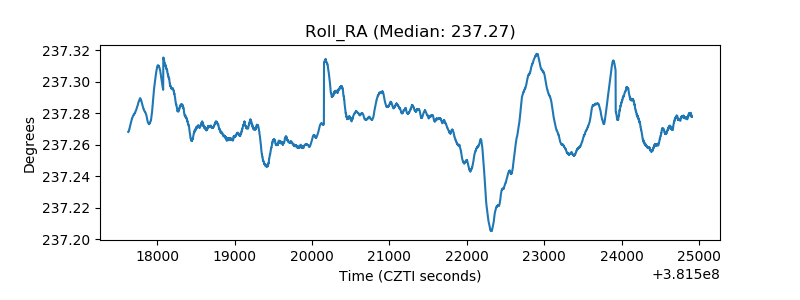 |
| Veto Counter | 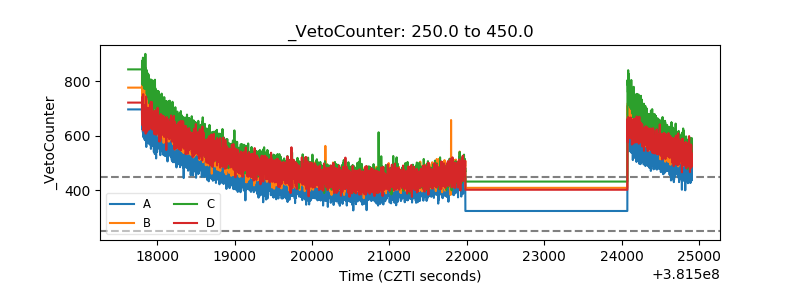 |