| Param | Original file | Final file |
|---|---|---|
| Filename | modeM0/AS1C07_001T05_9000004902_34334cztM0_level2.evt | modeM0/AS1C07_001T05_9000004902_34334cztM0_level2_quad_clean.evt |
| Size (bytes) | 489,536,640 | 92,983,680 |
| Size | 466.9 MB | 88.7 MB |
| Events in quadrant A | 2,619,295 | 625,322 |
| Events in quadrant B | 3,606,168 | 614,361 |
| Events in quadrant C | 3,027,524 | 631,467 |
| Events in quadrant D | 5,220,885 | 580,807 |
| Mode SS | |||
|---|---|---|---|
| Quadrant | BADHDUFLAG | Total packets | Discarded packets |
| A | 0 | 106 | 0 |
| B | 0 | 106 | 0 |
| C | 0 | 106 | 0 |
| D | 0 | 106 | 0 |
| Mode M9 | |||
|---|---|---|---|
| Quadrant | BADHDUFLAG | Total packets | Discarded packets |
| A | 0 | 19 | 0 |
| B | 0 | 19 | 0 |
| C | 0 | 19 | 0 |
| D | 0 | 20 | 0 |
| Mode M0 | |||
|---|---|---|---|
| Quadrant | BADHDUFLAG | Total packets | Discarded packets |
| A | 0 | 11094 | 3 |
| B | 0 | 14227 | 2 |
| C | 0 | 12235 | 2 |
| D | 0 | 19174 | 2 |
| Quadrant | Total seconds | Saturated seconds | Saturation percentage |
|---|---|---|---|
| A | 5193 | 5 | 0.096283% |
| B | 5193 | 266 | 5.122280% |
| C | 5193 | 82 | 1.579049% |
| D | 5193 | 347 | 6.682072% |
Noise dominated data is calculated using 1-second bins in cleaned event files. If a bin has >2000 counts, and if more than 50% of those come from <1% of pixels, then it is considered to be noise-dominated and hence unusable.
| Quadrant | # 1 sec bins | Bins with >0 counts | Bins with >2000 counts | High rate bins dominated by noise | Noise dominated (total time) | Noise dominated (detector-on time) | Marked lightcurve |
|---|---|---|---|---|---|---|---|
| A | 7165 | 5194 | 1 | 1 | 0.01% | 0.02% | 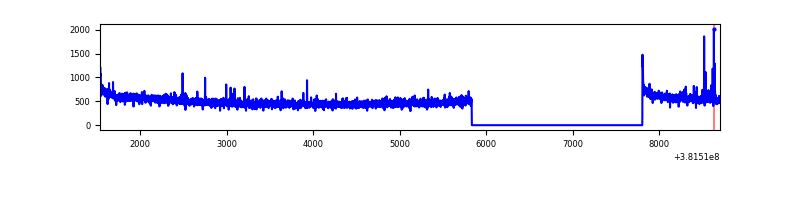 |
| B | 7165 | 5194 | 187 | 187 | 2.61% | 3.60% | 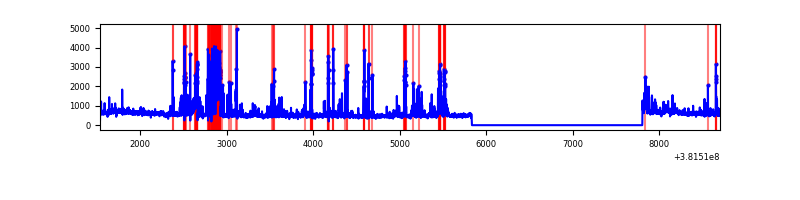 |
| C | 7165 | 5194 | 45 | 45 | 0.63% | 0.87% | 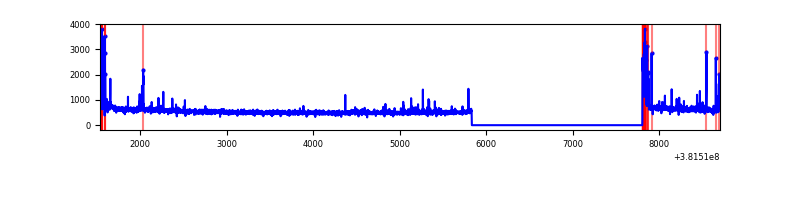 |
| D | 7165 | 5194 | 298 | 298 | 4.16% | 5.74% | 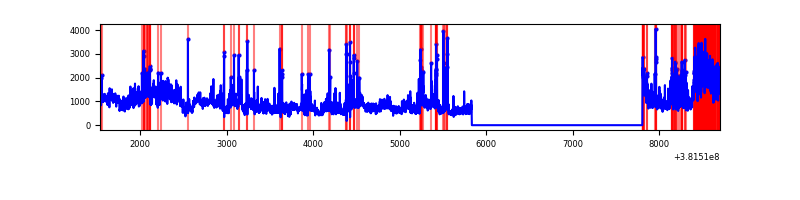 |
Top three noisy pixels from each quadrant. If the there are fewer than three noisy pixels in the level2.evt file, extra rows are filled as -1
| Pixel properties | Quadrant properties | ||||||
|---|---|---|---|---|---|---|---|
| Quadrant | DetID | PixID | Counts | Sigma | Mean | Median | Sigma |
| A | 10 | 83 | 31958 | 241.1 | 658 | 646 | 129.9 |
| A | 9 | 143 | 24587 | 184.34 | 658 | 646 | 129.9 |
| A | 13 | 6 | 12234 | 89.23 | 658 | 646 | 129.9 |
| B | 5 | 200 | 428349 | 3577.69 | 646 | 630 | 119.6 |
| B | 5 | 172 | 349122 | 2914.99 | 646 | 630 | 119.6 |
| B | 0 | 229 | 73346 | 608.24 | 646 | 630 | 119.6 |
| C | 15 | 214 | 217479 | 1466.21 | 651 | 657 | 147.9 |
| C | 0 | 10 | 156448 | 1053.5 | 651 | 657 | 147.9 |
| C | 14 | 254 | 72023 | 482.6 | 651 | 657 | 147.9 |
| D | 12 | 235 | 1289523 | 8340.51 | 639 | 624 | 154.5 |
| D | 8 | 195 | 886668 | 5733.62 | 639 | 624 | 154.5 |
| D | 1 | 52 | 165660 | 1067.95 | 639 | 624 | 154.5 |
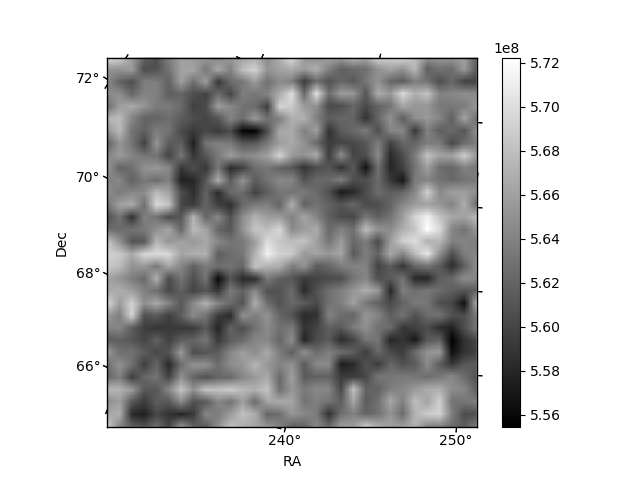
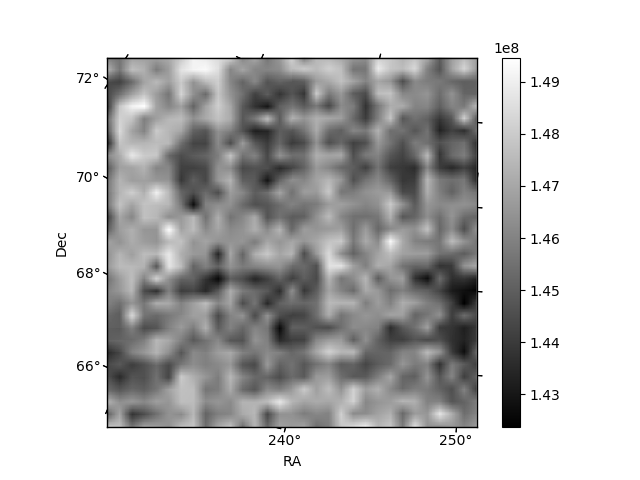
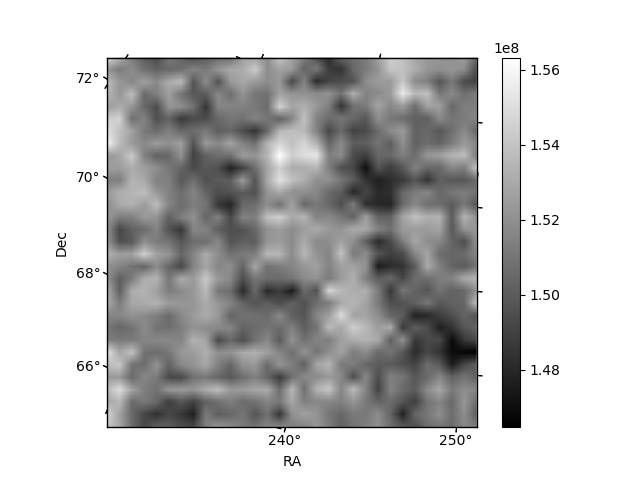
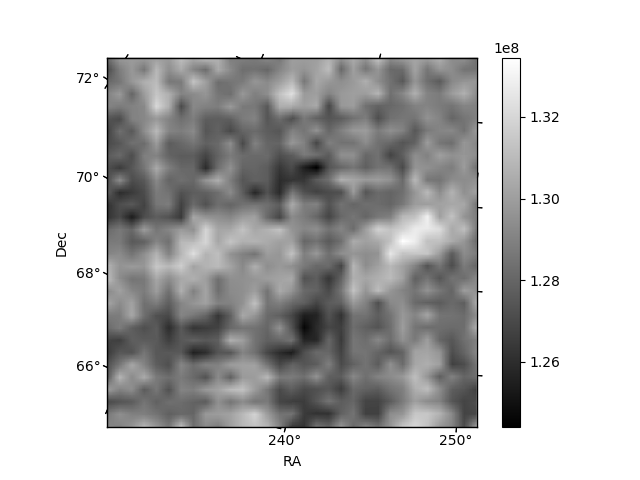
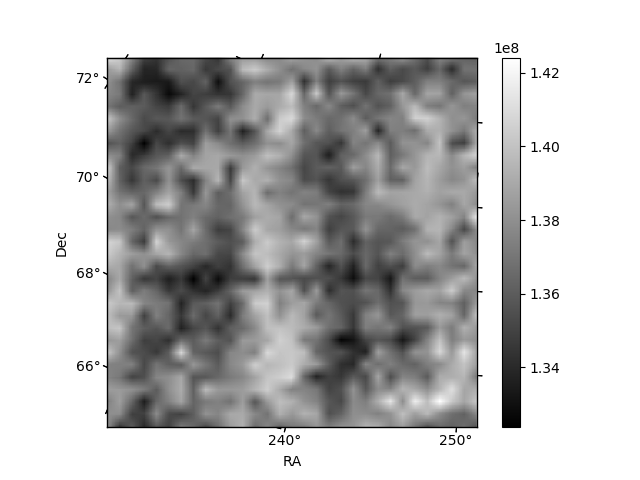
Histogram calculated using DETX and DETY for each event in the final _common_clean file
| Quadrant A | 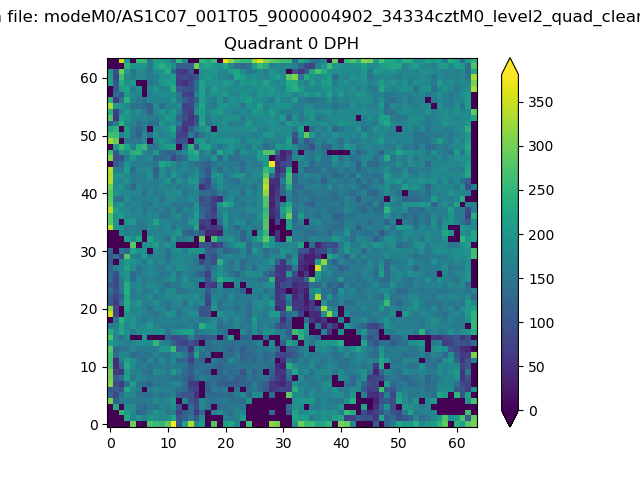 |
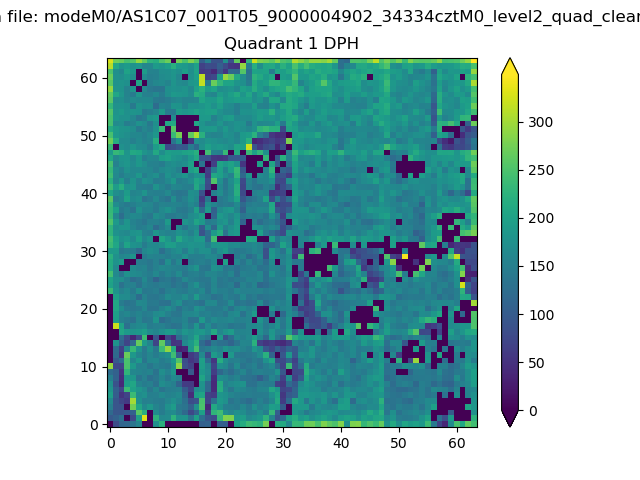 |
Quadrant B |
|---|---|---|---|
| Quadrant D |  |
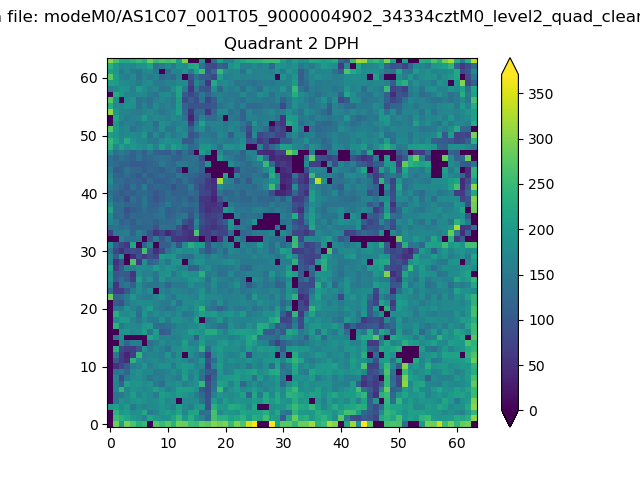 |
Quadrant C |
| Plot type | Count rate plots | Images |
|---|---|---|
| Comparison with Poisson distribution Blue bars denote a histogram of data divided into 1 sec bins. Red curve is a Poisson curve with rate = median count rate of data. |
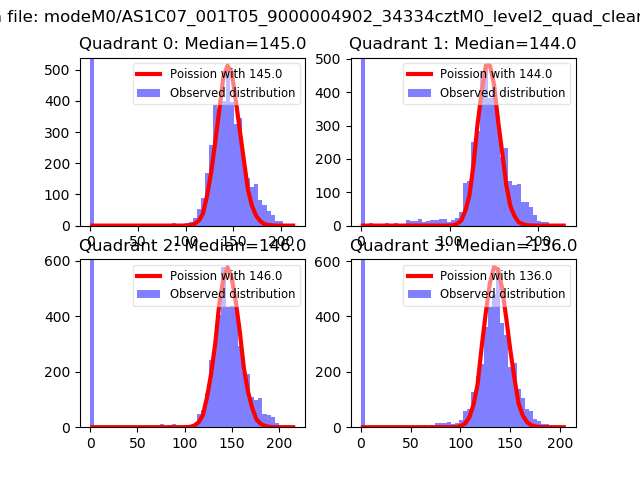 |
 |
| Quadrant-wise count rates Data is divided into 100 sec bins |
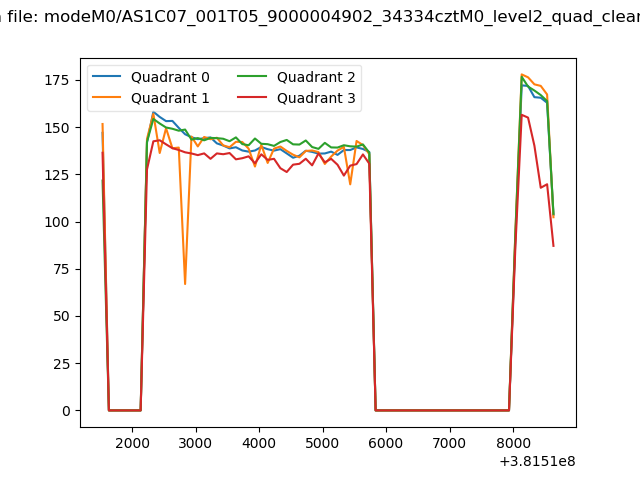 |
|
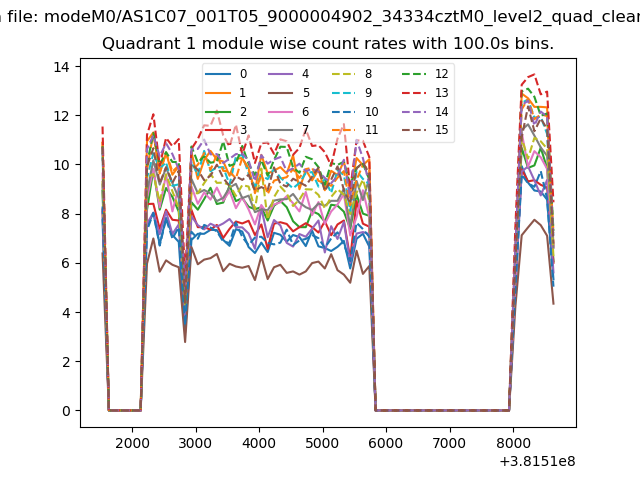
| Module-wise count rates for Quadrant A Data is divided into 100 sec bins |
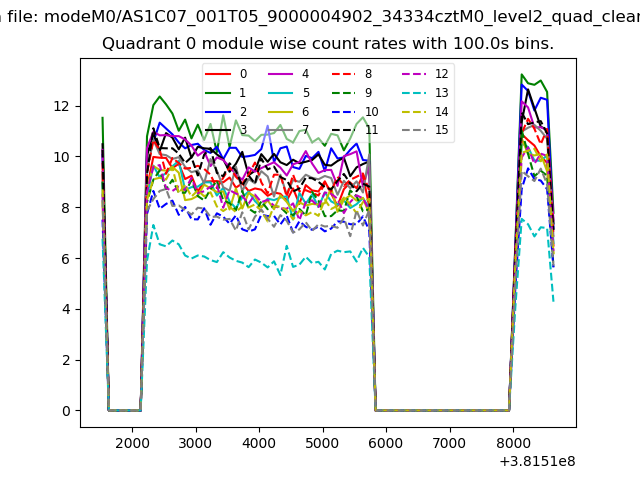 |
 |
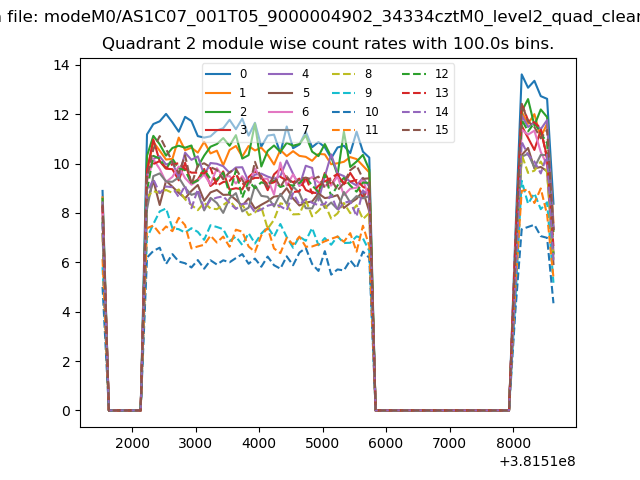
| Module-wise count rates for Quadrant B Data is divided into 100 sec bins |
 |
 |
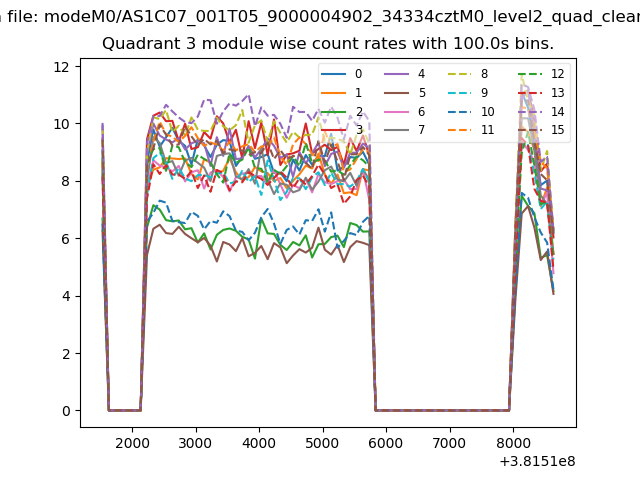
| Module-wise count rates for Quadrant C Data is divided into 100 sec bins |
 |
 |
| Module-wise count rates for Quadrant D Data is divided into 100 sec bins |
 |
 |
| Parameter | Plot |
|---|---|
| CZT HV Monitor |  |
| D_VDD | 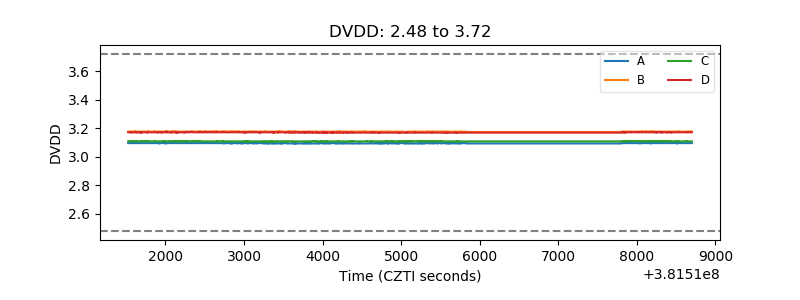 |
| Temperature 1 | 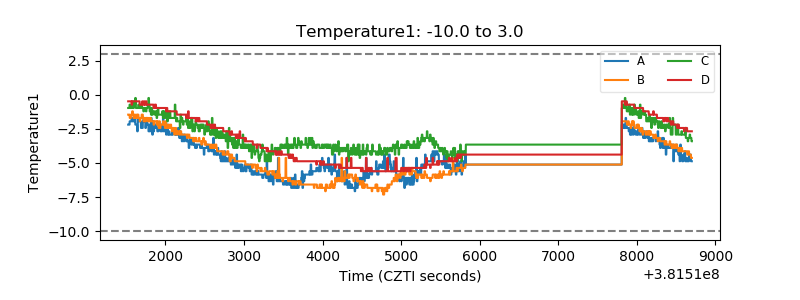 |
| Veto HV Monitor | 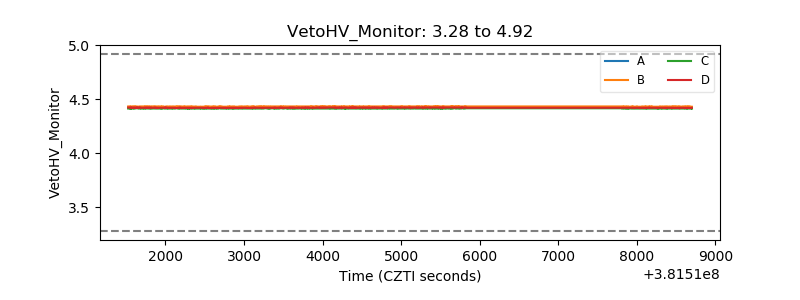 |
| Veto LLD | 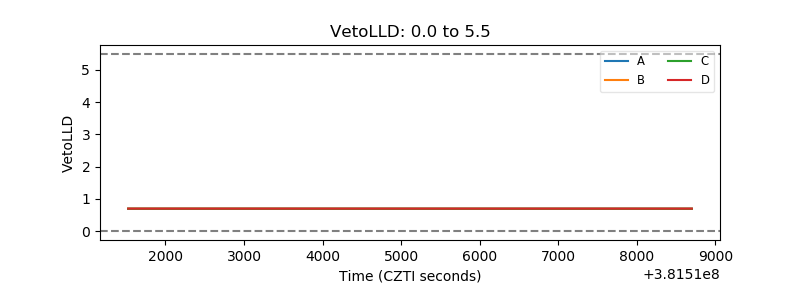 |
| Alpha Counter | 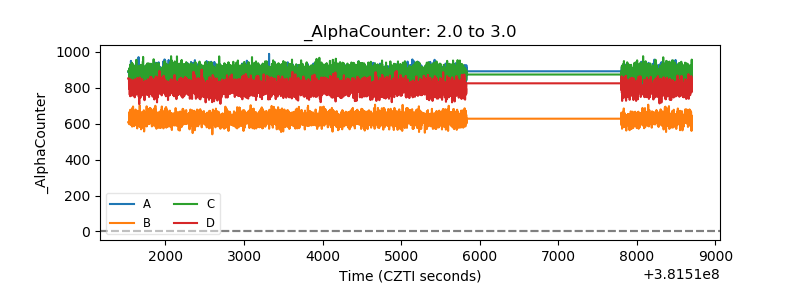 |
| _CPM_Rate | 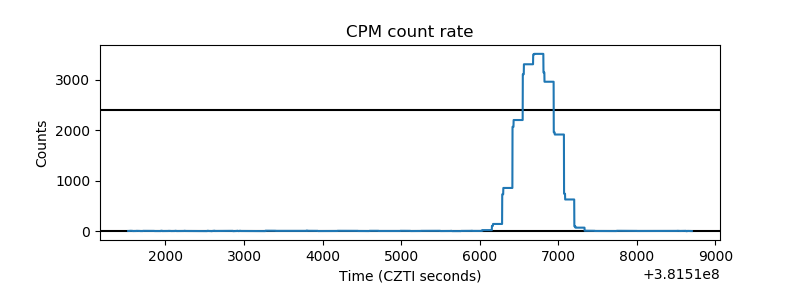 |
| CZT Counter | 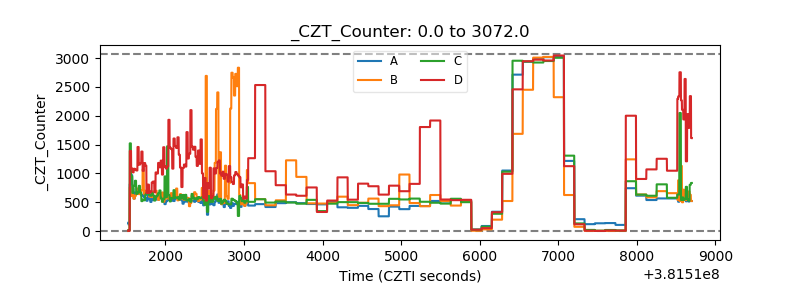 |
| +2.5 Volts monitor | 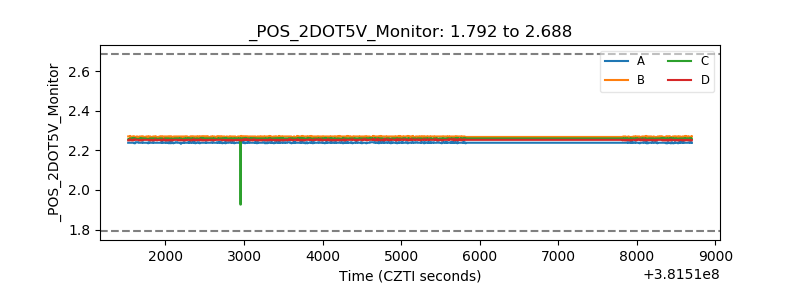 |
| +5 Volts monitor | 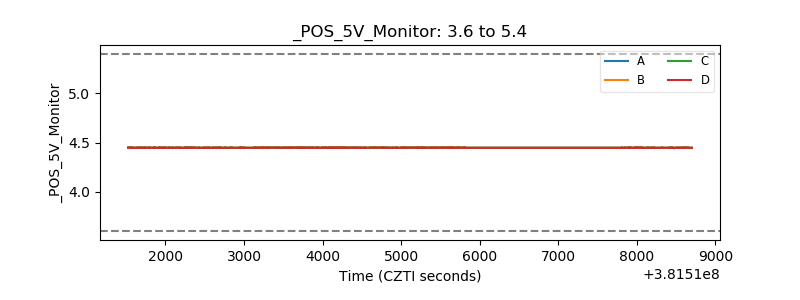 |
| _ROLL_ROT | 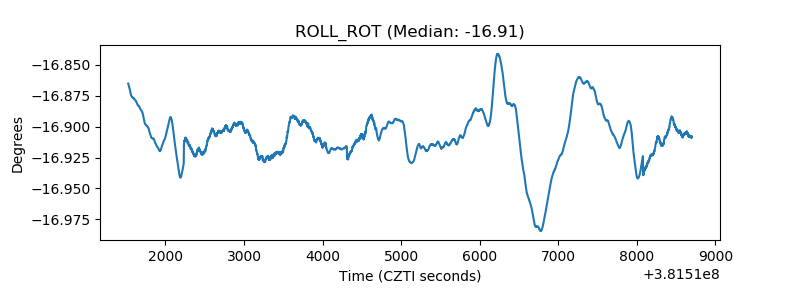 |
| _Roll_DEC | 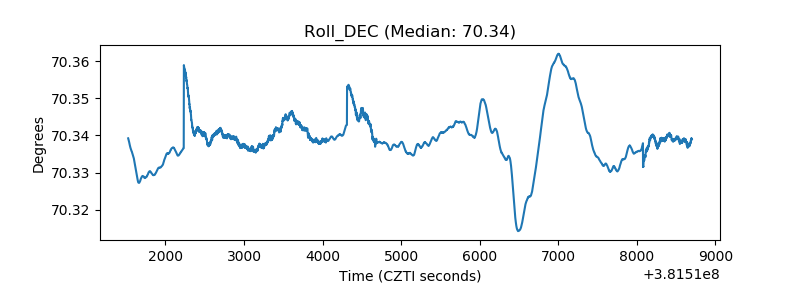 |
| _Roll_RA |  |
| Veto Counter | 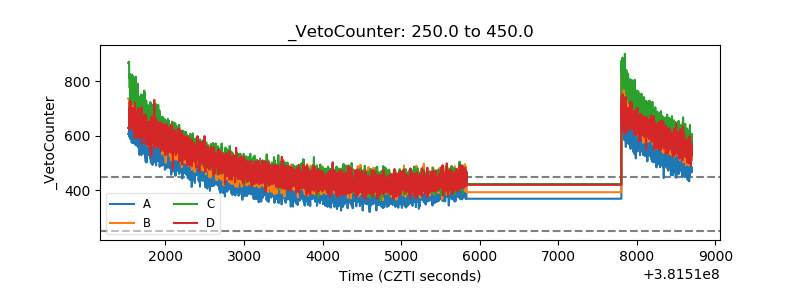 |