| Param | Original file | Final file |
|---|---|---|
| Filename | modeM0/AS1C07_001T05_9000004902_34333cztM0_level2.evt | modeM0/AS1C07_001T05_9000004902_34333cztM0_level2_quad_clean.evt |
| Size (bytes) | 484,418,880 | 83,646,720 |
| Size | 462.0 MB | 79.8 MB |
| Events in quadrant A | 2,561,171 | 551,068 |
| Events in quadrant B | 3,069,392 | 552,880 |
| Events in quadrant C | 3,017,763 | 546,869 |
| Events in quadrant D | 5,664,532 | 512,402 |
| Mode SS | |||
|---|---|---|---|
| Quadrant | BADHDUFLAG | Total packets | Discarded packets |
| A | 0 | 108 | 0 |
| B | 0 | 108 | 0 |
| C | 0 | 108 | 0 |
| D | 0 | 108 | 0 |
| Mode M9 | |||
|---|---|---|---|
| Quadrant | BADHDUFLAG | Total packets | Discarded packets |
| A | 0 | 19 | 0 |
| B | 0 | 19 | 0 |
| C | 0 | 19 | 0 |
| D | 0 | 19 | 0 |
| Mode M0 | |||
|---|---|---|---|
| Quadrant | BADHDUFLAG | Total packets | Discarded packets |
| A | 0 | 11057 | 3 |
| B | 0 | 12580 | 2 |
| C | 0 | 12235 | 2 |
| D | 0 | 20446 | 2 |
| Quadrant | Total seconds | Saturated seconds | Saturation percentage |
|---|---|---|---|
| A | 5279 | 4 | 0.075772% |
| B | 5279 | 54 | 1.022921% |
| C | 5279 | 55 | 1.041864% |
| D | 5279 | 466 | 8.827429% |
Noise dominated data is calculated using 1-second bins in cleaned event files. If a bin has >2000 counts, and if more than 50% of those come from <1% of pixels, then it is considered to be noise-dominated and hence unusable.
| Quadrant | # 1 sec bins | Bins with >0 counts | Bins with >2000 counts | High rate bins dominated by noise | Noise dominated (total time) | Noise dominated (detector-on time) | Marked lightcurve |
|---|---|---|---|---|---|---|---|
| A | 7132 | 5280 | 1 | 1 | 0.01% | 0.02% |  |
| B | 7132 | 5280 | 35 | 35 | 0.49% | 0.66% | 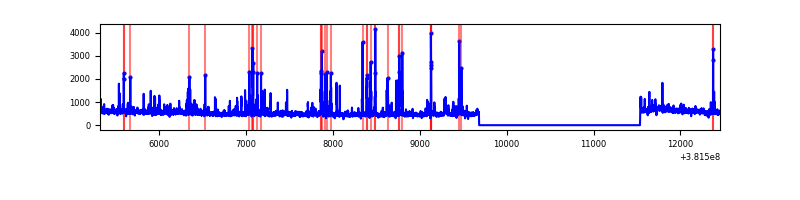 |
| C | 7132 | 5280 | 31 | 31 | 0.43% | 0.59% | 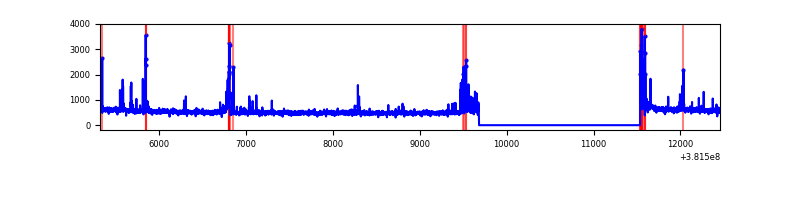 |
| D | 7132 | 5280 | 377 | 377 | 5.29% | 7.14% | 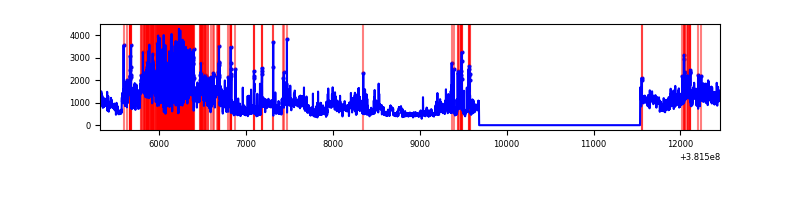 |
Top three noisy pixels from each quadrant. If the there are fewer than three noisy pixels in the level2.evt file, extra rows are filled as -1
| Pixel properties | Quadrant properties | ||||||
|---|---|---|---|---|---|---|---|
| Quadrant | DetID | PixID | Counts | Sigma | Mean | Median | Sigma |
| A | 10 | 83 | 24001 | 182.49 | 648 | 636 | 128.0 |
| A | 10 | 255 | 13661 | 101.73 | 648 | 636 | 128.0 |
| A | 9 | 143 | 11985 | 88.64 | 648 | 636 | 128.0 |
| B | 5 | 172 | 267264 | 2237.59 | 642 | 628 | 119.2 |
| B | 0 | 229 | 63809 | 530.21 | 642 | 628 | 119.2 |
| B | 0 | 219 | 44909 | 371.6 | 642 | 628 | 119.2 |
| C | 15 | 214 | 221403 | 1509.34 | 636 | 641 | 146.3 |
| C | 14 | 254 | 207441 | 1413.88 | 636 | 641 | 146.3 |
| C | 0 | 10 | 75410 | 511.19 | 636 | 641 | 146.3 |
| D | 8 | 195 | 969570 | 6483.68 | 618 | 601 | 149.4 |
| D | 1 | 52 | 719441 | 4809.99 | 618 | 601 | 149.4 |
| D | 12 | 235 | 664385 | 4441.59 | 618 | 601 | 149.4 |
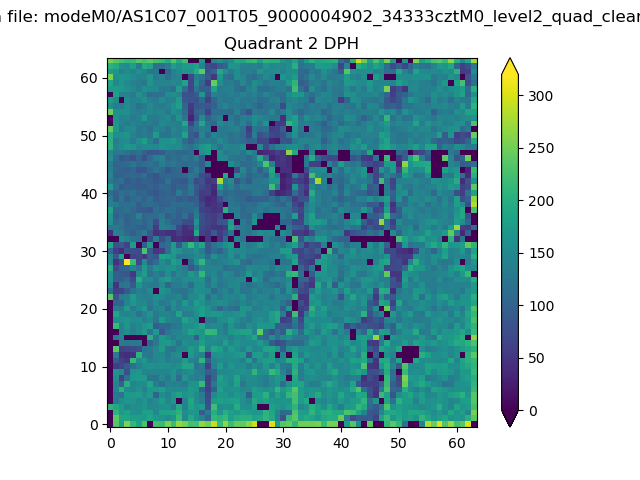
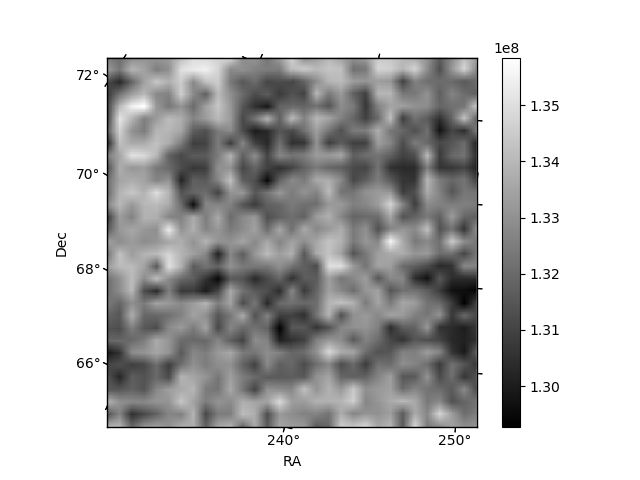
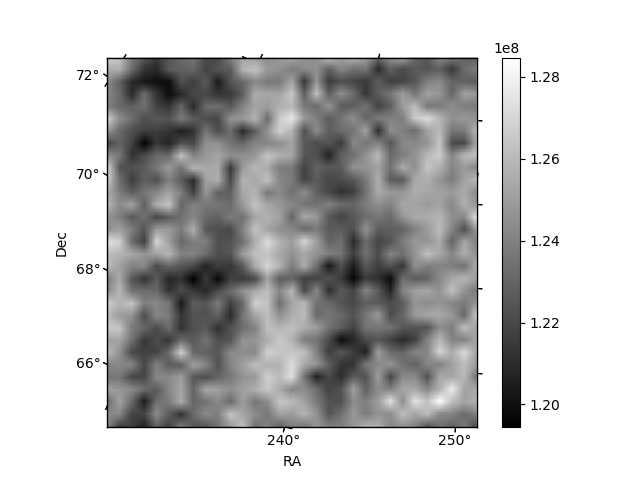
Histogram calculated using DETX and DETY for each event in the final _common_clean file
| Quadrant A | 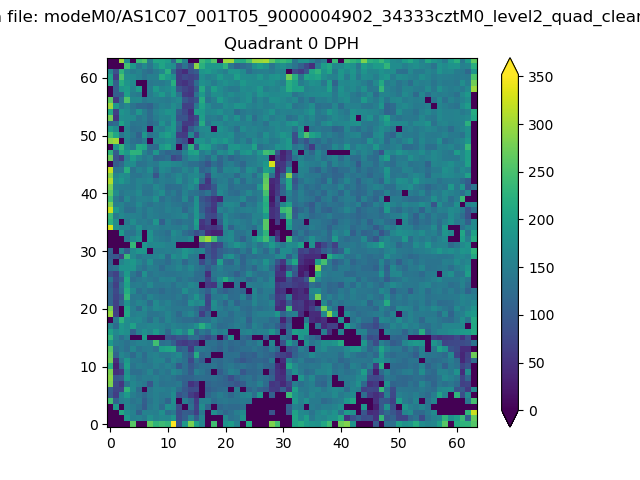 |
 |
Quadrant B |
|---|---|---|---|
| Quadrant D | 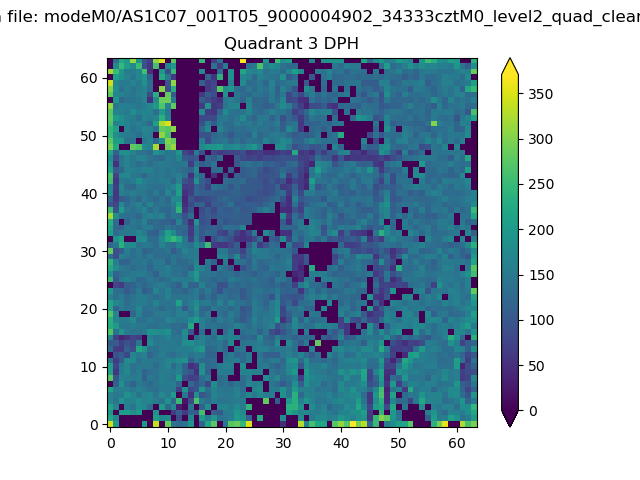 |
 |
Quadrant C |
| Plot type | Count rate plots | Images |
|---|---|---|
| Comparison with Poisson distribution Blue bars denote a histogram of data divided into 1 sec bins. Red curve is a Poisson curve with rate = median count rate of data. |
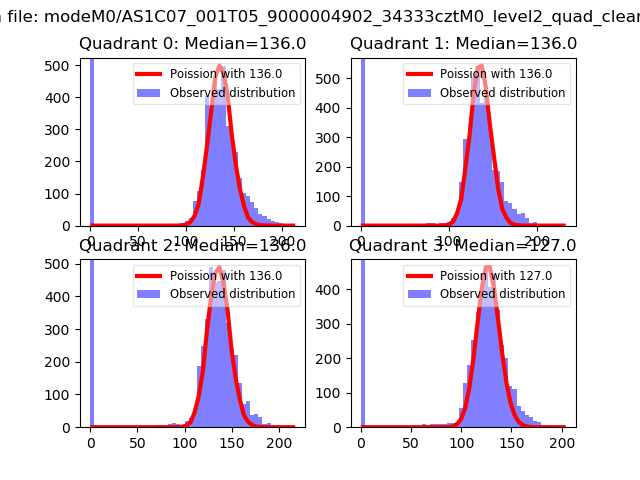 |
 |
| Quadrant-wise count rates Data is divided into 100 sec bins |
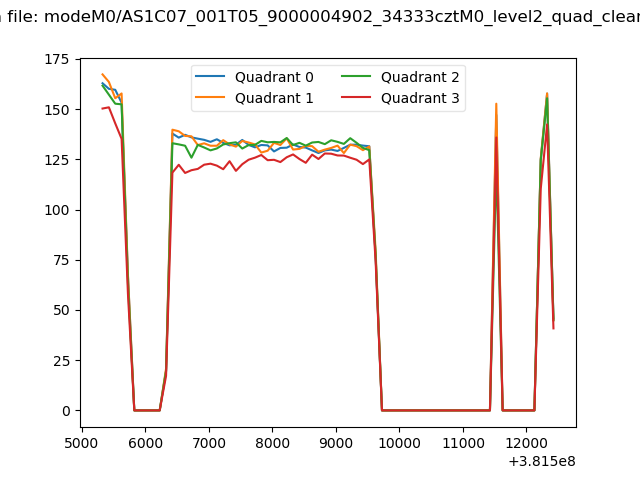 |
|
| Module-wise count rates for Quadrant A Data is divided into 100 sec bins |
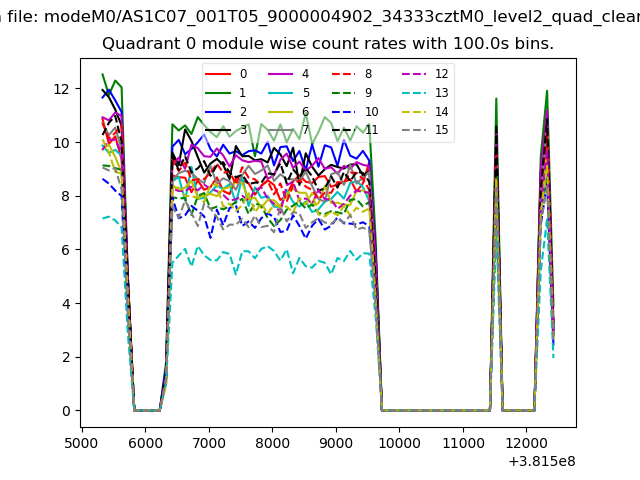 |
 |
| Module-wise count rates for Quadrant B Data is divided into 100 sec bins |
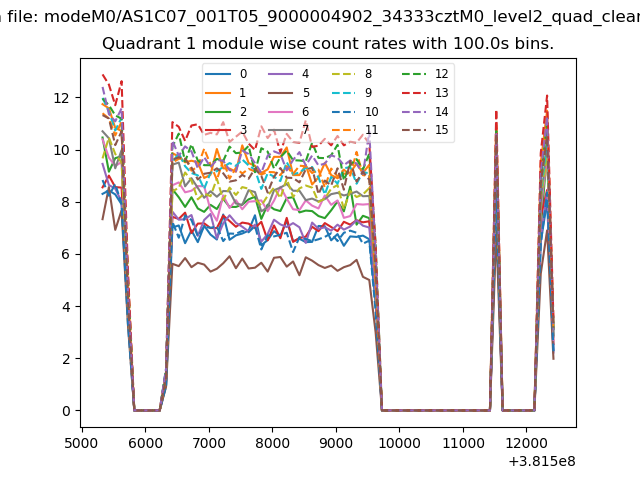 |
 |
| Module-wise count rates for Quadrant C Data is divided into 100 sec bins |
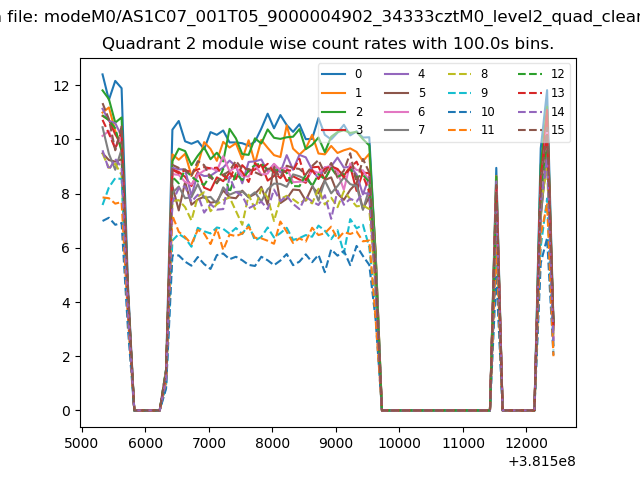 |
 |
| Module-wise count rates for Quadrant D Data is divided into 100 sec bins |
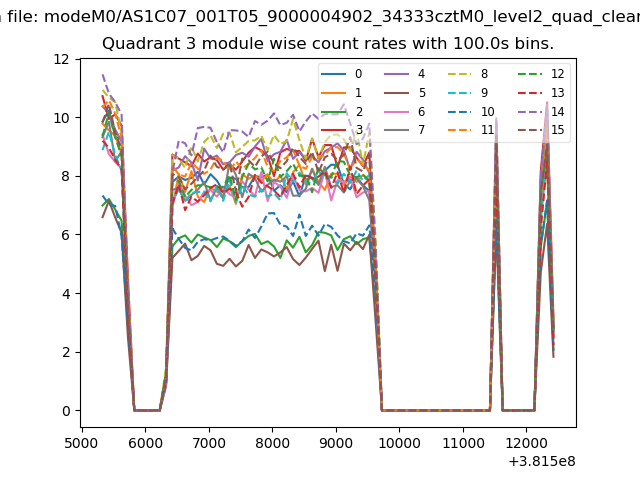 |
 |
| Parameter | Plot |
|---|---|
| CZT HV Monitor |  |
| D_VDD | 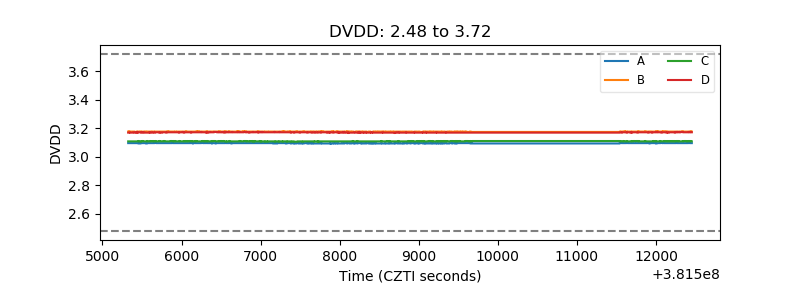 |
| Temperature 1 | 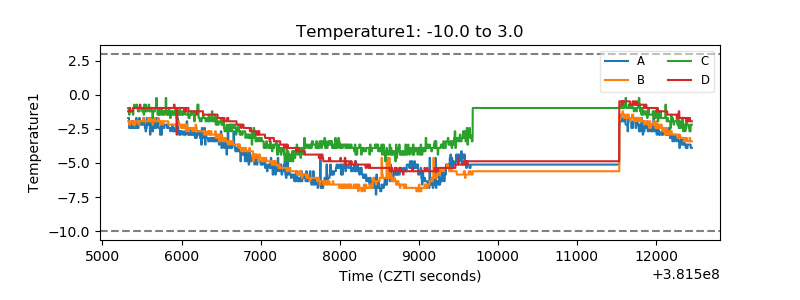 |
| Veto HV Monitor | 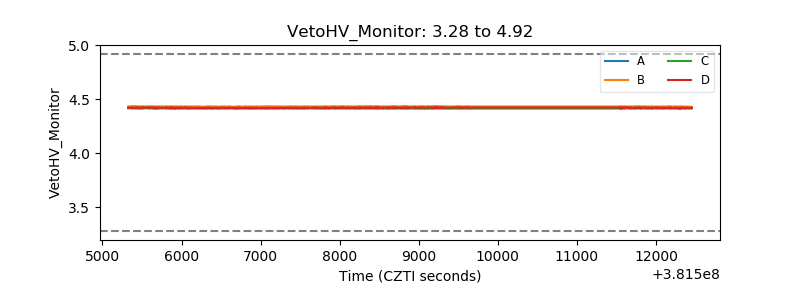 |
| Veto LLD | 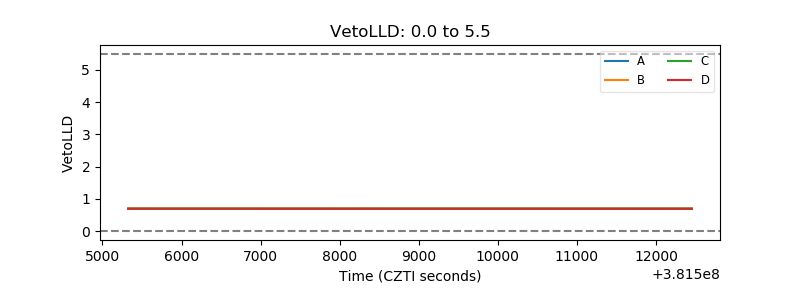 |
| Alpha Counter |  |
| _CPM_Rate | 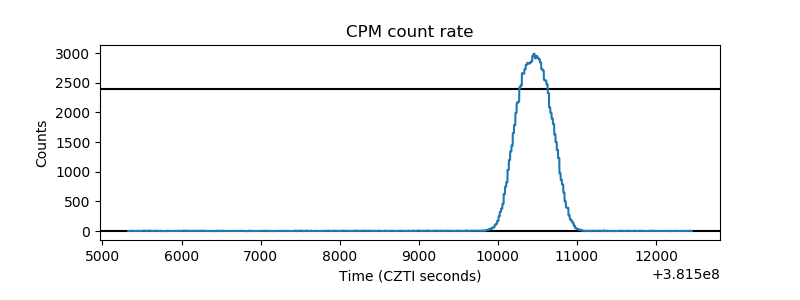 |
| CZT Counter | 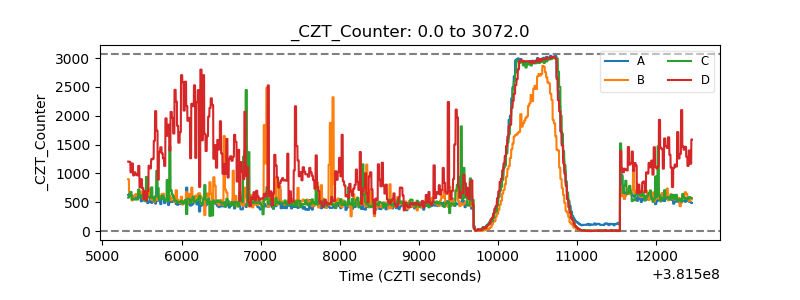 |
| +2.5 Volts monitor | 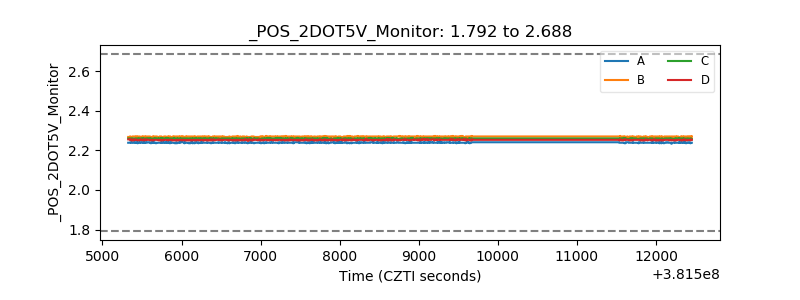 |
| +5 Volts monitor | 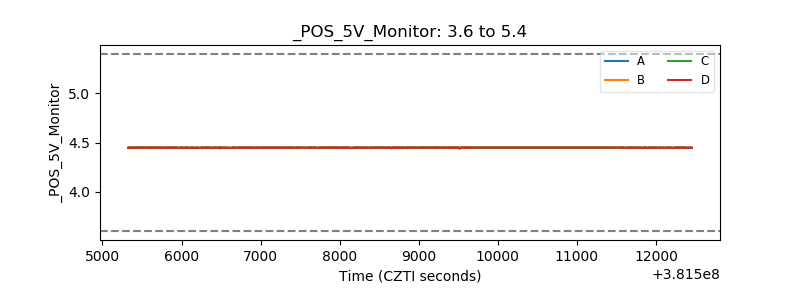 |
| _ROLL_ROT | 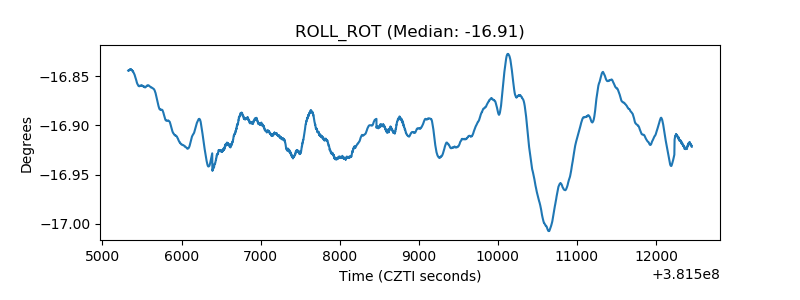 |
| _Roll_DEC | 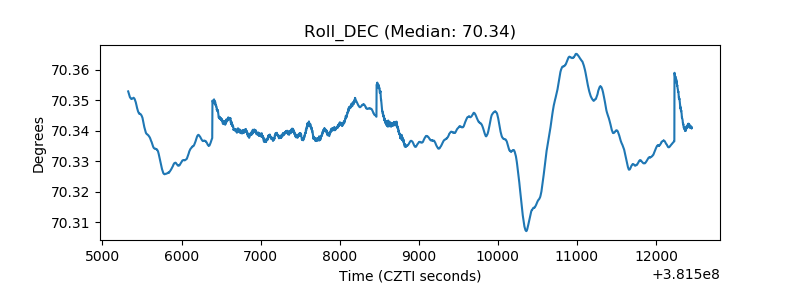 |
| _Roll_RA |  |
| Veto Counter | 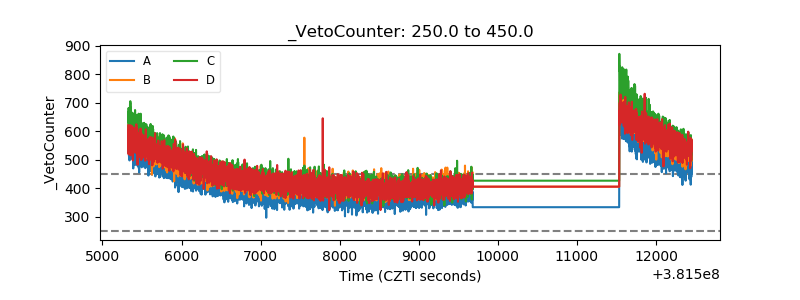 |