| Param | Original file | Final file |
|---|---|---|
| Filename | modeM0/AS1C07_001T05_9000004902_34326cztM0_level2.evt | modeM0/AS1C07_001T05_9000004902_34326cztM0_level2_quad_clean.evt |
| Size (bytes) | 75,553,920 | 17,712,000 |
| Size | 72.1 MB | 16.9 MB |
| Events in quadrant A | 410,743 | 116,061 |
| Events in quadrant B | 603,865 | 116,560 |
| Events in quadrant C | 539,893 | 116,957 |
| Events in quadrant D | 663,890 | 110,676 |
| Mode SS | |||
|---|---|---|---|
| Quadrant | BADHDUFLAG | Total packets | Discarded packets |
| A | 0 | 20 | 0 |
| B | 0 | 20 | 0 |
| C | 0 | 20 | 0 |
| D | 0 | 20 | 0 |
| Mode M9 | |||
|---|---|---|---|
| Quadrant | BADHDUFLAG | Total packets | Discarded packets |
| A | 0 | 6 | 0 |
| B | 0 | 6 | 0 |
| C | 0 | 6 | 0 |
| D | 0 | 6 | 0 |
| Mode M0 | |||
|---|---|---|---|
| Quadrant | BADHDUFLAG | Total packets | Discarded packets |
| A | 0 | 1968 | 2 |
| B | 0 | 2460 | 1 |
| C | 0 | 2246 | 1 |
| D | 0 | 2674 | 1 |
| Quadrant | Total seconds | Saturated seconds | Saturation percentage |
|---|---|---|---|
| A | 977 | 2 | 0.204708% |
| B | 977 | 22 | 2.251791% |
| C | 977 | 18 | 1.842375% |
| D | 977 | 20 | 2.047083% |
Noise dominated data is calculated using 1-second bins in cleaned event files. If a bin has >2000 counts, and if more than 50% of those come from <1% of pixels, then it is considered to be noise-dominated and hence unusable.
| Quadrant | # 1 sec bins | Bins with >0 counts | Bins with >2000 counts | High rate bins dominated by noise | Noise dominated (total time) | Noise dominated (detector-on time) | Marked lightcurve |
|---|---|---|---|---|---|---|---|
| A | 977 | 977 | 0 | 0 | 0.00% | 0.00% | 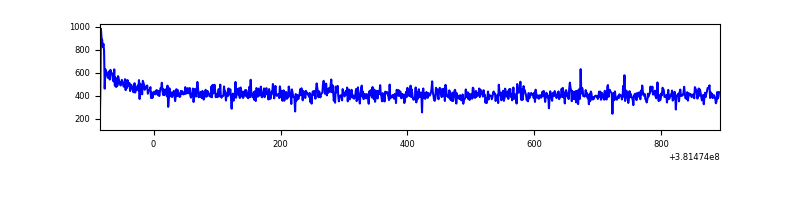 |
| B | 977 | 977 | 15 | 15 | 1.54% | 1.54% | 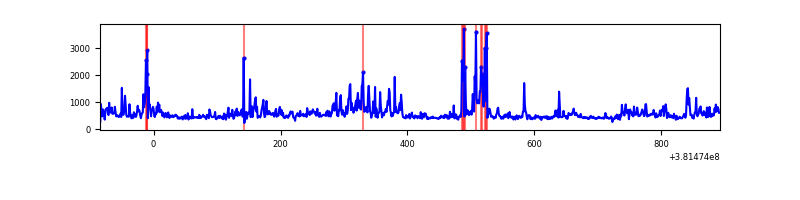 |
| C | 977 | 977 | 17 | 17 | 1.74% | 1.74% | 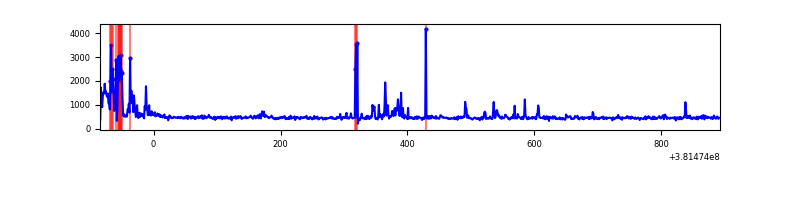 |
| D | 977 | 977 | 18 | 18 | 1.84% | 1.84% | 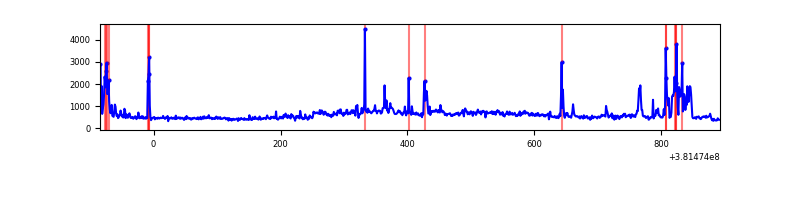 |
Top three noisy pixels from each quadrant. If the there are fewer than three noisy pixels in the level2.evt file, extra rows are filled as -1
| Pixel properties | Quadrant properties | ||||||
|---|---|---|---|---|---|---|---|
| Quadrant | DetID | PixID | Counts | Sigma | Mean | Median | Sigma |
| A | 10 | 83 | 12873 | 562.25 | 102 | 100 | 22.7 |
| A | 13 | 6 | 1719 | 71.27 | 102 | 100 | 22.7 |
| A | 13 | 254 | 1543 | 63.52 | 102 | 100 | 22.7 |
| B | 5 | 172 | 90917 | 4152.38 | 102 | 99 | 21.9 |
| B | 3 | 32 | 49205 | 2245.23 | 102 | 99 | 21.9 |
| B | 4 | 171 | 37180 | 1695.42 | 102 | 99 | 21.9 |
| C | 14 | 254 | 57503 | 2367.01 | 98 | 99 | 24.3 |
| C | 15 | 214 | 44775 | 1842.18 | 98 | 99 | 24.3 |
| C | 0 | 10 | 41071 | 1689.45 | 98 | 99 | 24.3 |
| D | 8 | 195 | 135693 | 5396.96 | 96 | 93 | 25.1 |
| D | 12 | 218 | 71282 | 2833.36 | 96 | 93 | 25.1 |
| D | 12 | 235 | 25472 | 1010.1 | 96 | 93 | 25.1 |
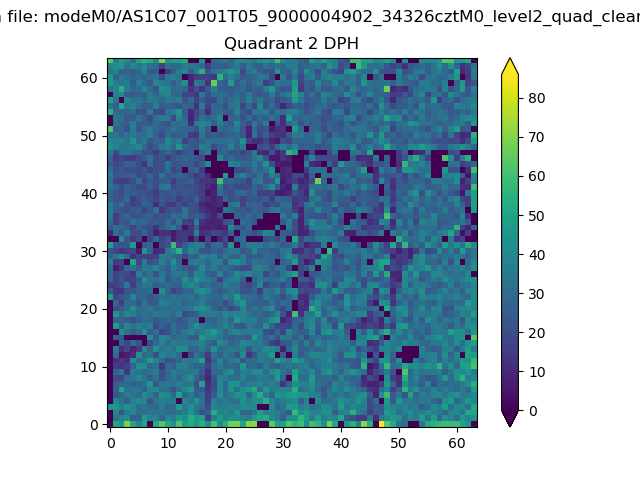
Histogram calculated using DETX and DETY for each event in the final _common_clean file
| Quadrant A | 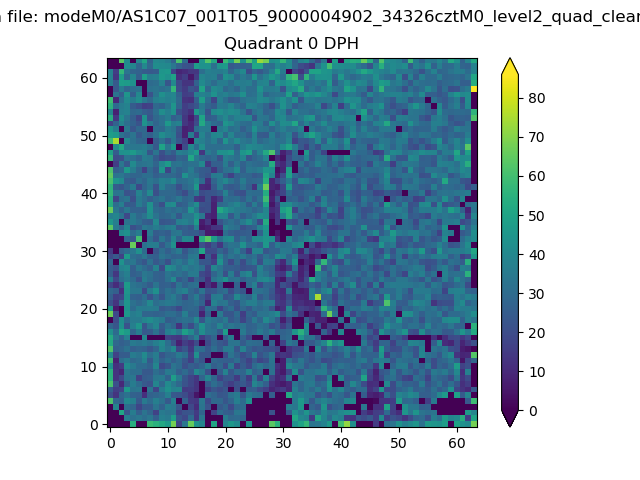 |
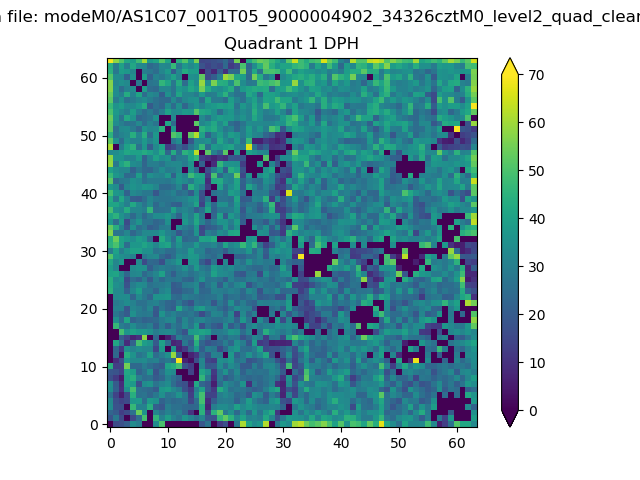 |
Quadrant B |
|---|---|---|---|
| Quadrant D | 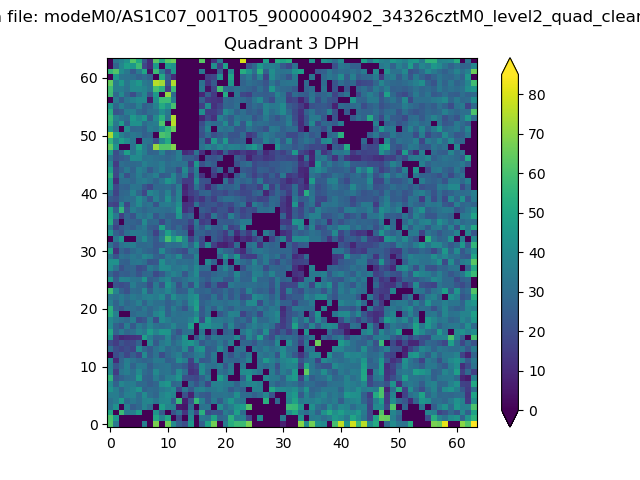 |
 |
Quadrant C |
| Plot type | Count rate plots | Images |
|---|---|---|
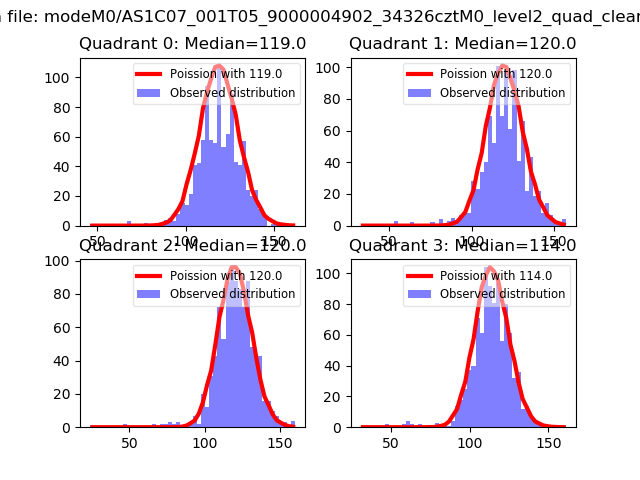
| Comparison with Poisson distribution Blue bars denote a histogram of data divided into 1 sec bins. Red curve is a Poisson curve with rate = median count rate of data. |
 |
 |
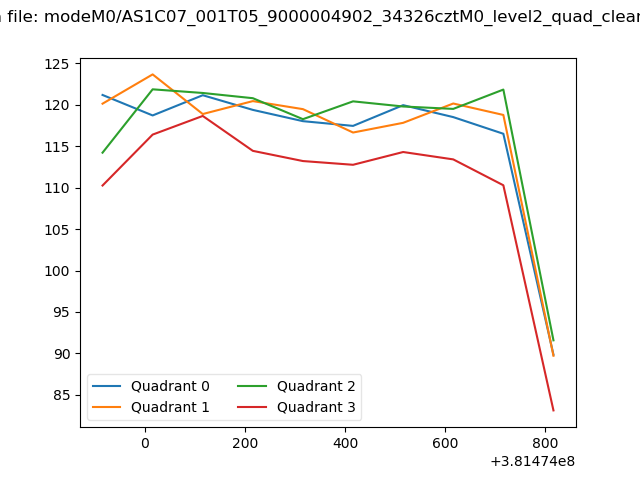
| Quadrant-wise count rates Data is divided into 100 sec bins |
 |
|
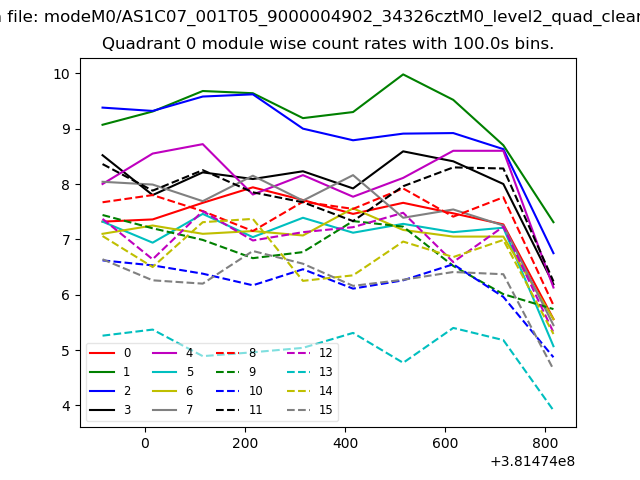
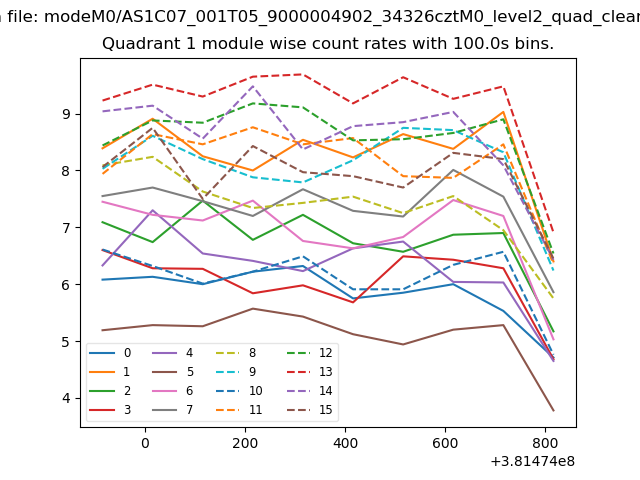
| Module-wise count rates for Quadrant A Data is divided into 100 sec bins |
 |
 |
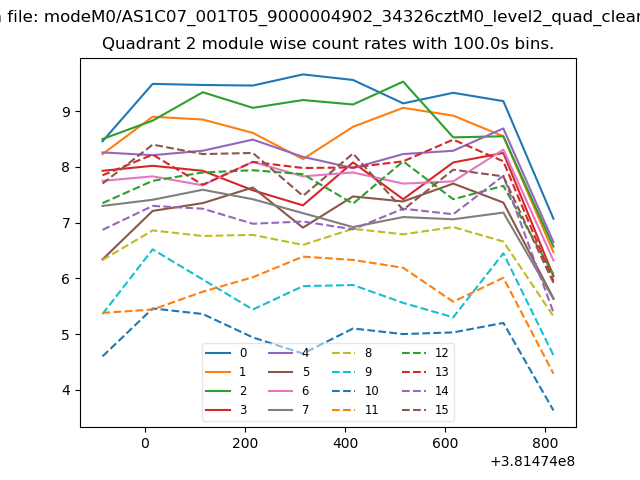
| Module-wise count rates for Quadrant B Data is divided into 100 sec bins |
 |
 |
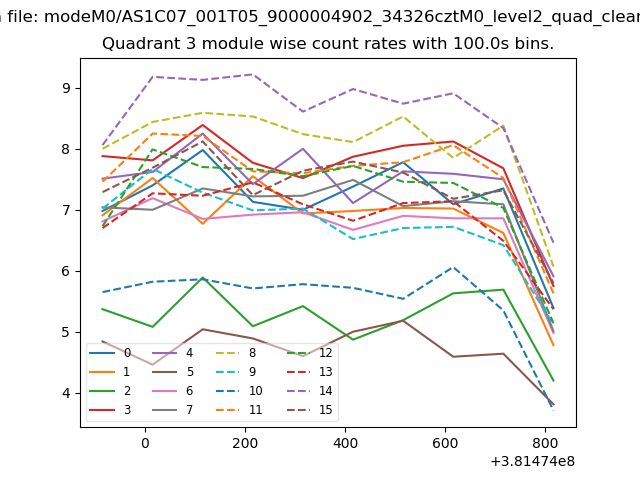
| Module-wise count rates for Quadrant C Data is divided into 100 sec bins |
 |
 |
| Module-wise count rates for Quadrant D Data is divided into 100 sec bins |
 |
 |
| Parameter | Plot |
|---|---|
| CZT HV Monitor |  |
| D_VDD | 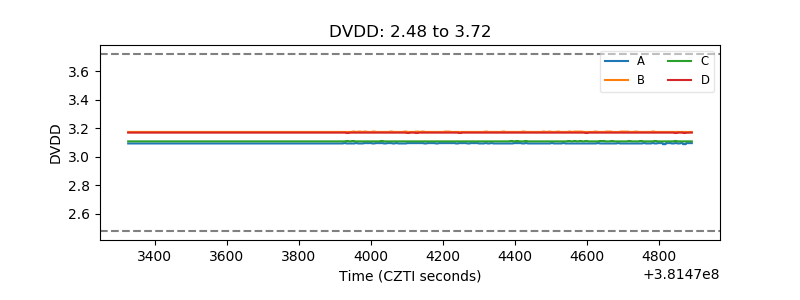 |
| Temperature 1 | 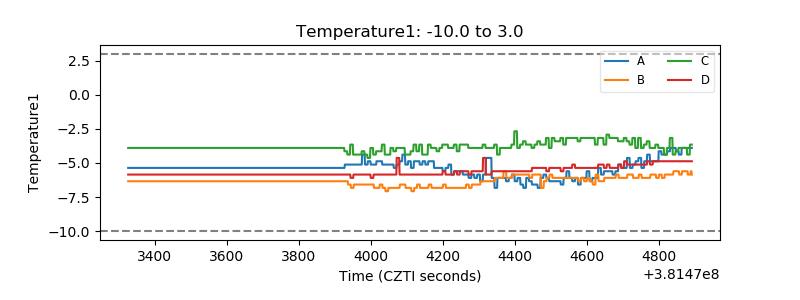 |
| Veto HV Monitor | 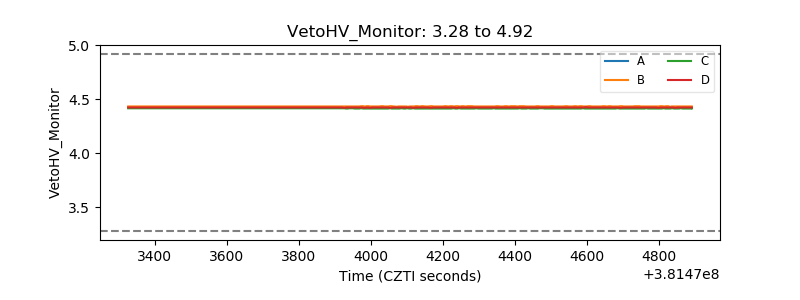 |
| Veto LLD | 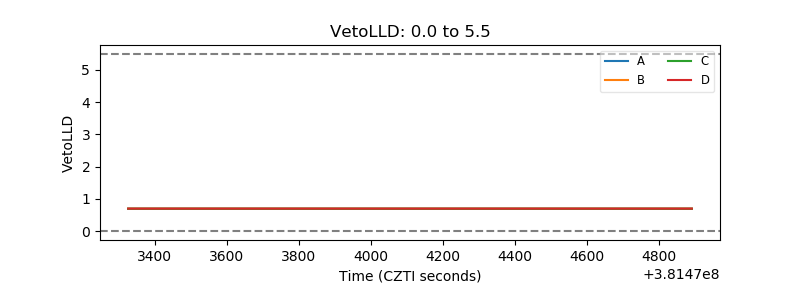 |
| Alpha Counter | 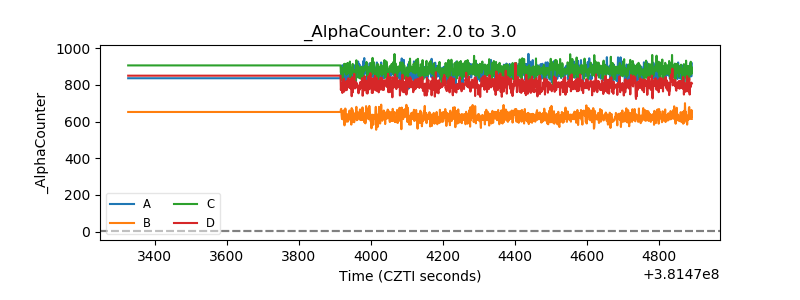 |
| _CPM_Rate | 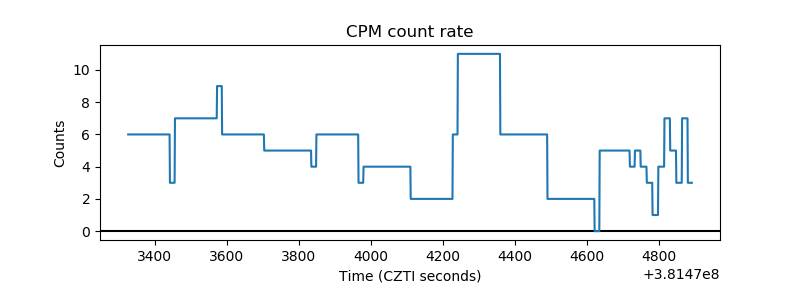 |
| CZT Counter | 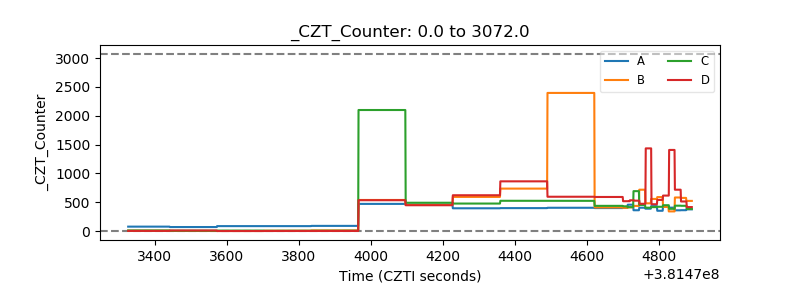 |
| +2.5 Volts monitor | 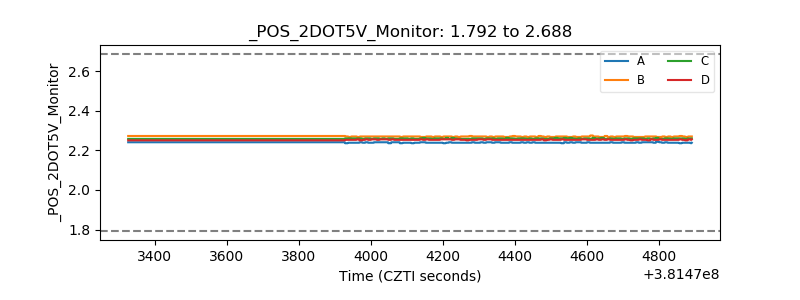 |
| +5 Volts monitor | 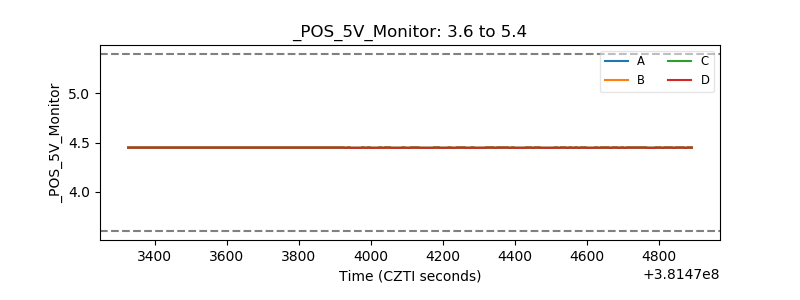 |
| _ROLL_ROT | 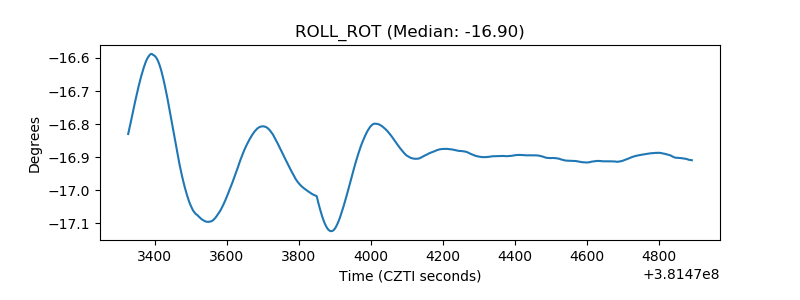 |
| _Roll_DEC | 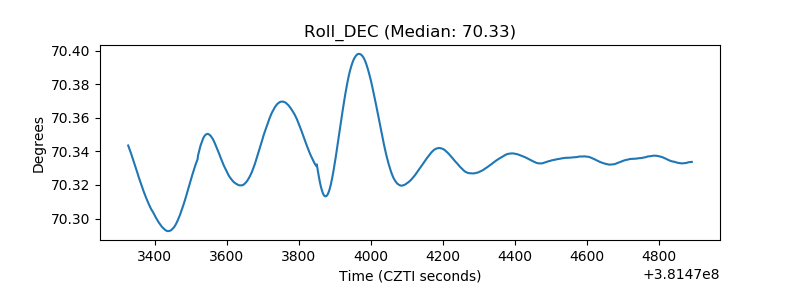 |
| _Roll_RA | 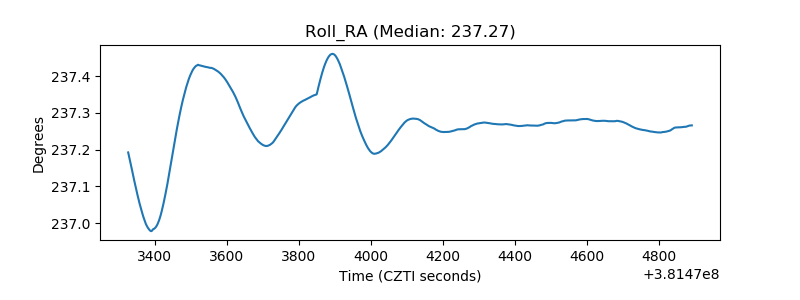 |
| Veto Counter | 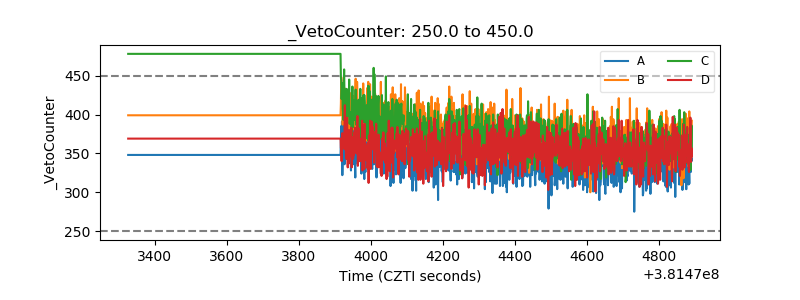 |