| Param | Original file | Final file |
|---|---|---|
| Filename | modeM0/AS1A05_084T04_9000004896_34315cztM0_level2.evt | modeM0/AS1A05_084T04_9000004896_34315cztM0_level2_quad_clean.evt |
| Size (bytes) | 99,691,200 | 19,293,120 |
| Size | 95.1 MB | 18.4 MB |
| Events in quadrant A | 523,536 | 130,842 |
| Events in quadrant B | 576,712 | 132,361 |
| Events in quadrant C | 535,333 | 131,543 |
| Events in quadrant D | 1,315,186 | 114,378 |
| Mode M9 | |||
|---|---|---|---|
| Quadrant | BADHDUFLAG | Total packets | Discarded packets |
| A | 0 | 16 | 0 |
| B | 0 | 16 | 0 |
| C | 0 | 16 | 0 |
| D | 0 | 16 | 0 |
| Mode SS | |||
|---|---|---|---|
| Quadrant | BADHDUFLAG | Total packets | Discarded packets |
| A | 0 | 20 | 0 |
| B | 0 | 20 | 0 |
| C | 0 | 20 | 0 |
| D | 0 | 20 | 0 |
| Mode M0 | |||
|---|---|---|---|
| Quadrant | BADHDUFLAG | Total packets | Discarded packets |
| A | 0 | 2113 | 2 |
| B | 0 | 2303 | 1 |
| C | 0 | 2131 | 1 |
| D | 0 | 4588 | 1 |
| Quadrant | Total seconds | Saturated seconds | Saturation percentage |
|---|---|---|---|
| A | 967 | 5 | 0.517063% |
| B | 967 | 10 | 1.034126% |
| C | 967 | 2 | 0.206825% |
| D | 967 | 199 | 20.579111% |
Noise dominated data is calculated using 1-second bins in cleaned event files. If a bin has >2000 counts, and if more than 50% of those come from <1% of pixels, then it is considered to be noise-dominated and hence unusable.
| Quadrant | # 1 sec bins | Bins with >0 counts | Bins with >2000 counts | High rate bins dominated by noise | Noise dominated (total time) | Noise dominated (detector-on time) | Marked lightcurve |
|---|---|---|---|---|---|---|---|
| A | 967 | 967 | 2 | 2 | 0.21% | 0.21% | 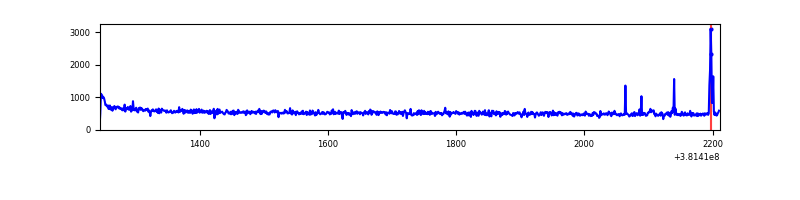 |
| B | 967 | 967 | 3 | 3 | 0.31% | 0.31% | 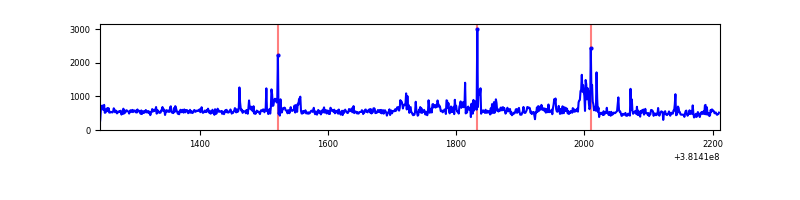 |
| C | 967 | 967 | 1 | 1 | 0.10% | 0.10% | 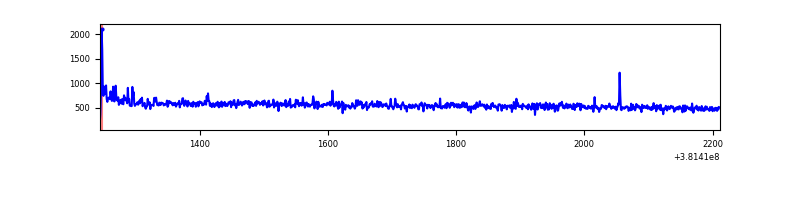 |
| D | 967 | 967 | 137 | 137 | 14.17% | 14.17% | 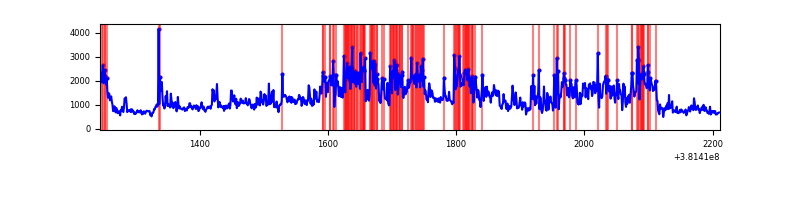 |
Top three noisy pixels from each quadrant. If the there are fewer than three noisy pixels in the level2.evt file, extra rows are filled as -1
| Pixel properties | Quadrant properties | ||||||
|---|---|---|---|---|---|---|---|
| Quadrant | DetID | PixID | Counts | Sigma | Mean | Median | Sigma |
| A | 9 | 143 | 14538 | 514.52 | 127 | 123 | 28.0 |
| A | 10 | 83 | 13156 | 465.19 | 127 | 123 | 28.0 |
| A | 13 | 6 | 3710 | 128.03 | 127 | 123 | 28.0 |
| B | 4 | 171 | 23547 | 903.98 | 124 | 121 | 25.9 |
| B | 5 | 255 | 22295 | 855.66 | 124 | 121 | 25.9 |
| B | 4 | 251 | 17729 | 679.47 | 124 | 121 | 25.9 |
| C | 15 | 214 | 44672 | 1489.03 | 121 | 121 | 29.9 |
| C | 0 | 10 | 9293 | 306.56 | 121 | 121 | 29.9 |
| C | 1 | 128 | 3105 | 99.73 | 121 | 121 | 29.9 |
| D | 12 | 227 | 322055 | 10568.61 | 117 | 113 | 30.5 |
| D | 8 | 195 | 124794 | 4092.99 | 117 | 113 | 30.5 |
| D | 10 | 118 | 87805 | 2878.72 | 117 | 113 | 30.5 |
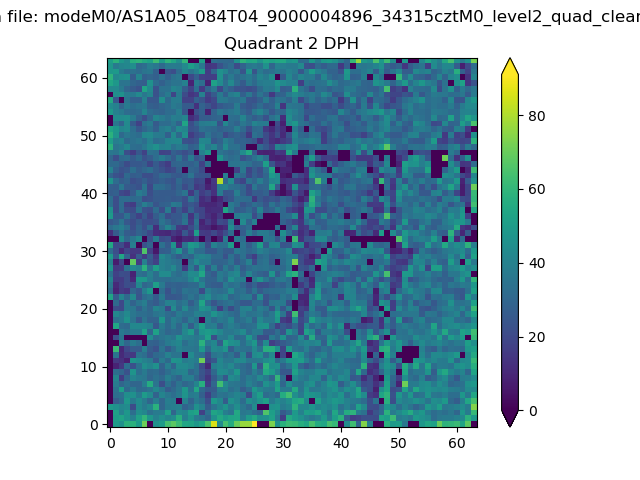
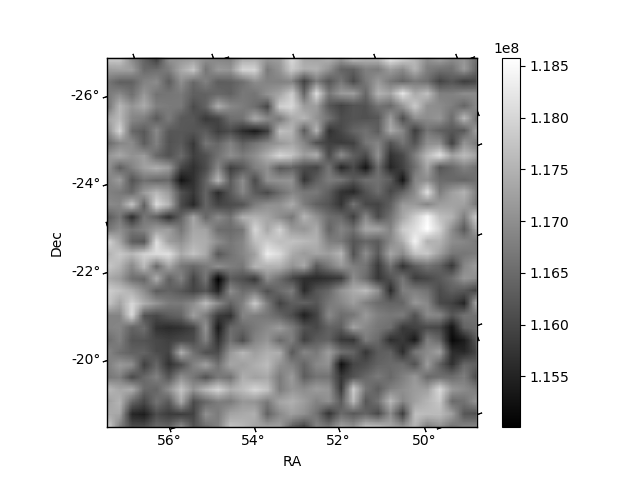
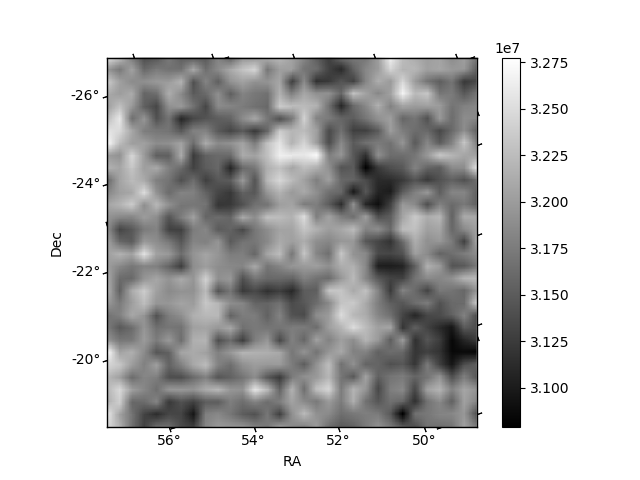
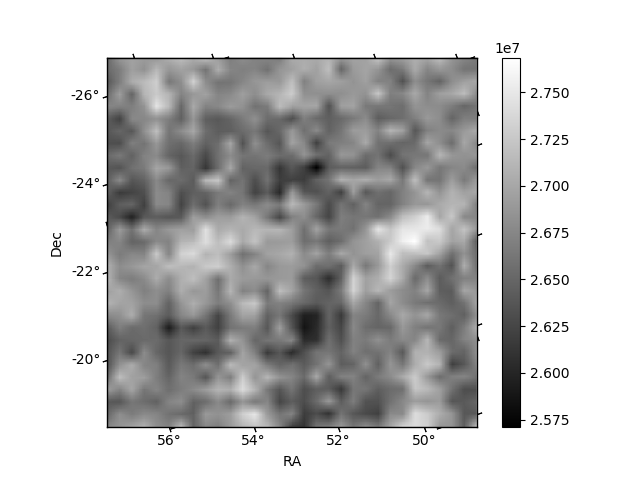
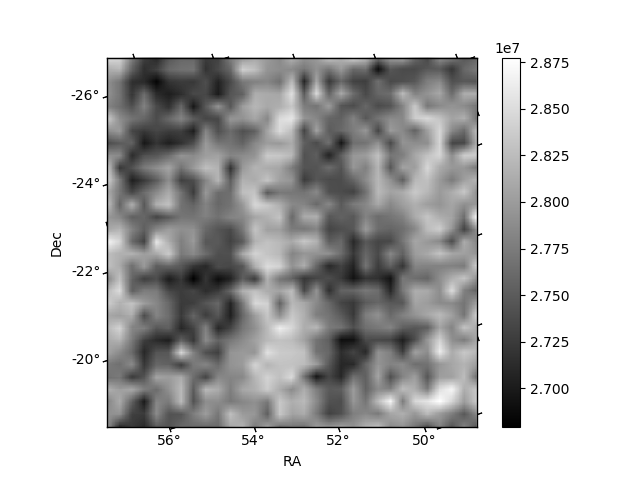
Histogram calculated using DETX and DETY for each event in the final _common_clean file
| Quadrant A | 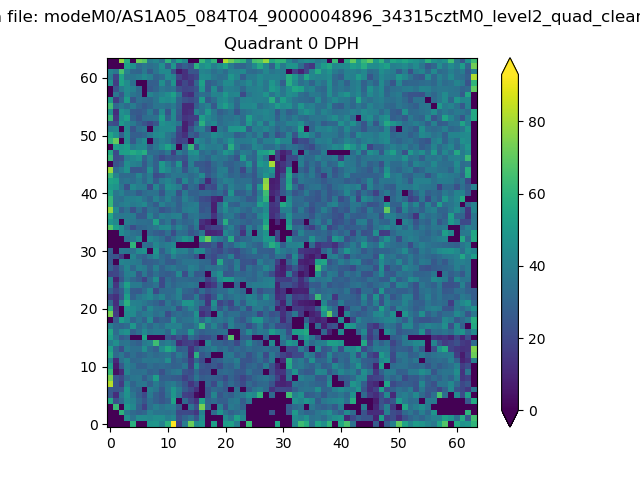 |
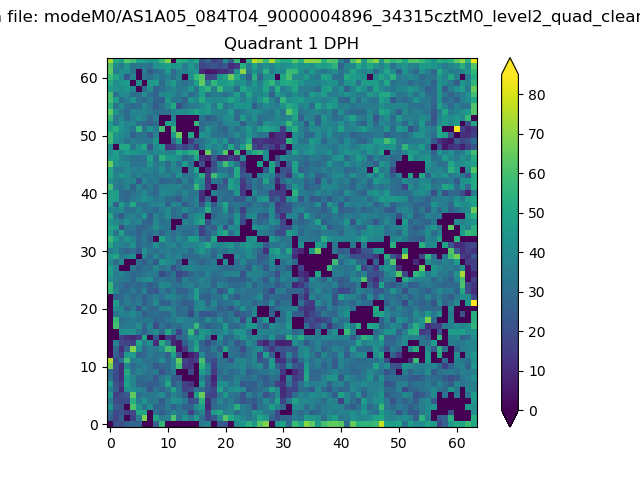 |
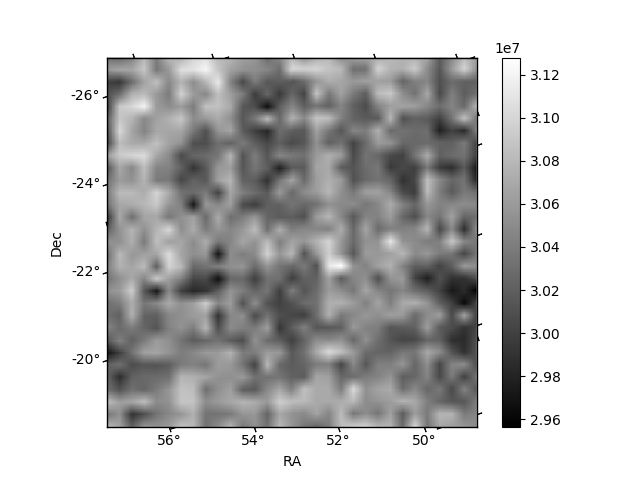
Quadrant B |
|---|---|---|---|
| Quadrant D | 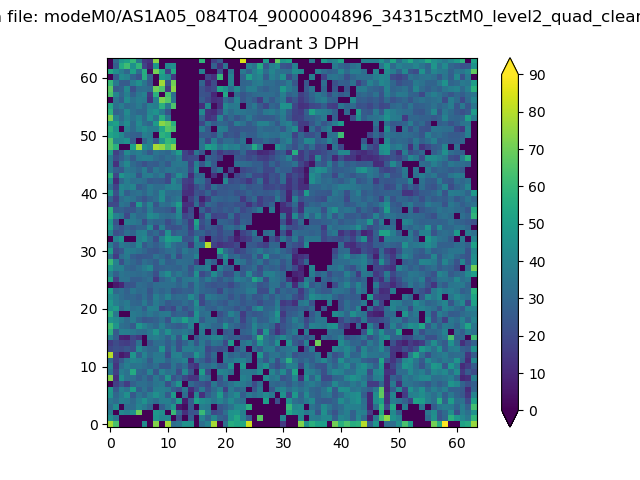 |
 |
Quadrant C |
| Plot type | Count rate plots | Images |
|---|---|---|
| Comparison with Poisson distribution Blue bars denote a histogram of data divided into 1 sec bins. Red curve is a Poisson curve with rate = median count rate of data. |
 |
 |
| Quadrant-wise count rates Data is divided into 100 sec bins |
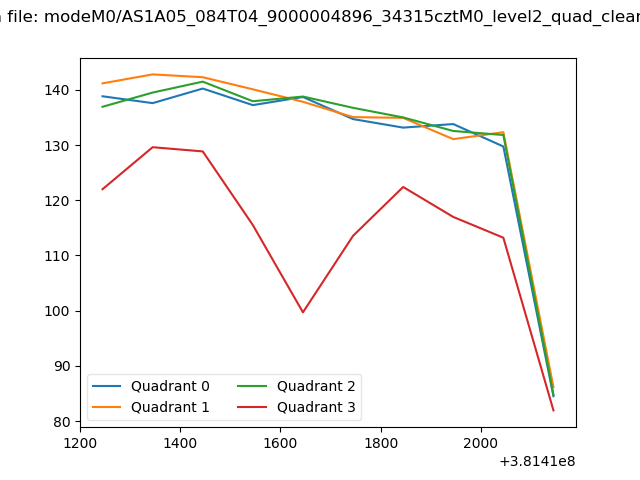 |
|
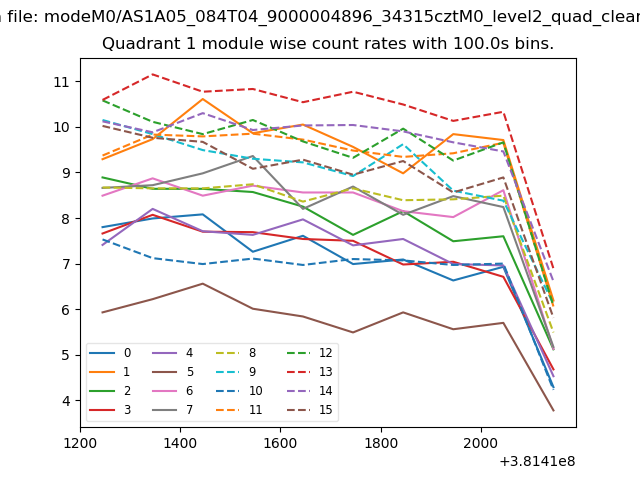
| Module-wise count rates for Quadrant A Data is divided into 100 sec bins |
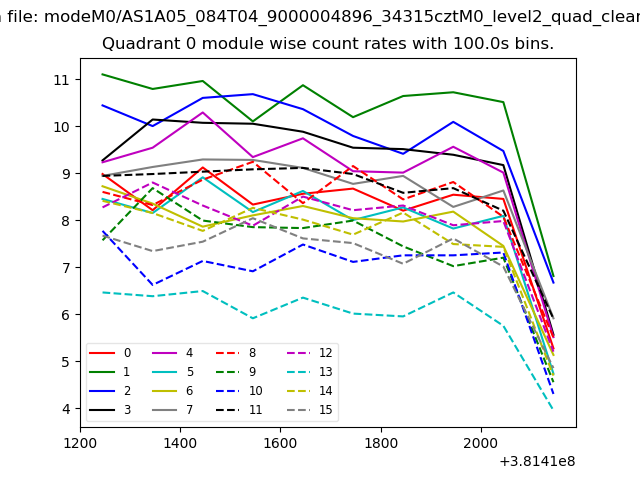 |
 |
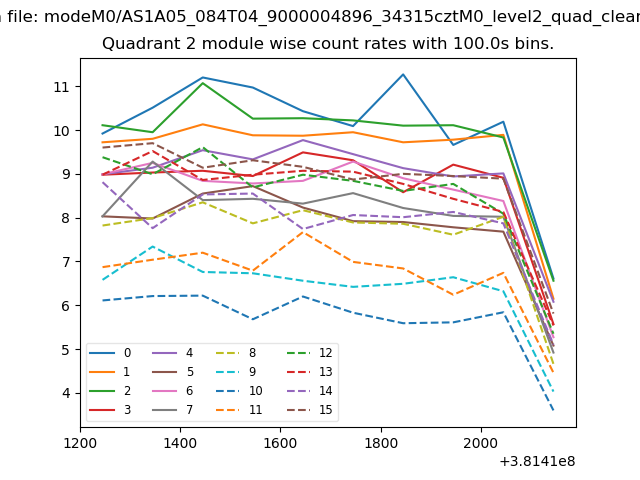
| Module-wise count rates for Quadrant B Data is divided into 100 sec bins |
 |
 |
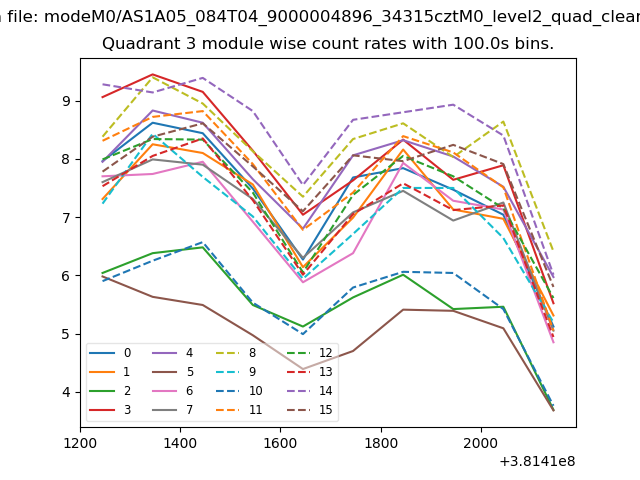
| Module-wise count rates for Quadrant C Data is divided into 100 sec bins |
 |
 |
| Module-wise count rates for Quadrant D Data is divided into 100 sec bins |
 |
 |
| Parameter | Plot |
|---|---|
| CZT HV Monitor | 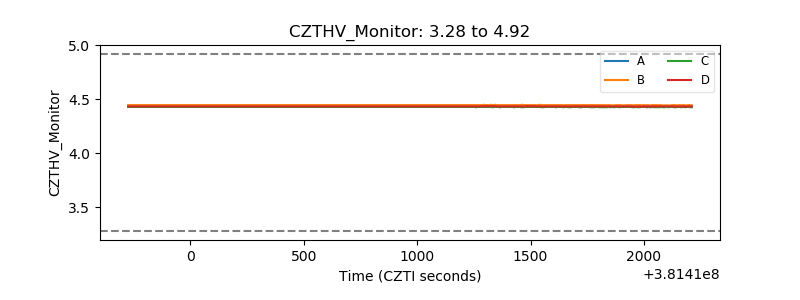 |
| D_VDD | 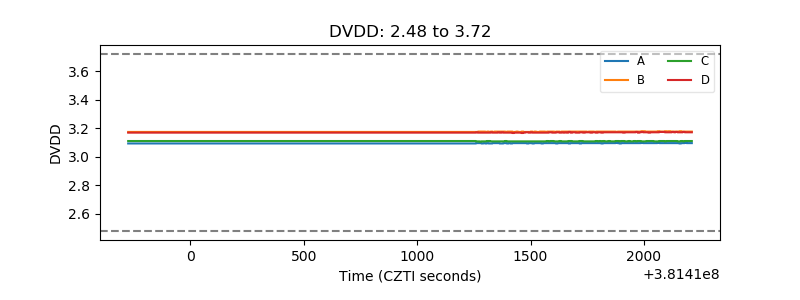 |
| Temperature 1 | 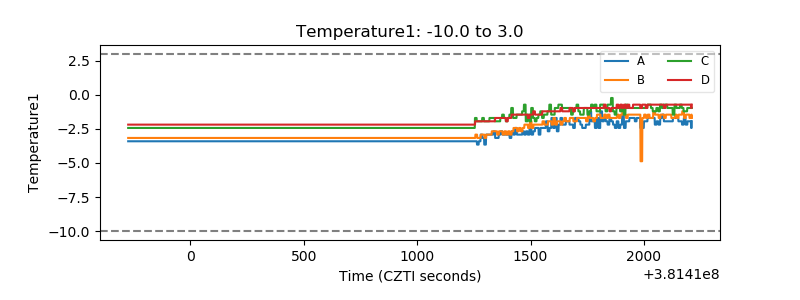 |
| Veto HV Monitor | 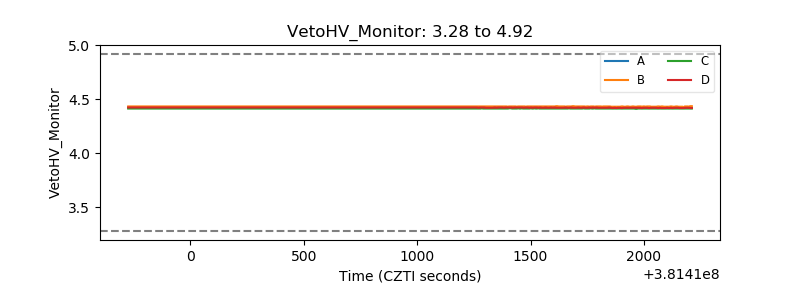 |
| Veto LLD | 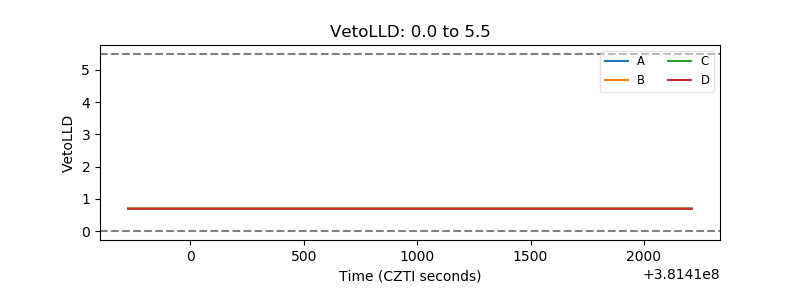 |
| Alpha Counter | 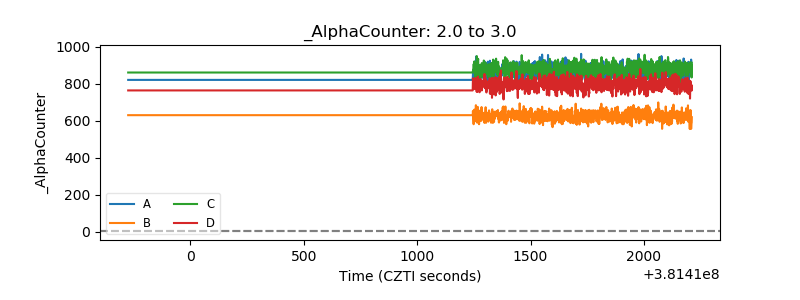 |
| _CPM_Rate | 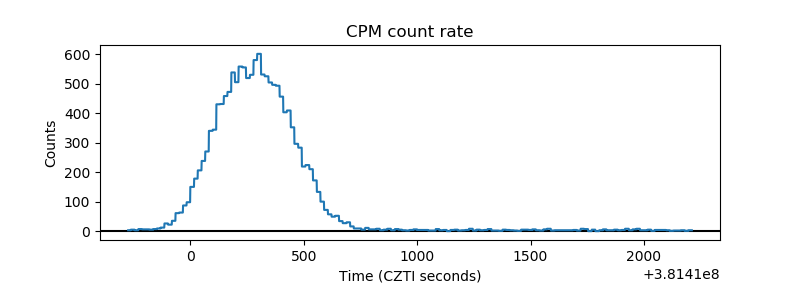 |
| CZT Counter | 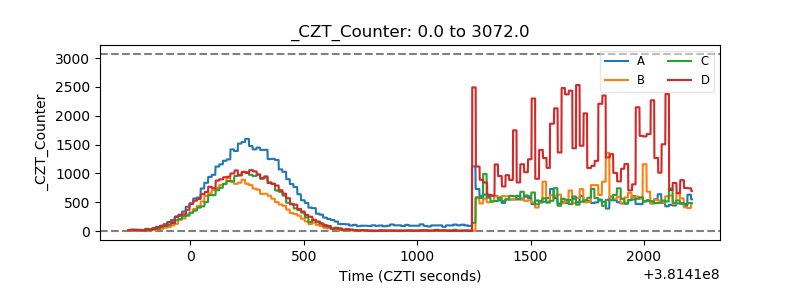 |
| +2.5 Volts monitor | 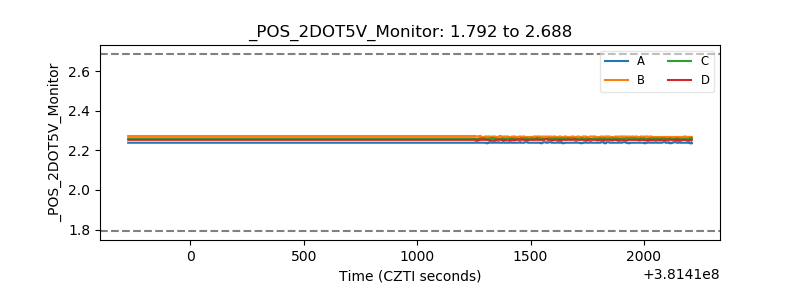 |
| +5 Volts monitor | 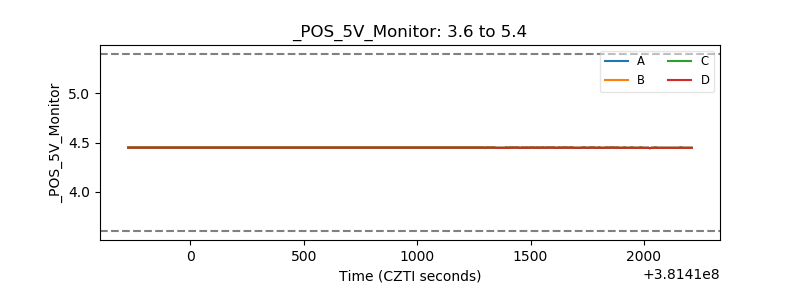 |
| _ROLL_ROT | 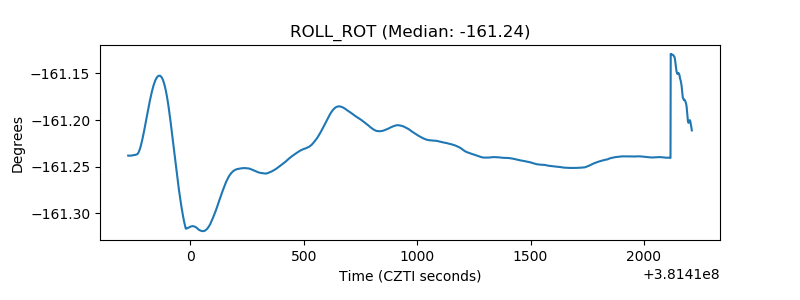 |
| _Roll_DEC | 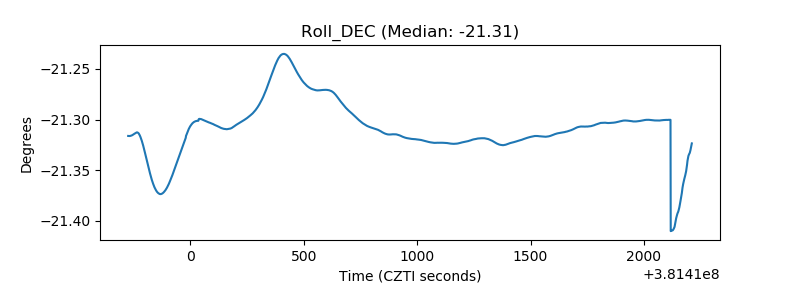 |
| _Roll_RA | 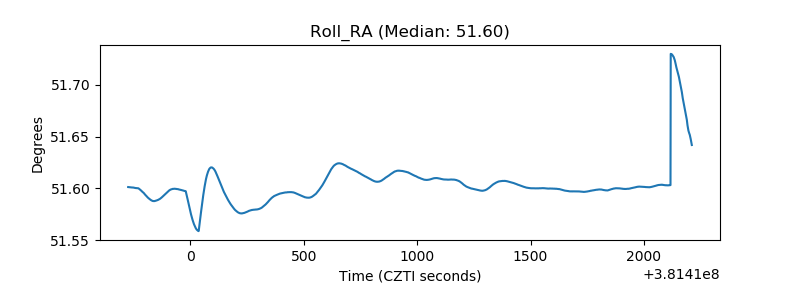 |
| Veto Counter | 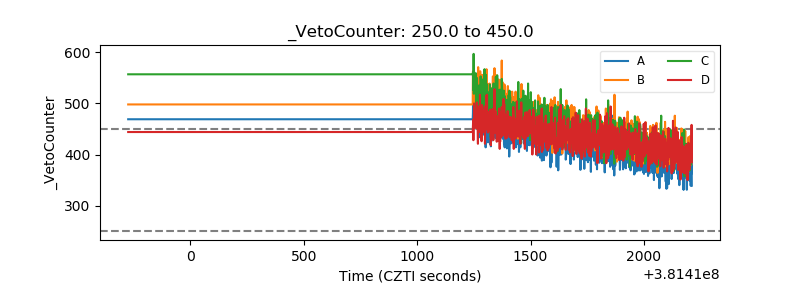 |