| Param | Original file | Final file |
|---|---|---|
| Filename | modeM0/AS1A05_082T08_9000004900cztM0_level2_bc.evt | modeM0/AS1A05_082T08_9000004900cztM0_level2_quad_clean.evt |
| Size (bytes) | 1,210,976,640 | 313,220,160 |
| Size | 1.1 GB | 298.7 MB |
| Events in quadrant A | 5,012,670 | 1,979,725 |
| Events in quadrant B | 6,958,453 | 2,002,472 |
| Events in quadrant C | 7,715,006 | 1,993,069 |
| Events in quadrant D | 15,354,172 | 1,862,008 |
| Mode M9 | |||
|---|---|---|---|
| Quadrant | BADHDUFLAG | Total packets | Discarded packets |
| A | 0 | 96 | 0 |
| B | 0 | 96 | 0 |
| C | 0 | 96 | 0 |
| D | 0 | 96 | 0 |
| Mode SS | |||
|---|---|---|---|
| Quadrant | BADHDUFLAG | Total packets | Discarded packets |
| A | 0 | 486 | 0 |
| B | 0 | 486 | 0 |
| C | 0 | 486 | 0 |
| D | 0 | 486 | 0 |
| Mode M0 | |||
|---|---|---|---|
| Quadrant | BADHDUFLAG | Total packets | Discarded packets |
| A | 0 | 48762 | 0 |
| B | 0 | 56412 | 0 |
| C | 0 | 56538 | 0 |
| D | 0 | 84499 | 0 |
| Quadrant | Total seconds | Saturated seconds | Saturation percentage |
|---|---|---|---|
| A | 23988 | 35 | 0.145906% |
| B | 23988 | 583 | 2.430382% |
| C | 23988 | 372 | 1.550775% |
| D | 23988 | 1720 | 7.170252% |
Noise dominated data is calculated using 1-second bins in cleaned event files. If a bin has >2000 counts, and if more than 50% of those come from <1% of pixels, then it is considered to be noise-dominated and hence unusable.
| Quadrant | # 1 sec bins | Bins with >0 counts | Bins with >2000 counts | High rate bins dominated by noise | Noise dominated (total time) | Noise dominated (detector-on time) | Marked lightcurve |
|---|---|---|---|---|---|---|---|
| A | 33429 | 23991 | 0 | 0 | 0.00% | 0.00% | 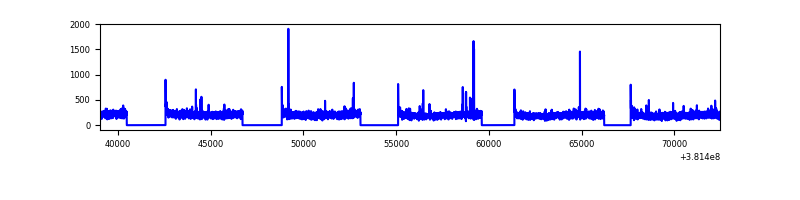 |
| B | 33429 | 23988 | 54 | 54 | 0.16% | 0.23% | 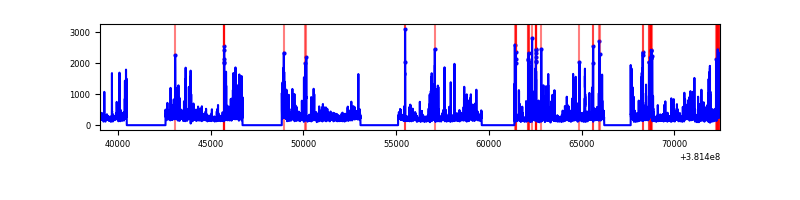 |
| C | 33429 | 23988 | 73 | 73 | 0.22% | 0.30% | 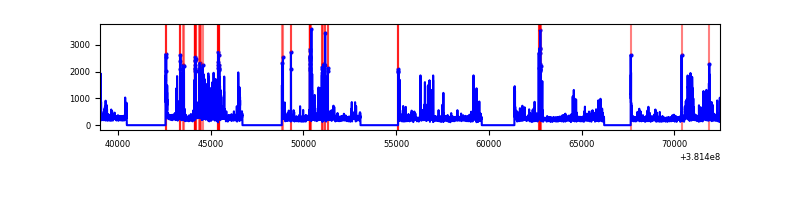 |
| D | 33429 | 23989 | 194 | 194 | 0.58% | 0.81% | 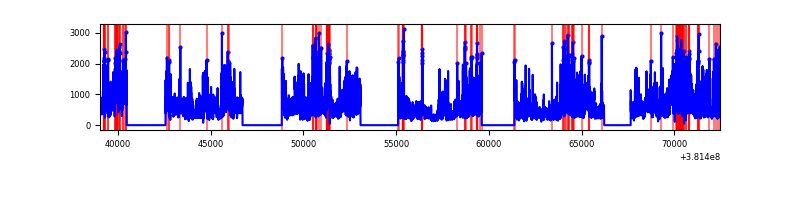 |
Top three noisy pixels from each quadrant. If the there are fewer than three noisy pixels in the level2.evt file, extra rows are filled as -1
| Pixel properties | Quadrant properties | ||||||
|---|---|---|---|---|---|---|---|
| Quadrant | DetID | PixID | Counts | Sigma | Mean | Median | Sigma |
| A | 10 | 83 | 78805 | 279.48 | 1260 | 1237 | 277.5 |
| A | 13 | 6 | 37893 | 132.07 | 1260 | 1237 | 277.5 |
| A | 13 | 254 | 36307 | 126.36 | 1260 | 1237 | 277.5 |
| B | 5 | 172 | 1051477 | 4227.95 | 1273 | 1248 | 248.4 |
| B | 3 | 32 | 190874 | 763.39 | 1273 | 1248 | 248.4 |
| B | 4 | 251 | 181162 | 724.29 | 1273 | 1248 | 248.4 |
| C | 14 | 254 | 1303290 | 4599.92 | 1250 | 1241 | 283.1 |
| C | 15 | 214 | 941145 | 3320.52 | 1250 | 1241 | 283.1 |
| C | 0 | 10 | 228696 | 803.56 | 1250 | 1241 | 283.1 |
| D | 8 | 195 | 3900294 | 13285.48 | 1220 | 1184 | 293.5 |
| D | 12 | 235 | 3031960 | 10326.8 | 1220 | 1184 | 293.5 |
| D | 10 | 118 | 1365857 | 4649.87 | 1220 | 1184 | 293.5 |
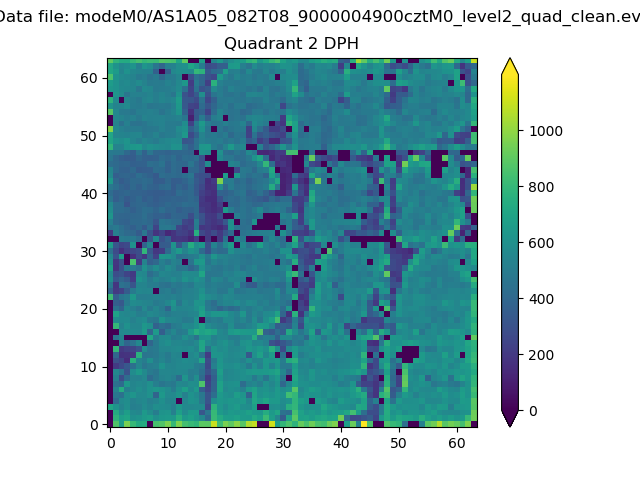
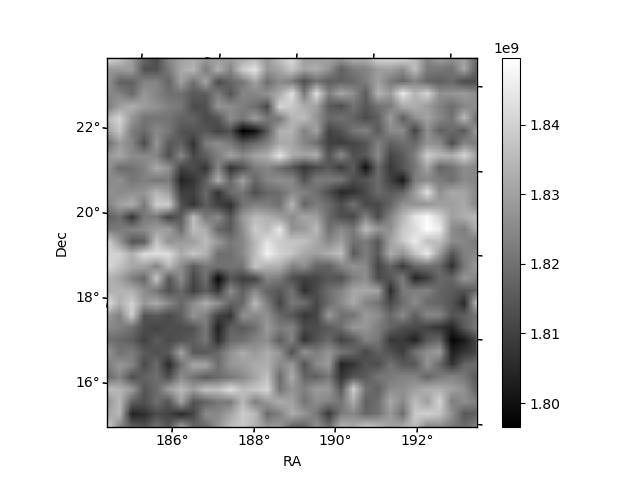
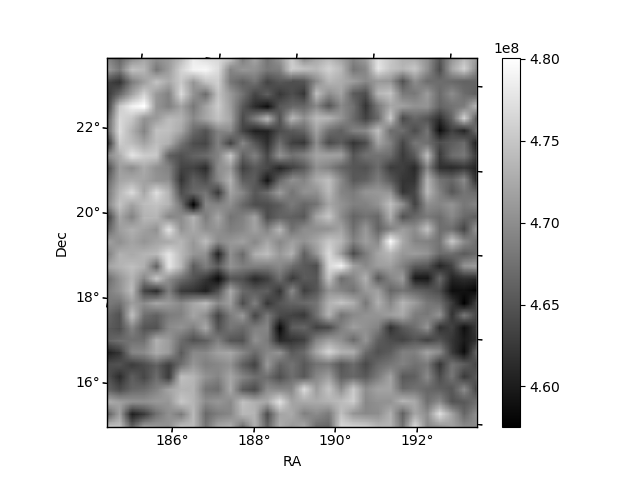
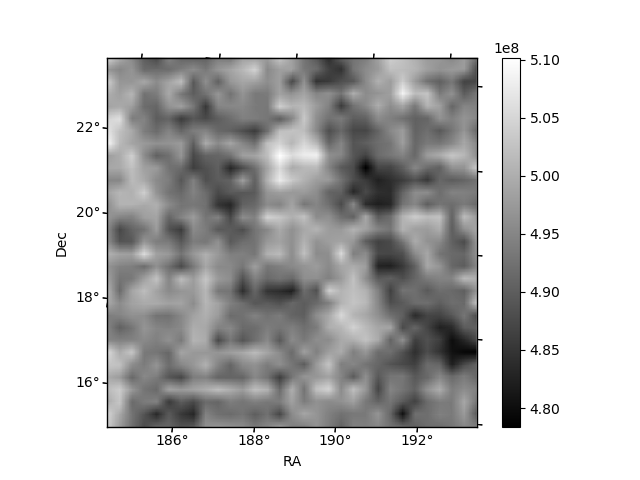
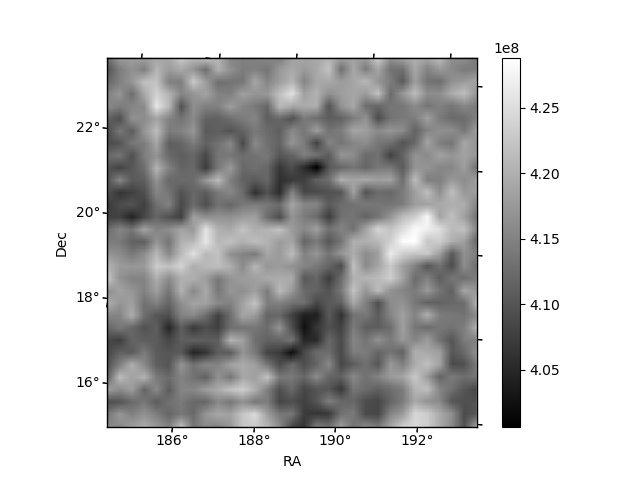
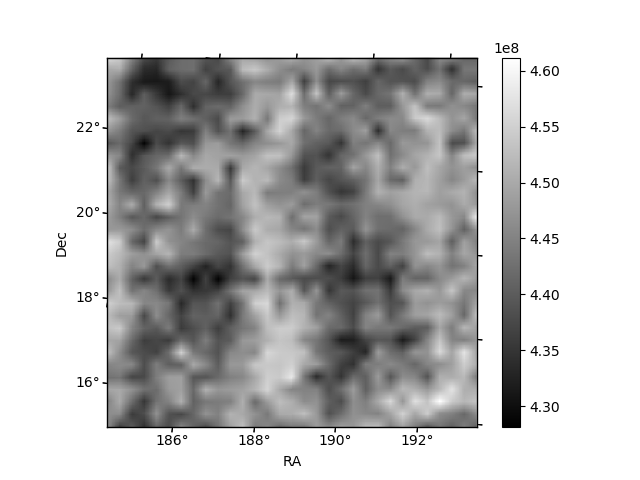
Histogram calculated using DETX and DETY for each event in the final _common_clean file
| Quadrant A | 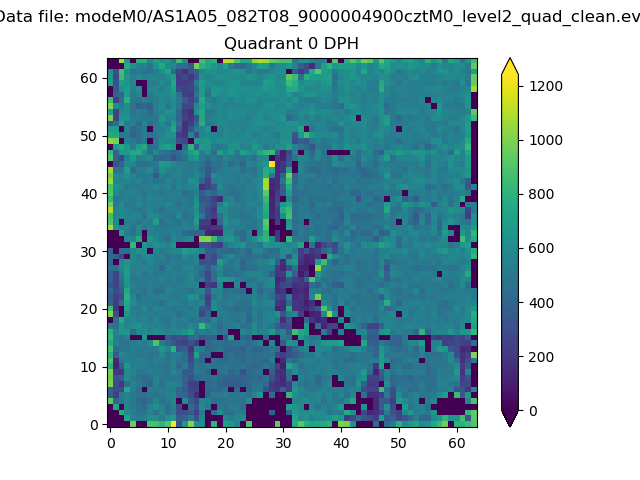 |
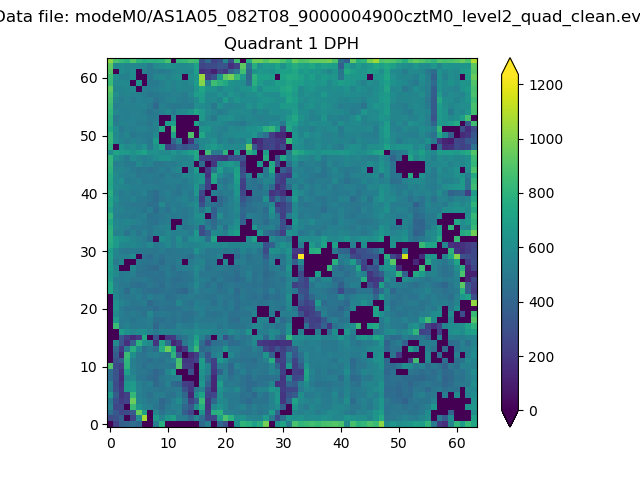 |
Quadrant B |
|---|---|---|---|
| Quadrant D | 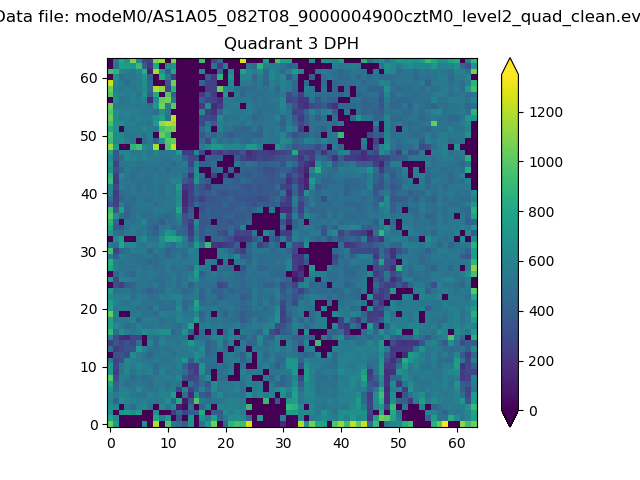 |
 |
Quadrant C |
| Plot type | Count rate plots | Images |
|---|---|---|
| Comparison with Poisson distribution Blue bars denote a histogram of data divided into 1 sec bins. Red curve is a Poisson curve with rate = median count rate of data. |
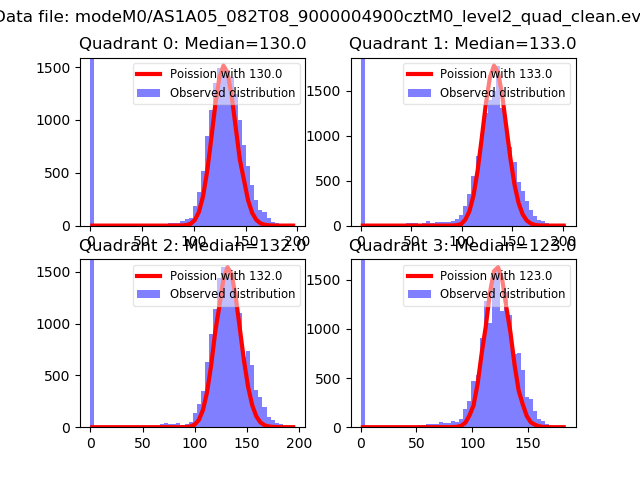 |
 |
| Quadrant-wise count rates Data is divided into 100 sec bins |
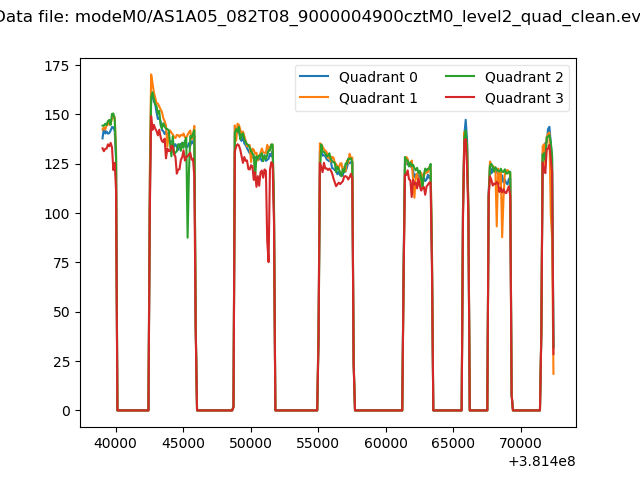 |
|
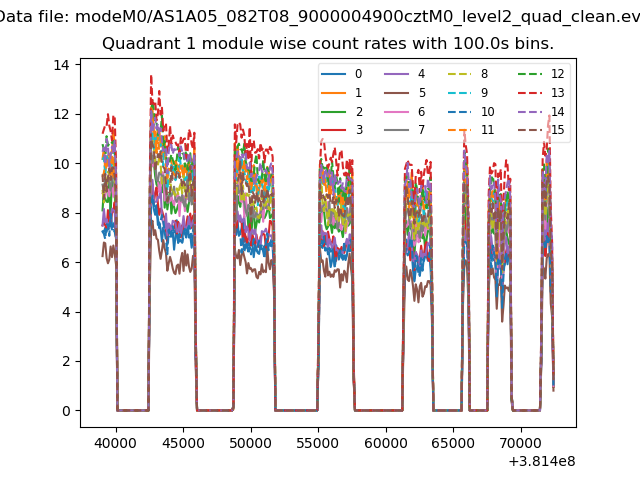
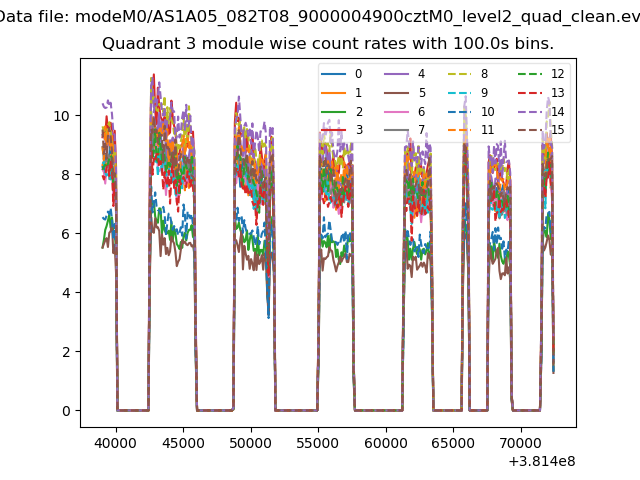
| Module-wise count rates for Quadrant A Data is divided into 100 sec bins |
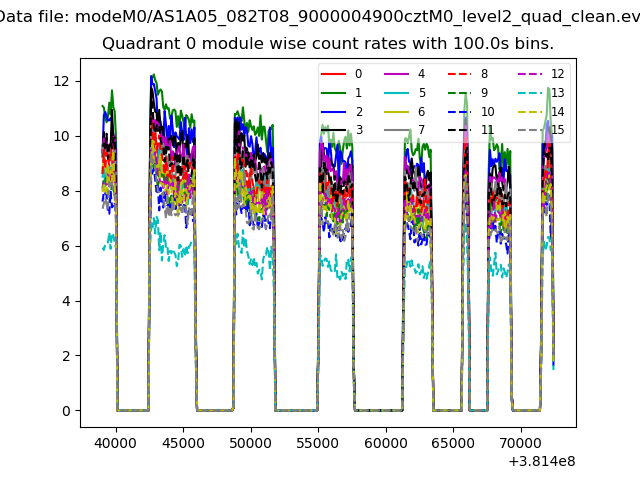 |
 |
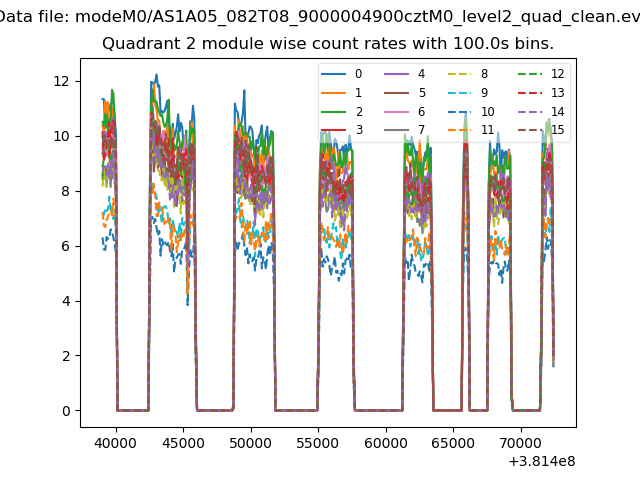
| Module-wise count rates for Quadrant B Data is divided into 100 sec bins |
 |
 |
| Module-wise count rates for Quadrant C Data is divided into 100 sec bins |
 |
 |
| Module-wise count rates for Quadrant D Data is divided into 100 sec bins |
 |
 |
| Parameter | Plot |
|---|---|
| CZT HV Monitor | 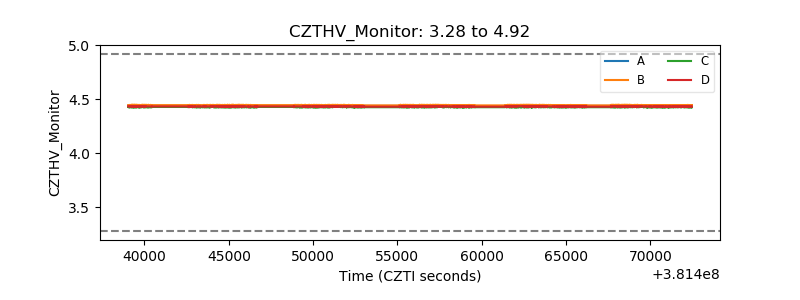 |
| D_VDD | 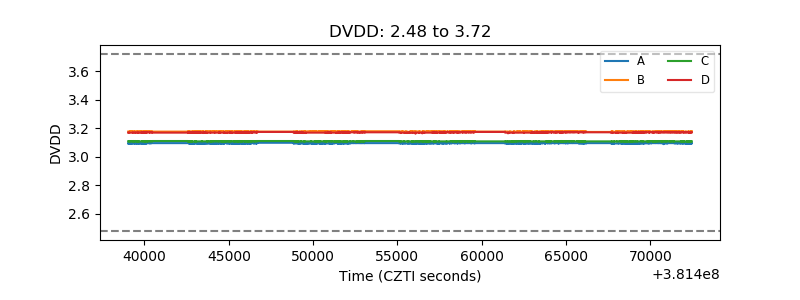 |
| Temperature 1 | 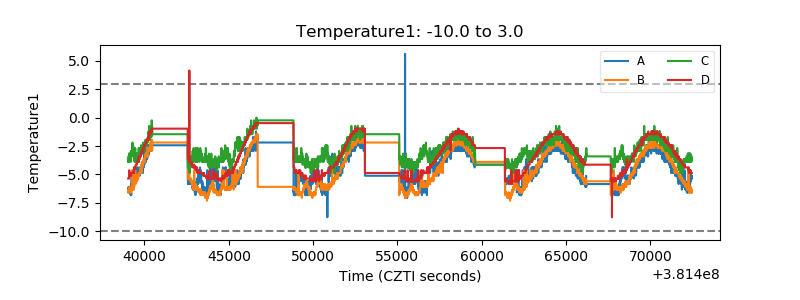 |
| Veto HV Monitor |  |
| Veto LLD | 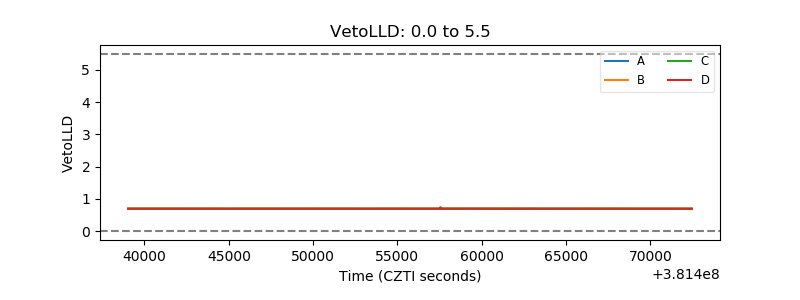 |
| Alpha Counter | 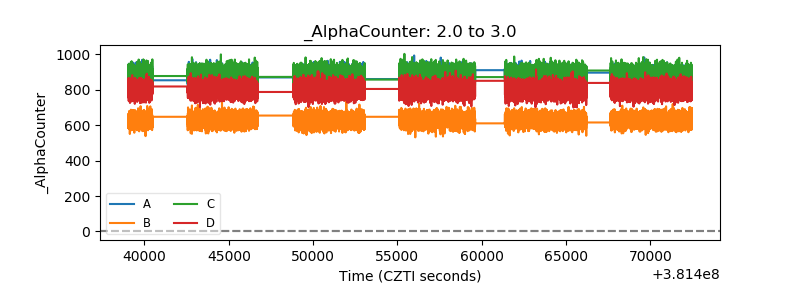 |
| _CPM_Rate | 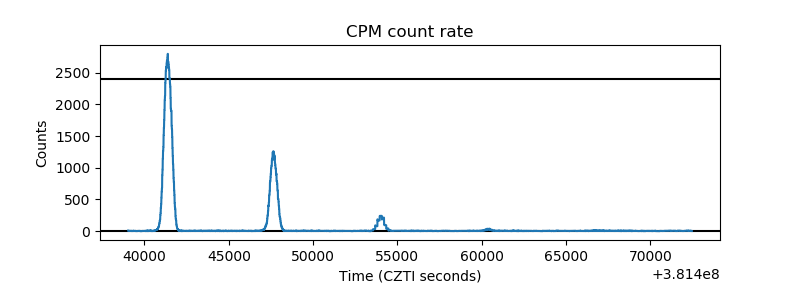 |
| CZT Counter | 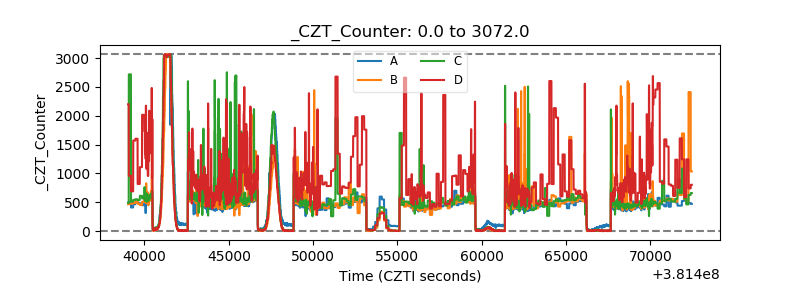 |
| +2.5 Volts monitor | 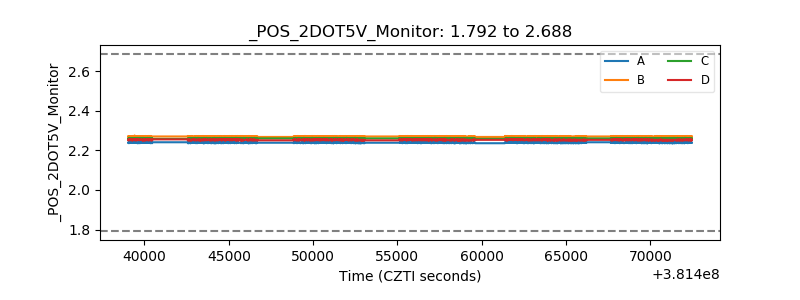 |
| +5 Volts monitor | 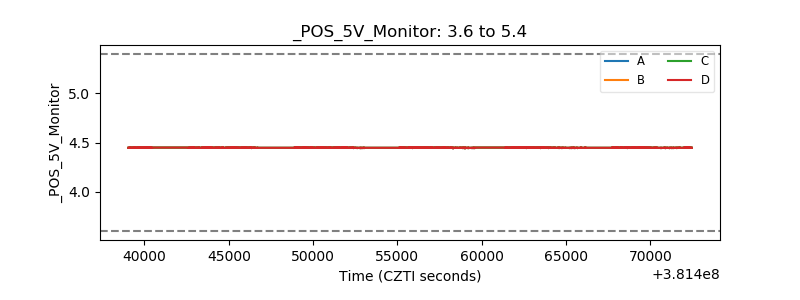 |
| _ROLL_ROT | 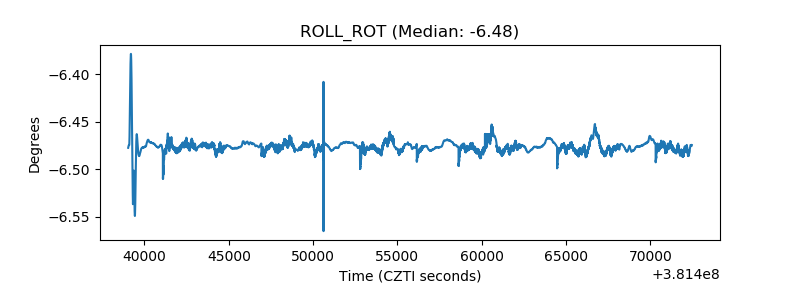 |
| _Roll_DEC | 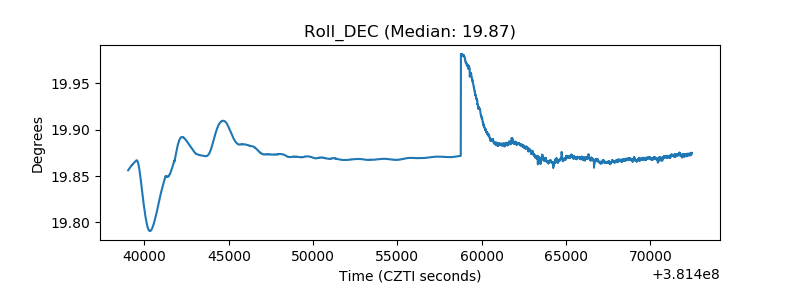 |
| _Roll_RA | 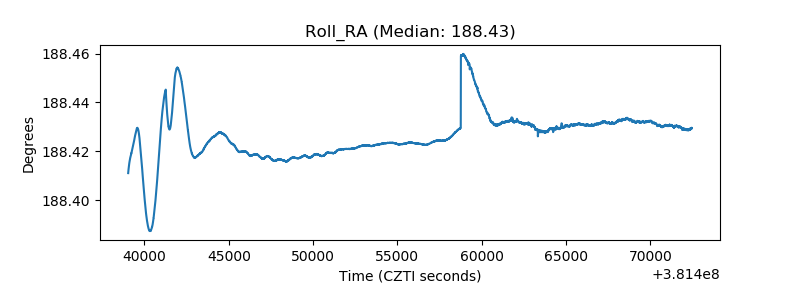 |
| Veto Counter | 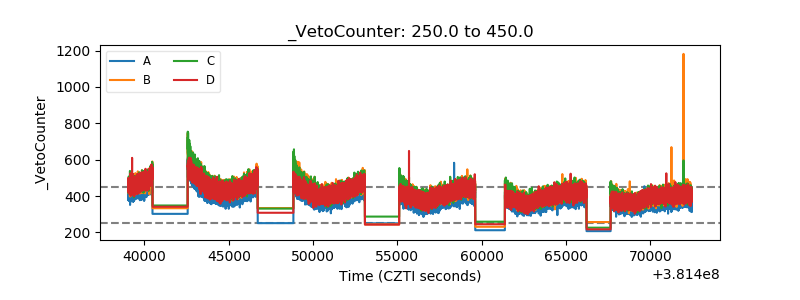 |