| Param | Original file | Final file |
|---|---|---|
| Filename | modeM0/AS1A05_012T02_9000004898_34321cztM0_level2.evt | modeM0/AS1A05_012T02_9000004898_34321cztM0_level2_quad_clean.evt |
| Size (bytes) | 287,449,920 | 43,577,280 |
| Size | 274.1 MB | 41.6 MB |
| Events in quadrant A | 1,098,725 | 309,242 |
| Events in quadrant B | 1,267,911 | 320,120 |
| Events in quadrant C | 1,727,110 | 300,636 |
| Events in quadrant D | 4,462,402 | 231,420 |
| Mode M0 | |||
|---|---|---|---|
| Quadrant | BADHDUFLAG | Total packets | Discarded packets |
| A | 0 | 4592 | 1 |
| B | 0 | 5137 | 1 |
| C | 0 | 6551 | 1 |
| D | 0 | 14754 | 1 |
| Mode M9 | |||
|---|---|---|---|
| Quadrant | BADHDUFLAG | Total packets | Discarded packets |
| A | 0 | 20 | 0 |
| B | 0 | 20 | 0 |
| C | 0 | 20 | 0 |
| D | 0 | 20 | 0 |
| Mode SS | |||
|---|---|---|---|
| Quadrant | BADHDUFLAG | Total packets | Discarded packets |
| A | 0 | 46 | 0 |
| B | 0 | 46 | 0 |
| C | 0 | 46 | 0 |
| D | 0 | 46 | 0 |
| Quadrant | Total seconds | Saturated seconds | Saturation percentage |
|---|---|---|---|
| A | 2176 | 1 | 0.045956% |
| B | 2176 | 12 | 0.551471% |
| C | 2176 | 178 | 8.180147% |
| D | 2176 | 1204 | 55.330882% |
Noise dominated data is calculated using 1-second bins in cleaned event files. If a bin has >2000 counts, and if more than 50% of those come from <1% of pixels, then it is considered to be noise-dominated and hence unusable.
| Quadrant | # 1 sec bins | Bins with >0 counts | Bins with >2000 counts | High rate bins dominated by noise | Noise dominated (total time) | Noise dominated (detector-on time) | Marked lightcurve |
|---|---|---|---|---|---|---|---|
| A | 4208 | 2177 | 0 | 0 | 0.00% | 0.00% | 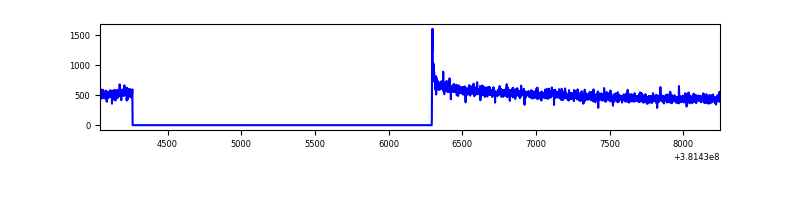 |
| B | 4208 | 2177 | 4 | 4 | 0.10% | 0.18% | 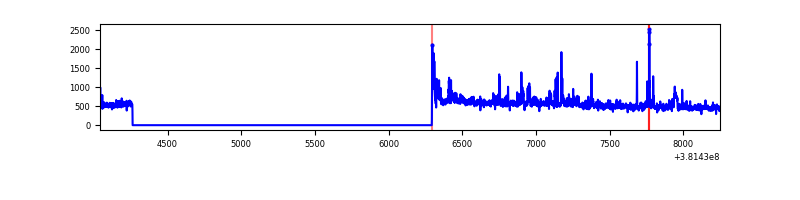 |
| C | 4208 | 2177 | 128 | 128 | 3.04% | 5.88% | 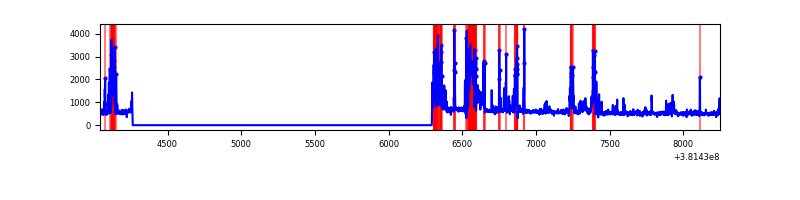 |
| D | 4208 | 2176 | 1182 | 1182 | 28.09% | 54.32% | 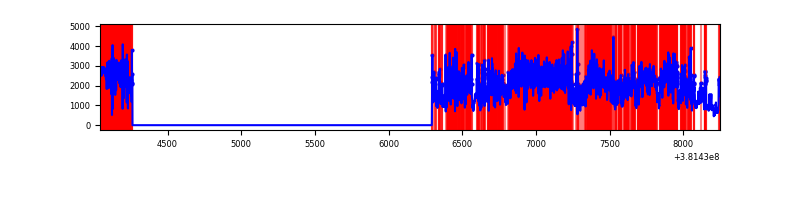 |
Top three noisy pixels from each quadrant. If the there are fewer than three noisy pixels in the level2.evt file, extra rows are filled as -1
| Pixel properties | Quadrant properties | ||||||
|---|---|---|---|---|---|---|---|
| Quadrant | DetID | PixID | Counts | Sigma | Mean | Median | Sigma |
| A | 10 | 83 | 14249 | 246.59 | 279 | 274 | 56.7 |
| A | 13 | 6 | 5078 | 84.77 | 279 | 274 | 56.7 |
| A | 13 | 254 | 3069 | 49.32 | 279 | 274 | 56.7 |
| B | 5 | 31 | 32575 | 605.24 | 282 | 277 | 53.4 |
| B | 5 | 172 | 29240 | 542.74 | 282 | 277 | 53.4 |
| B | 0 | 199 | 29112 | 540.34 | 282 | 277 | 53.4 |
| C | 14 | 254 | 446126 | 7083.55 | 272 | 275 | 62.9 |
| C | 0 | 10 | 101429 | 1607.11 | 272 | 275 | 62.9 |
| C | 15 | 214 | 88873 | 1407.62 | 272 | 275 | 62.9 |
| D | 12 | 235 | 1729489 | 30990.06 | 225 | 219 | 55.8 |
| D | 12 | 227 | 988168 | 17704.92 | 225 | 219 | 55.8 |
| D | 8 | 195 | 275613 | 4935.31 | 225 | 219 | 55.8 |
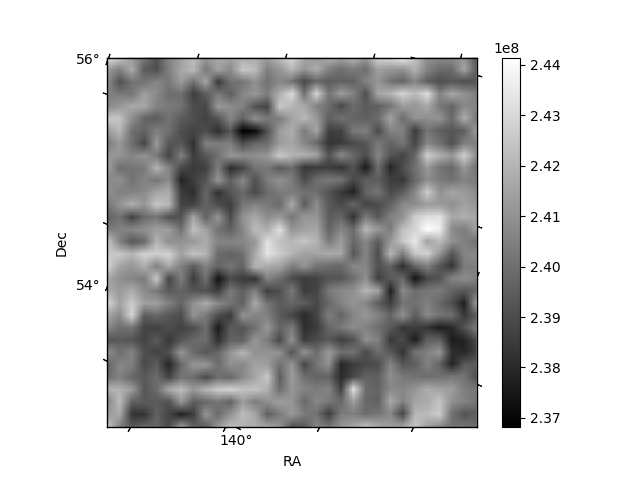
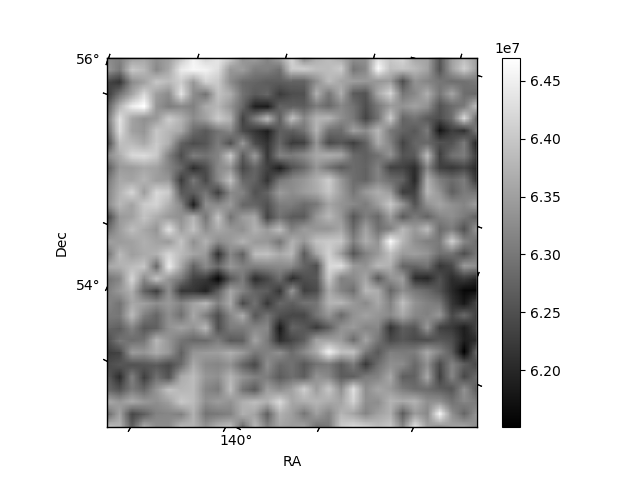
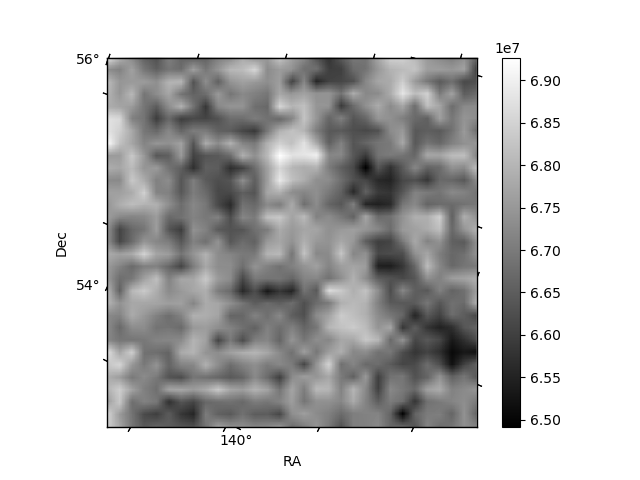
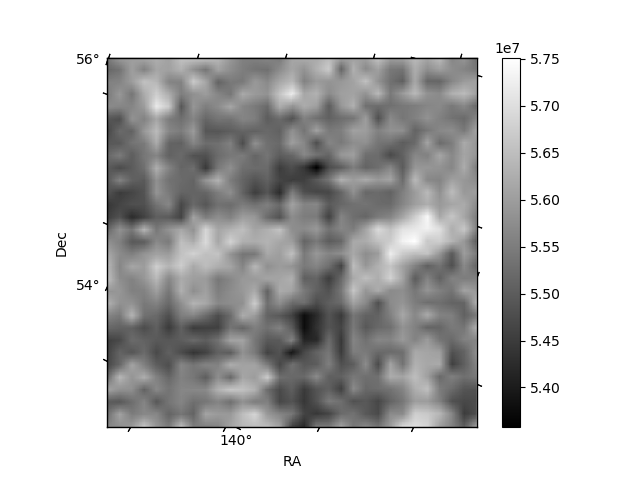
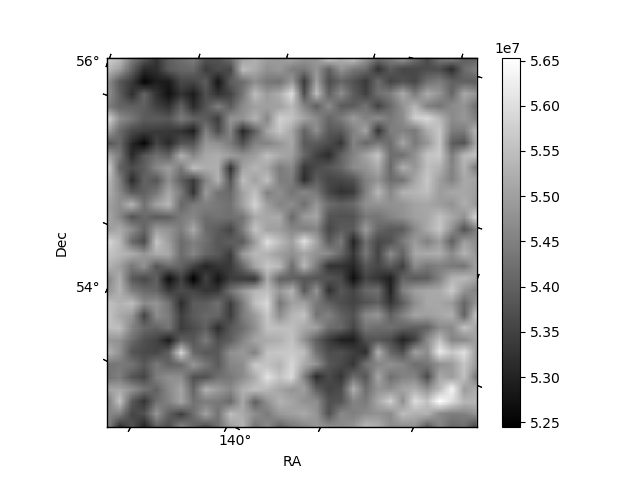
Histogram calculated using DETX and DETY for each event in the final _common_clean file
| Quadrant A | 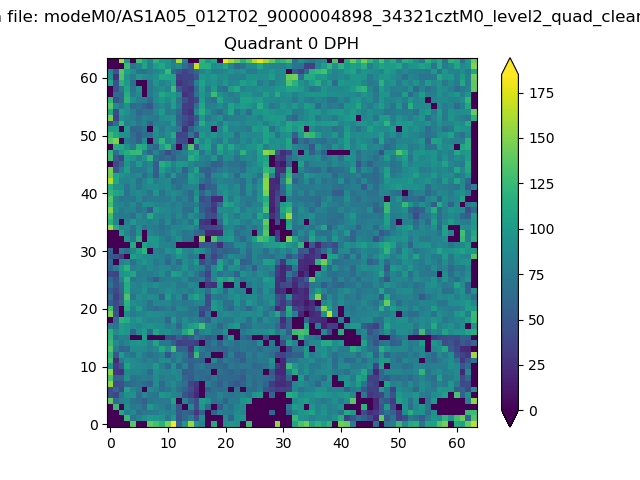 |
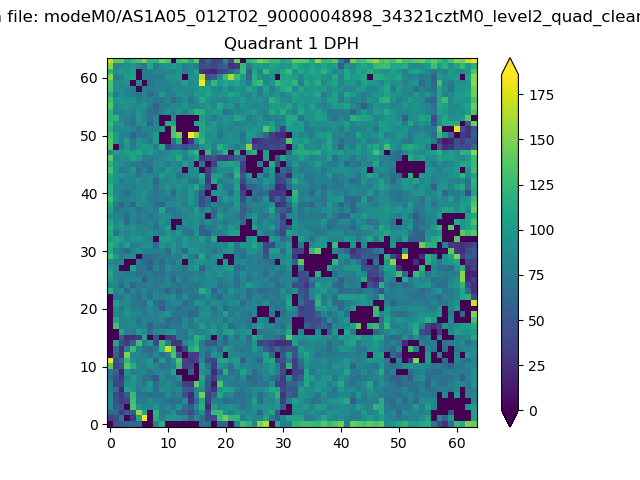 |
Quadrant B |
|---|---|---|---|
| Quadrant D | 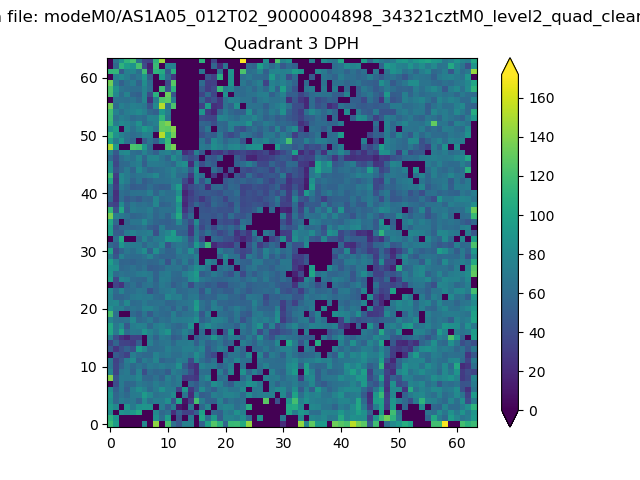 |
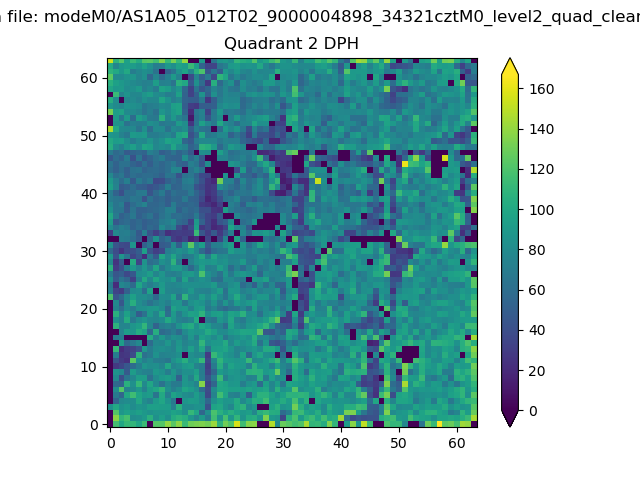 |
Quadrant C |
| Plot type | Count rate plots | Images |
|---|---|---|
| Comparison with Poisson distribution Blue bars denote a histogram of data divided into 1 sec bins. Red curve is a Poisson curve with rate = median count rate of data. |
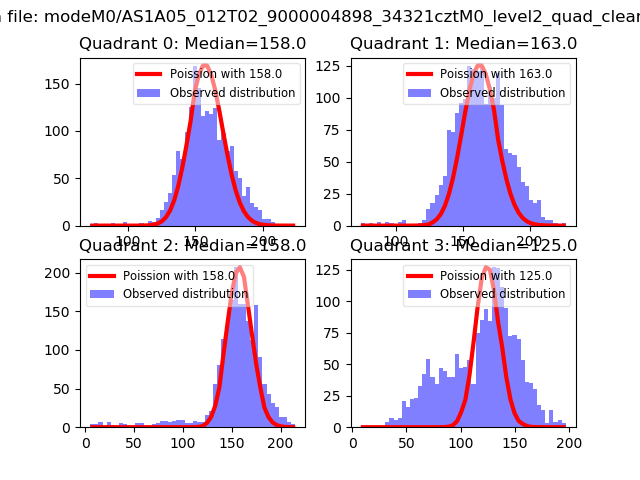 |
 |
| Quadrant-wise count rates Data is divided into 100 sec bins |
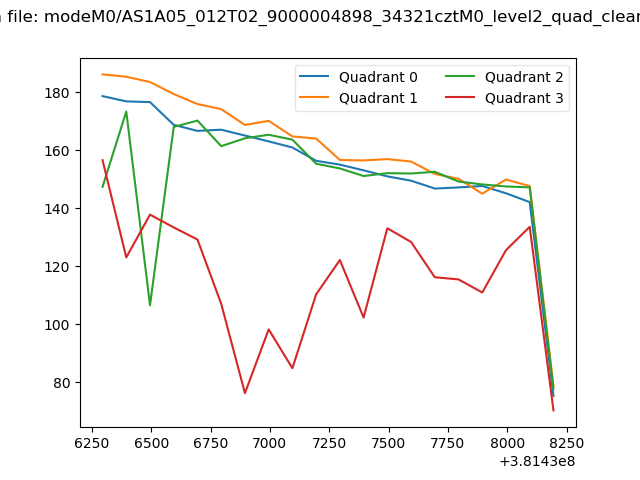 |
|
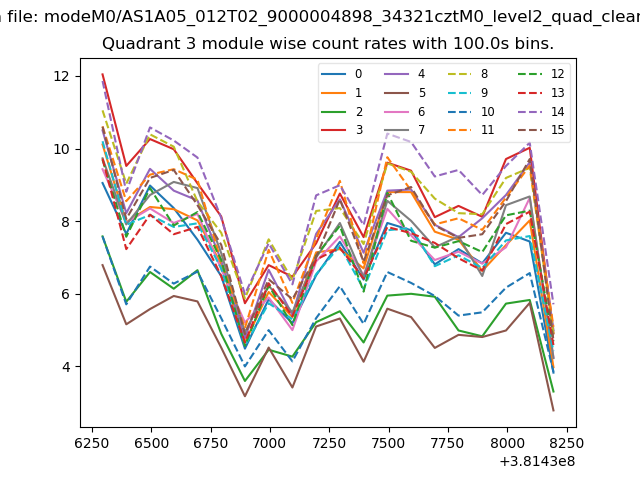
| Module-wise count rates for Quadrant A Data is divided into 100 sec bins |
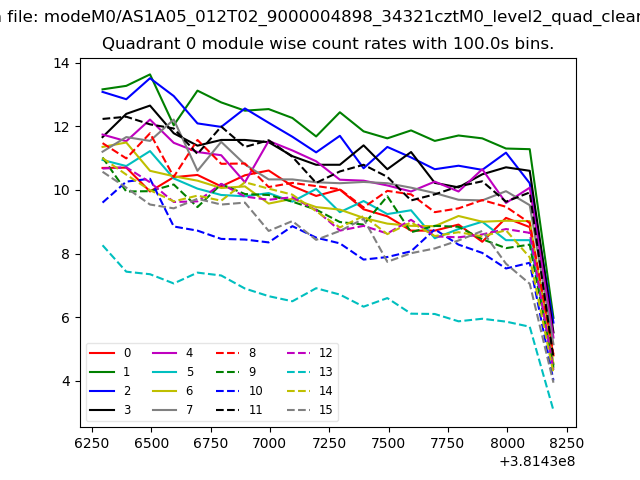 |
 |
| Module-wise count rates for Quadrant B Data is divided into 100 sec bins |
 |
 |
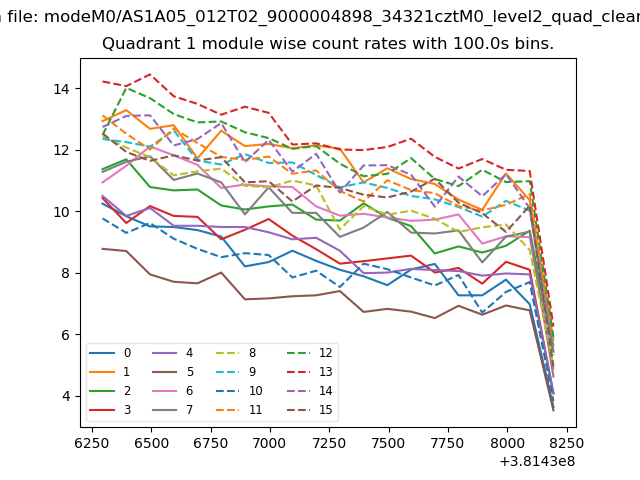
| Module-wise count rates for Quadrant C Data is divided into 100 sec bins |
 |
 |
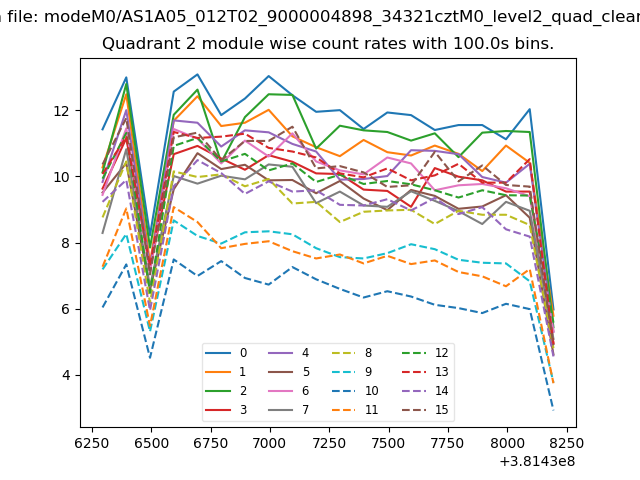
| Module-wise count rates for Quadrant D Data is divided into 100 sec bins |
 |
 |
| Parameter | Plot |
|---|---|
| CZT HV Monitor | 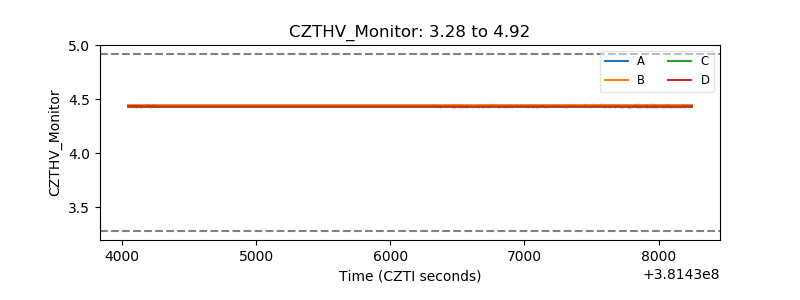 |
| D_VDD |  |
| Temperature 1 | 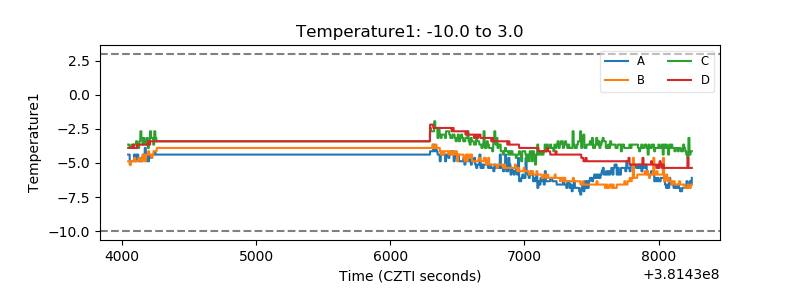 |
| Veto HV Monitor | 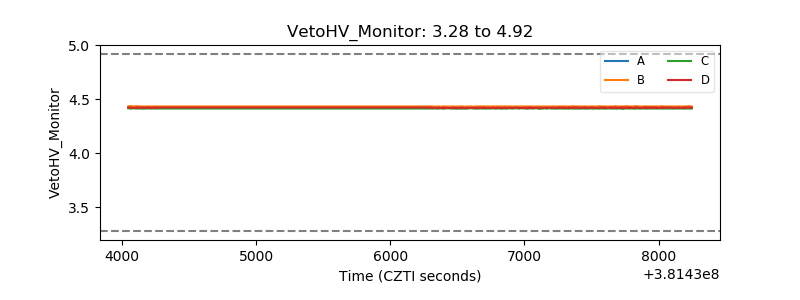 |
| Veto LLD | 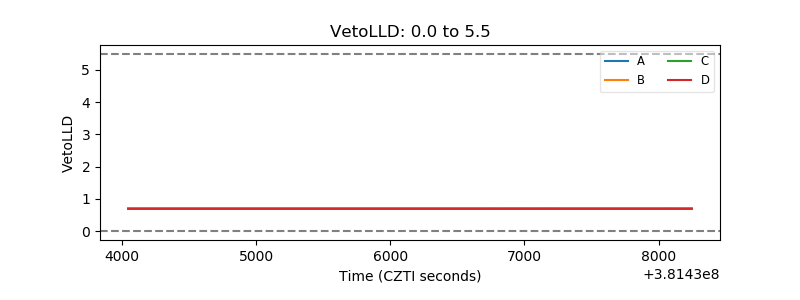 |
| Alpha Counter | 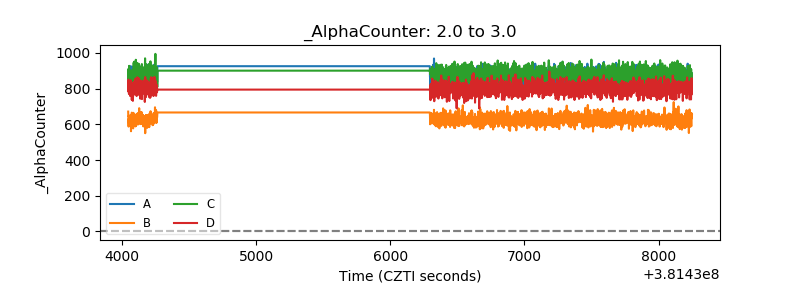 |
| _CPM_Rate | 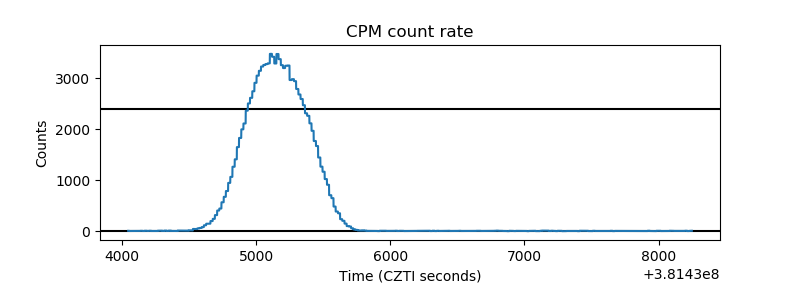 |
| CZT Counter | 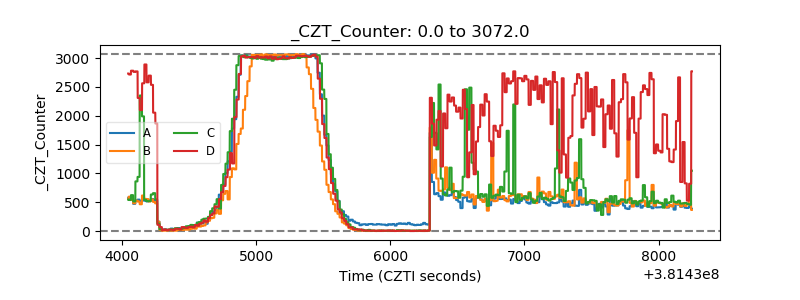 |
| +2.5 Volts monitor | 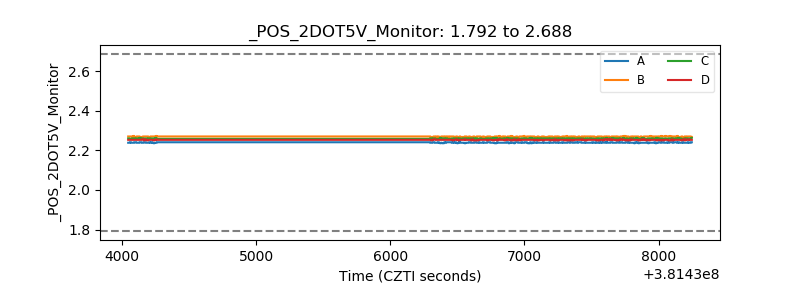 |
| +5 Volts monitor | 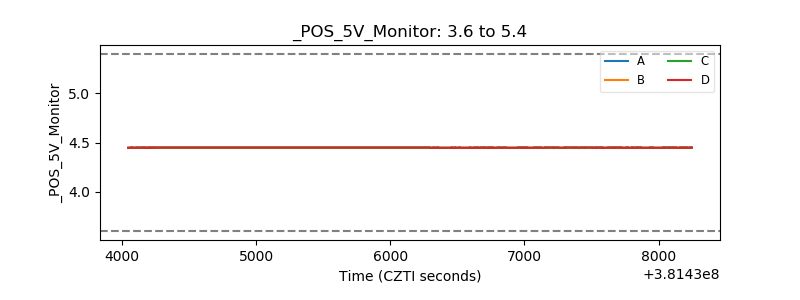 |
| _ROLL_ROT |  |
| _Roll_DEC | 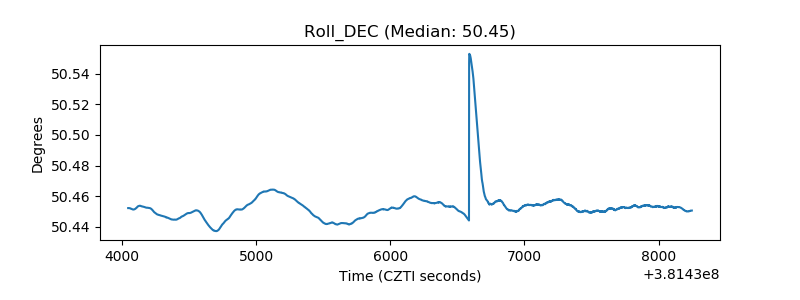 |
| _Roll_RA | 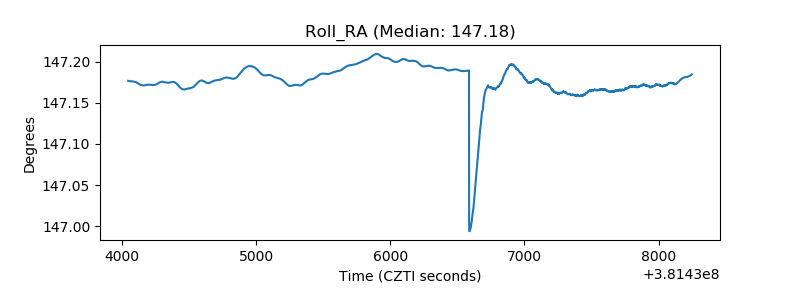 |
| Veto Counter | 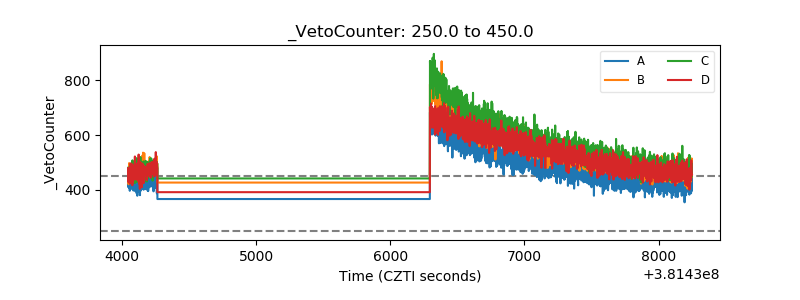 |