| Param | Original file | Final file |
|---|---|---|
| Filename | modeM0/AS1A05_012T02_9000004898_34319cztM0_level2.evt | modeM0/AS1A05_012T02_9000004898_34319cztM0_level2_quad_clean.evt |
| Size (bytes) | 559,117,440 | 97,752,960 |
| Size | 533.2 MB | 93.2 MB |
| Events in quadrant A | 2,607,399 | 687,281 |
| Events in quadrant B | 2,940,090 | 696,524 |
| Events in quadrant C | 2,994,916 | 686,491 |
| Events in quadrant D | 8,040,060 | 526,930 |
| Mode M0 | |||
|---|---|---|---|
| Quadrant | BADHDUFLAG | Total packets | Discarded packets |
| A | 0 | 11107 | 2 |
| B | 0 | 12029 | 1 |
| C | 0 | 12164 | 1 |
| D | 0 | 27550 | 1 |
| Mode M9 | |||
|---|---|---|---|
| Quadrant | BADHDUFLAG | Total packets | Discarded packets |
| A | 0 | 37 | 0 |
| B | 0 | 37 | 0 |
| C | 0 | 37 | 0 |
| D | 0 | 37 | 0 |
| Mode SS | |||
|---|---|---|---|
| Quadrant | BADHDUFLAG | Total packets | Discarded packets |
| A | 0 | 104 | 0 |
| B | 0 | 104 | 0 |
| C | 0 | 104 | 0 |
| D | 0 | 104 | 0 |
| Quadrant | Total seconds | Saturated seconds | Saturation percentage |
|---|---|---|---|
| A | 5179 | 18 | 0.347557% |
| B | 5179 | 38 | 0.733732% |
| C | 5179 | 42 | 0.810967% |
| D | 5179 | 1812 | 34.987449% |
Noise dominated data is calculated using 1-second bins in cleaned event files. If a bin has >2000 counts, and if more than 50% of those come from <1% of pixels, then it is considered to be noise-dominated and hence unusable.
| Quadrant | # 1 sec bins | Bins with >0 counts | Bins with >2000 counts | High rate bins dominated by noise | Noise dominated (total time) | Noise dominated (detector-on time) | Marked lightcurve |
|---|---|---|---|---|---|---|---|
| A | 7092 | 5180 | 8 | 8 | 0.11% | 0.15% | 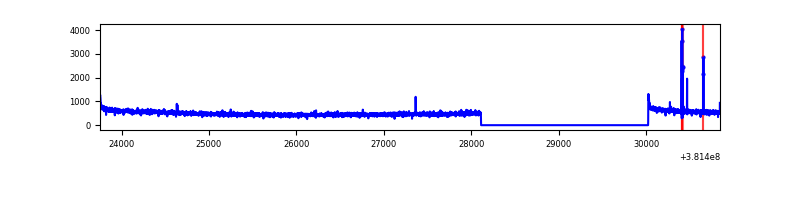 |
| B | 7092 | 5180 | 20 | 20 | 0.28% | 0.39% | 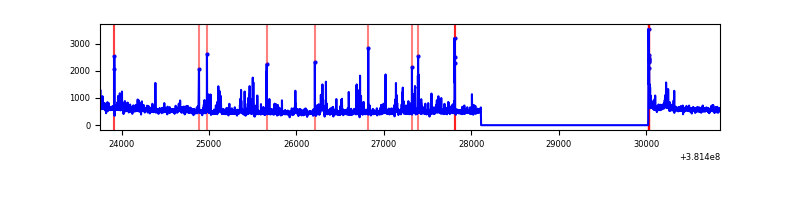 |
| C | 7092 | 5180 | 26 | 26 | 0.37% | 0.50% | 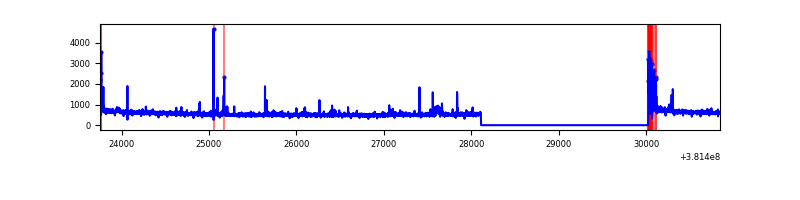 |
| D | 7092 | 5180 | 1517 | 1517 | 21.39% | 29.29% | 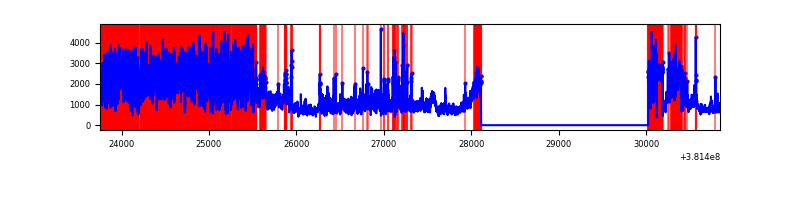 |
Top three noisy pixels from each quadrant. If the there are fewer than three noisy pixels in the level2.evt file, extra rows are filled as -1
| Pixel properties | Quadrant properties | ||||||
|---|---|---|---|---|---|---|---|
| Quadrant | DetID | PixID | Counts | Sigma | Mean | Median | Sigma |
| A | 9 | 191 | 32985 | 249.49 | 656 | 644 | 129.6 |
| A | 10 | 83 | 29461 | 222.3 | 656 | 644 | 129.6 |
| A | 13 | 6 | 11606 | 84.56 | 656 | 644 | 129.6 |
| B | 5 | 172 | 179493 | 1470.75 | 655 | 639 | 121.6 |
| B | 4 | 251 | 80534 | 656.99 | 655 | 639 | 121.6 |
| B | 4 | 171 | 33803 | 272.71 | 655 | 639 | 121.6 |
| C | 15 | 214 | 219787 | 1470.84 | 650 | 657 | 149.0 |
| C | 0 | 10 | 98810 | 658.82 | 650 | 657 | 149.0 |
| C | 14 | 254 | 56507 | 374.87 | 650 | 657 | 149.0 |
| D | 1 | 52 | 2787465 | 21374.89 | 533 | 520 | 130.4 |
| D | 12 | 227 | 1564800 | 11997.48 | 533 | 520 | 130.4 |
| D | 8 | 195 | 640011 | 4904.67 | 533 | 520 | 130.4 |
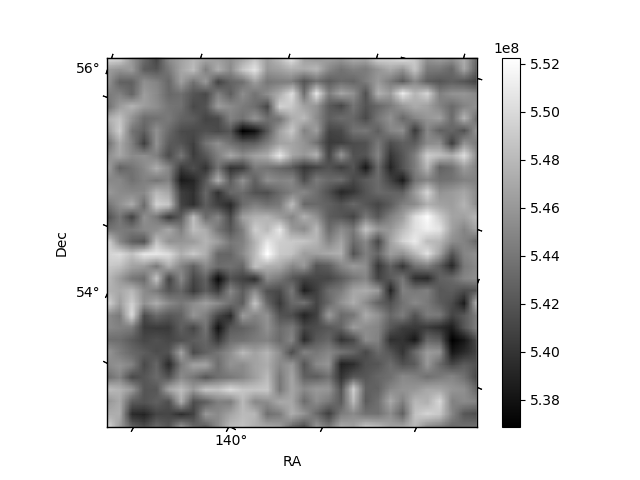
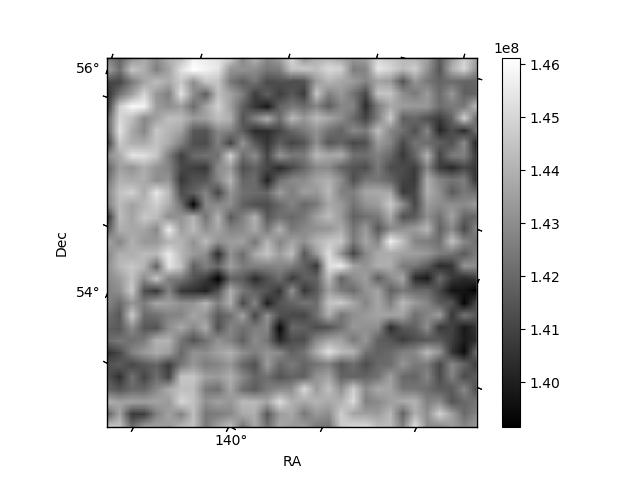
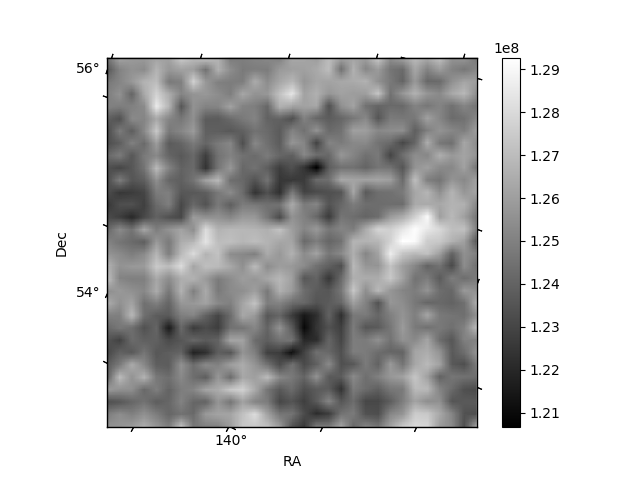
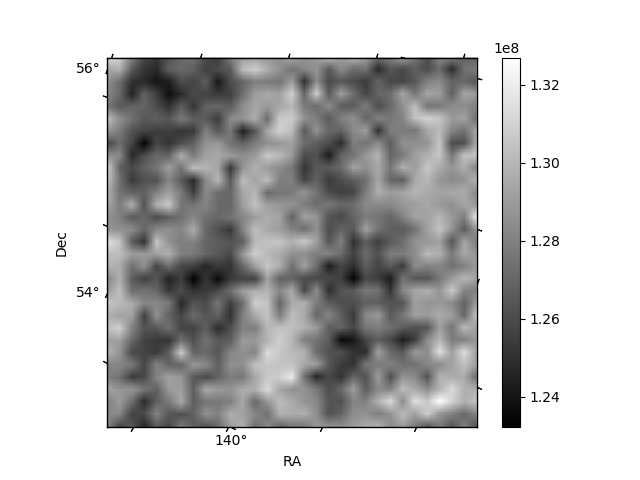
Histogram calculated using DETX and DETY for each event in the final _common_clean file
| Quadrant A | 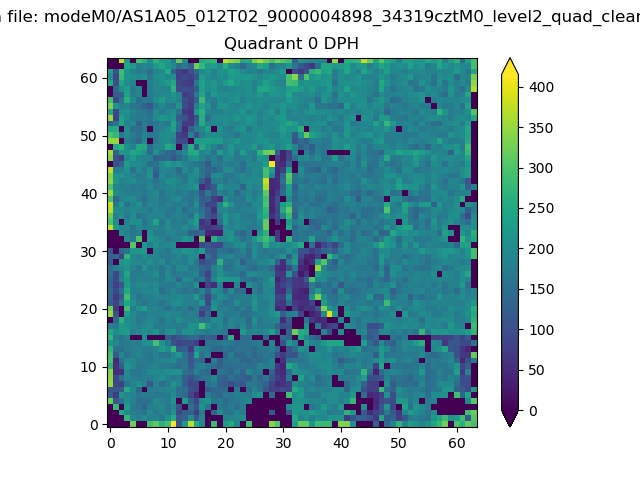 |
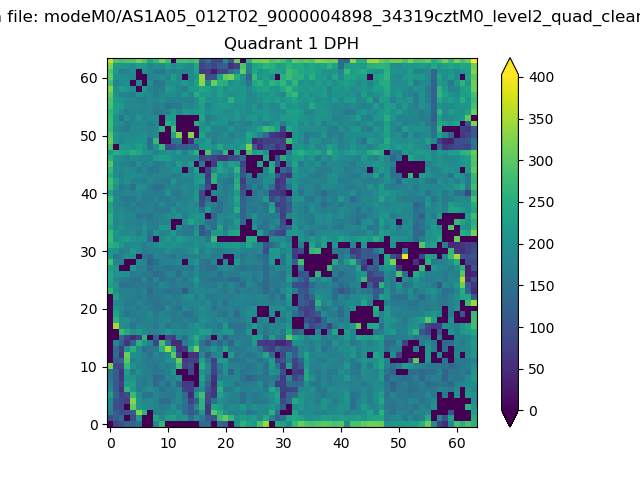 |
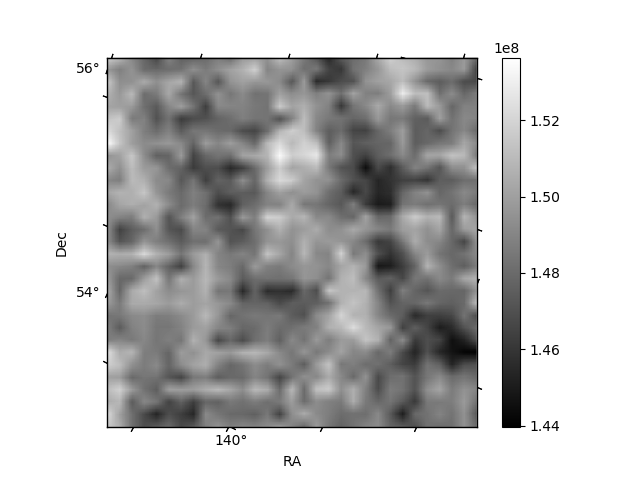
Quadrant B |
|---|---|---|---|
| Quadrant D | 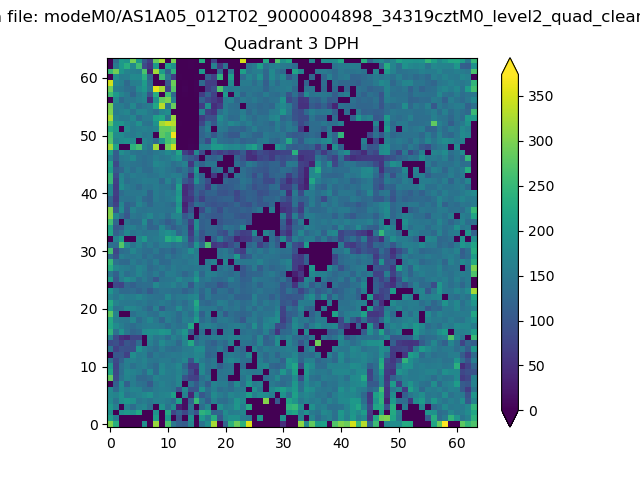 |
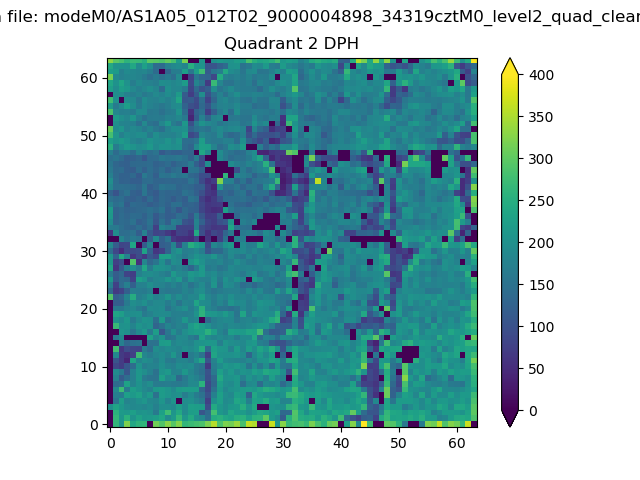 |
Quadrant C |
| Plot type | Count rate plots | Images |
|---|---|---|
| Comparison with Poisson distribution Blue bars denote a histogram of data divided into 1 sec bins. Red curve is a Poisson curve with rate = median count rate of data. |
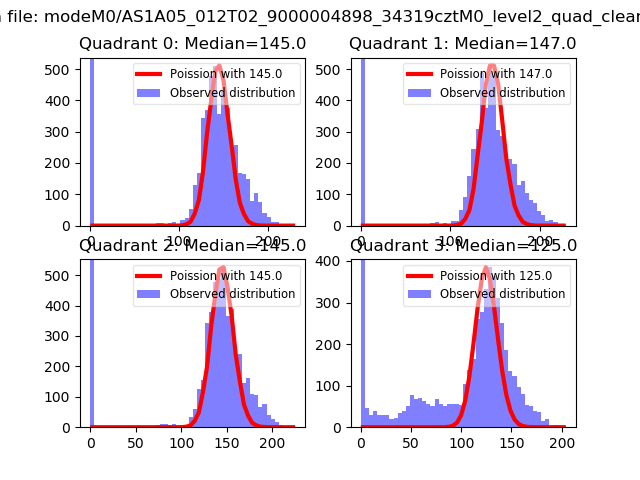 |
 |
| Quadrant-wise count rates Data is divided into 100 sec bins |
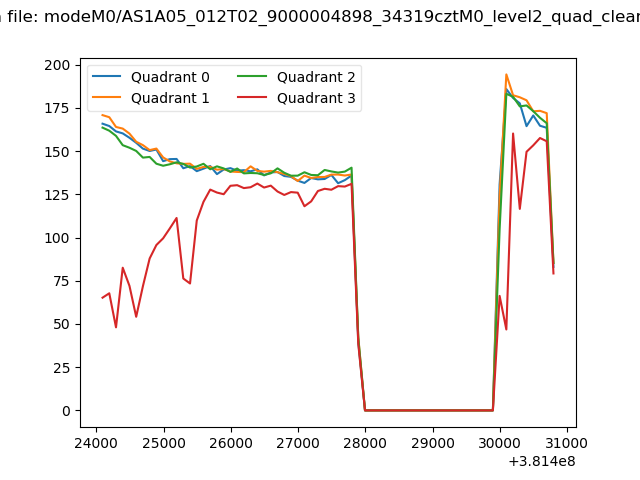 |
|
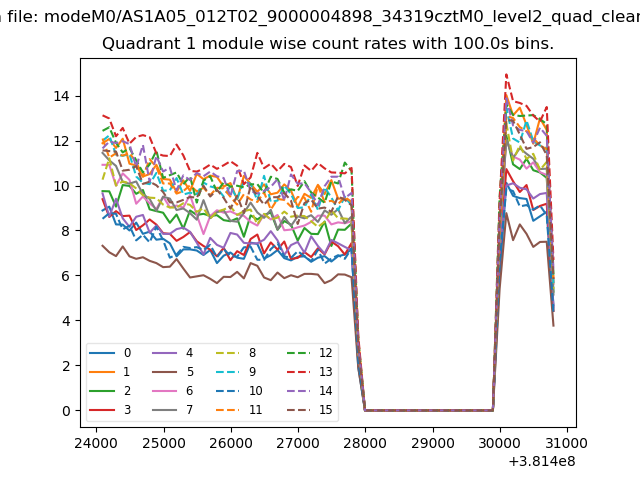
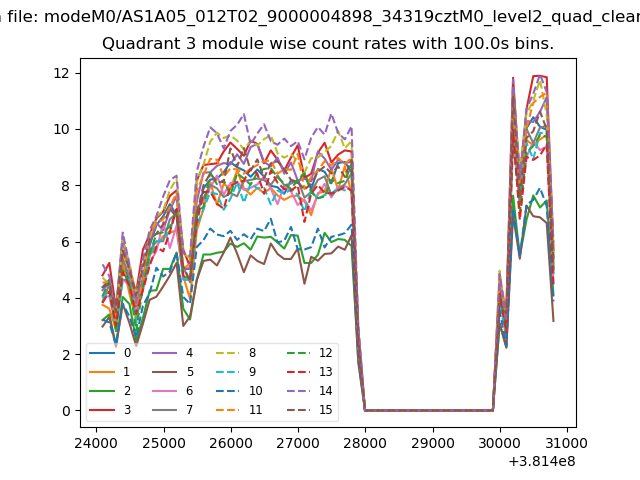
| Module-wise count rates for Quadrant A Data is divided into 100 sec bins |
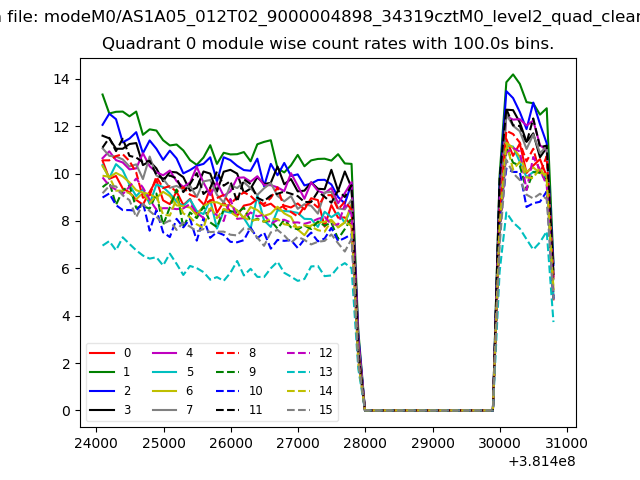 |
 |
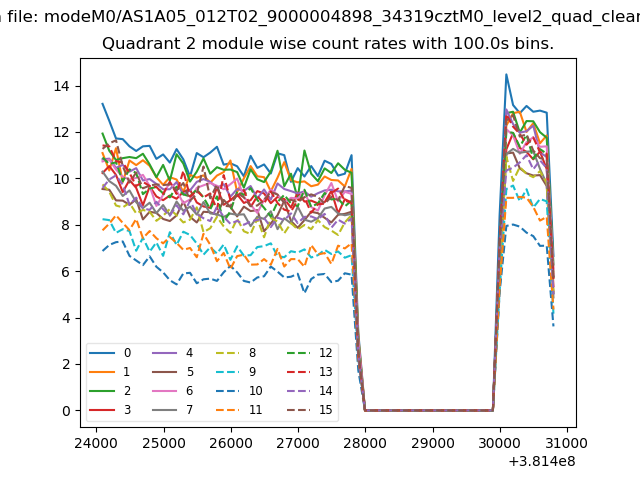
| Module-wise count rates for Quadrant B Data is divided into 100 sec bins |
 |
 |
| Module-wise count rates for Quadrant C Data is divided into 100 sec bins |
 |
 |
| Module-wise count rates for Quadrant D Data is divided into 100 sec bins |
 |
 |
| Parameter | Plot |
|---|---|
| CZT HV Monitor |  |
| D_VDD | 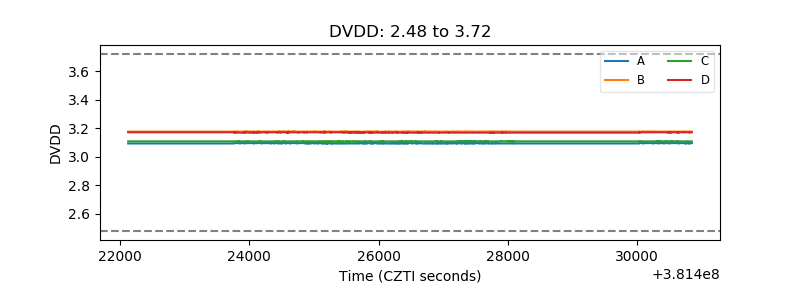 |
| Temperature 1 | 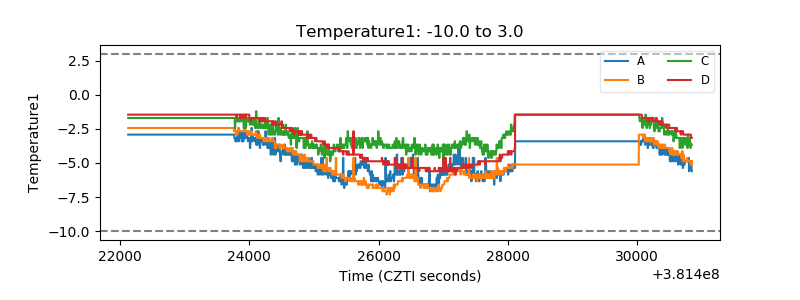 |
| Veto HV Monitor | 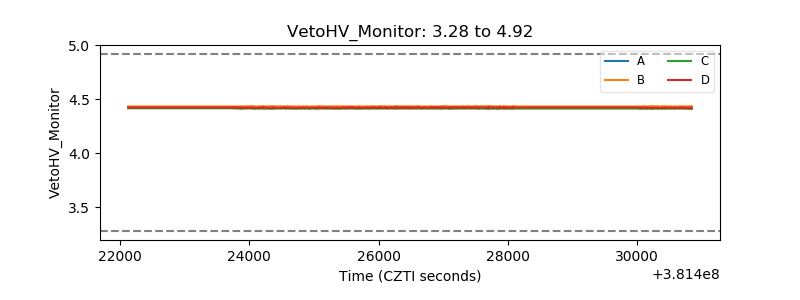 |
| Veto LLD | 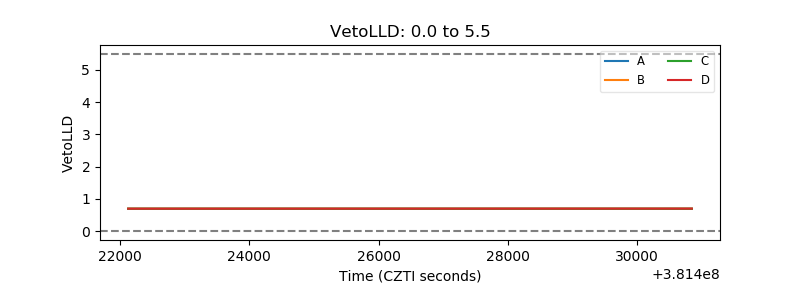 |
| Alpha Counter | 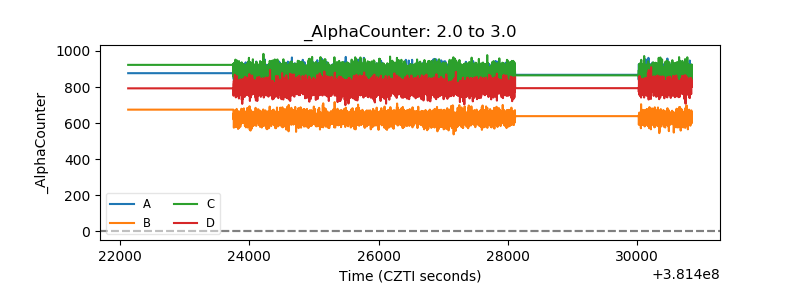 |
| _CPM_Rate | 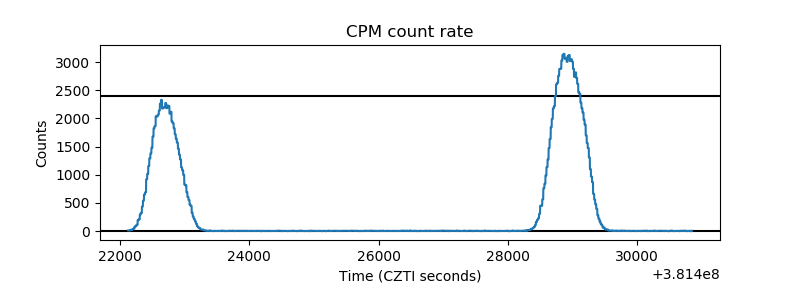 |
| CZT Counter | 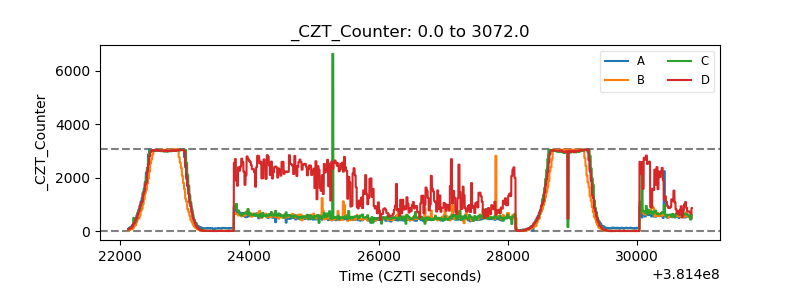 |
| +2.5 Volts monitor | 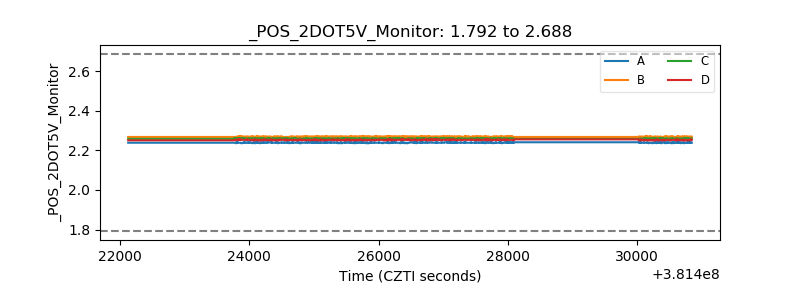 |
| +5 Volts monitor | 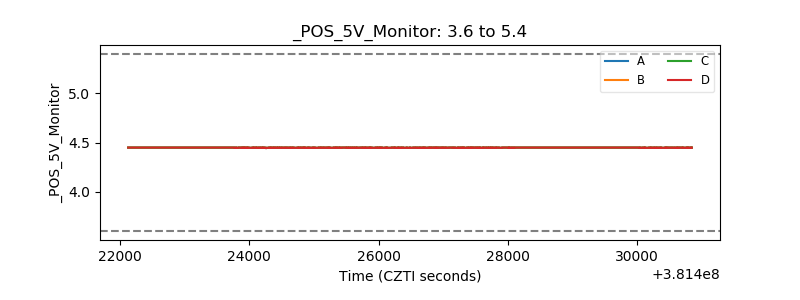 |
| _ROLL_ROT | 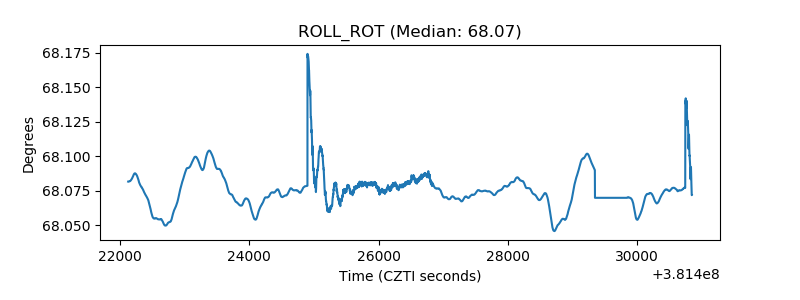 |
| _Roll_DEC | 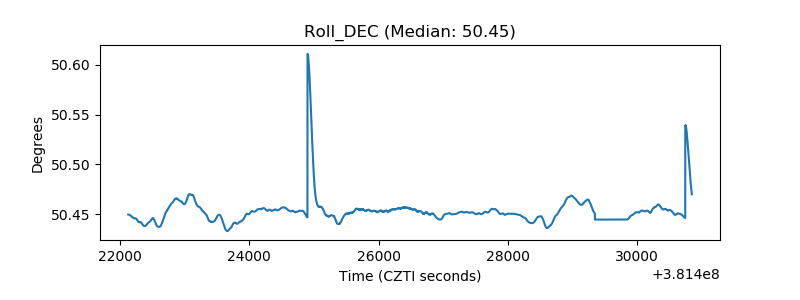 |
| _Roll_RA | 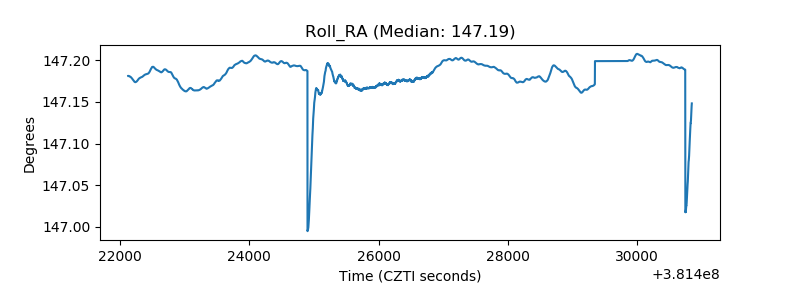 |
| Veto Counter | 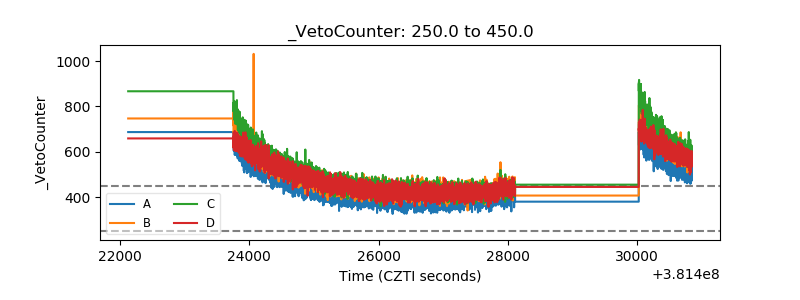 |