| Param | Original file | Final file |
|---|---|---|
| Filename | modeM0/AS1A05_012T02_9000004898cztM0_level2_bc.evt | modeM0/AS1A05_012T02_9000004898cztM0_level2_quad_clean.evt |
| Size (bytes) | 829,224,000 | 216,907,200 |
| Size | 790.8 MB | 206.9 MB |
| Events in quadrant A | 2,668,138 | 1,519,359 |
| Events in quadrant B | 3,446,880 | 1,542,459 |
| Events in quadrant C | 3,972,798 | 1,516,320 |
| Events in quadrant D | 14,249,710 | 1,206,153 |
| Mode M0 | |||
|---|---|---|---|
| Quadrant | BADHDUFLAG | Total packets | Discarded packets |
| A | 0 | 23718 | 0 |
| B | 0 | 26541 | 0 |
| C | 0 | 28144 | 0 |
| D | 0 | 64943 | 0 |
| Mode M9 | |||
|---|---|---|---|
| Quadrant | BADHDUFLAG | Total packets | Discarded packets |
| A | 0 | 58 | 0 |
| B | 0 | 58 | 0 |
| C | 0 | 58 | 0 |
| D | 0 | 58 | 0 |
| Mode SS | |||
|---|---|---|---|
| Quadrant | BADHDUFLAG | Total packets | Discarded packets |
| A | 0 | 232 | 0 |
| B | 0 | 232 | 0 |
| C | 0 | 232 | 0 |
| D | 0 | 232 | 0 |
| Quadrant | Total seconds | Saturated seconds | Saturation percentage |
|---|---|---|---|
| A | 11341 | 25 | 0.220439% |
| B | 11341 | 106 | 0.934662% |
| C | 11341 | 270 | 2.380742% |
| D | 11341 | 3983 | 35.120360% |
Noise dominated data is calculated using 1-second bins in cleaned event files. If a bin has >2000 counts, and if more than 50% of those come from <1% of pixels, then it is considered to be noise-dominated and hence unusable.
| Quadrant | # 1 sec bins | Bins with >0 counts | Bins with >2000 counts | High rate bins dominated by noise | Noise dominated (total time) | Noise dominated (detector-on time) | Marked lightcurve |
|---|---|---|---|---|---|---|---|
| A | 17078 | 11343 | 0 | 0 | 0.00% | 0.00% | 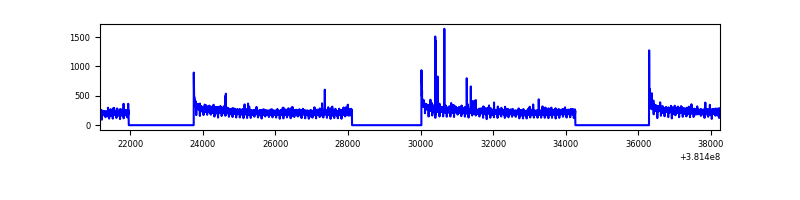 |
| B | 17078 | 11341 | 15 | 15 | 0.09% | 0.13% | 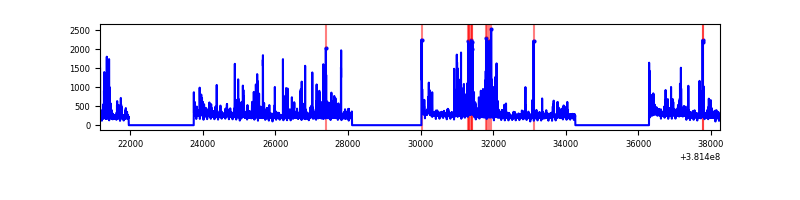 |
| C | 17078 | 11341 | 40 | 40 | 0.23% | 0.35% | 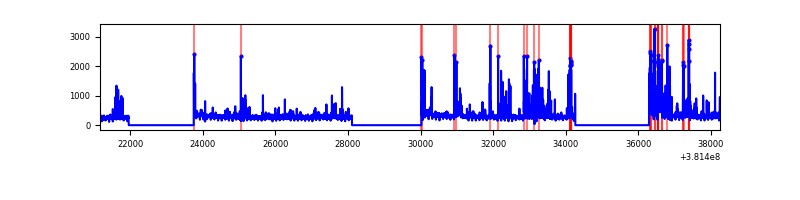 |
| D | 17078 | 11340 | 1481 | 1481 | 8.67% | 13.06% | 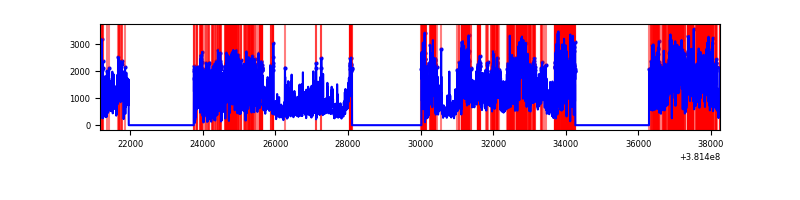 |
Top three noisy pixels from each quadrant. If the there are fewer than three noisy pixels in the level2.evt file, extra rows are filled as -1
| Pixel properties | Quadrant properties | ||||||
|---|---|---|---|---|---|---|---|
| Quadrant | DetID | PixID | Counts | Sigma | Mean | Median | Sigma |
| A | 10 | 83 | 44429 | 299.27 | 668 | 661 | 146.3 |
| A | 13 | 6 | 23707 | 157.58 | 668 | 661 | 146.3 |
| A | 9 | 191 | 21669 | 143.64 | 668 | 661 | 146.3 |
| B | 5 | 172 | 385889 | 2972.06 | 677 | 666 | 129.6 |
| B | 4 | 251 | 104249 | 799.16 | 677 | 666 | 129.6 |
| B | 0 | 199 | 73291 | 560.31 | 677 | 666 | 129.6 |
| C | 14 | 254 | 672729 | 4474.24 | 663 | 661 | 150.2 |
| C | 15 | 214 | 448050 | 2978.46 | 663 | 661 | 150.2 |
| C | 0 | 10 | 135290 | 896.28 | 663 | 661 | 150.2 |
| D | 12 | 227 | 4881104 | 36745.88 | 559 | 544 | 132.8 |
| D | 12 | 235 | 2408324 | 18128.25 | 559 | 544 | 132.8 |
| D | 1 | 52 | 2331896 | 17552.82 | 559 | 544 | 132.8 |
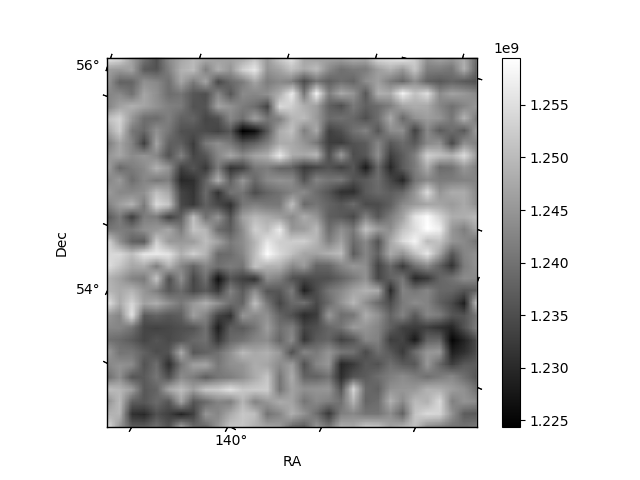
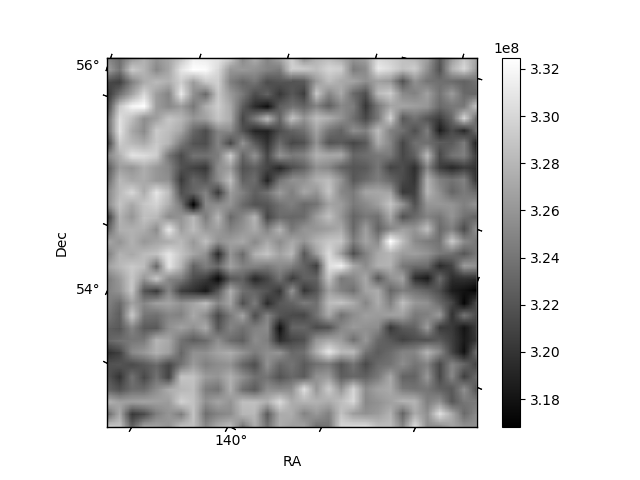
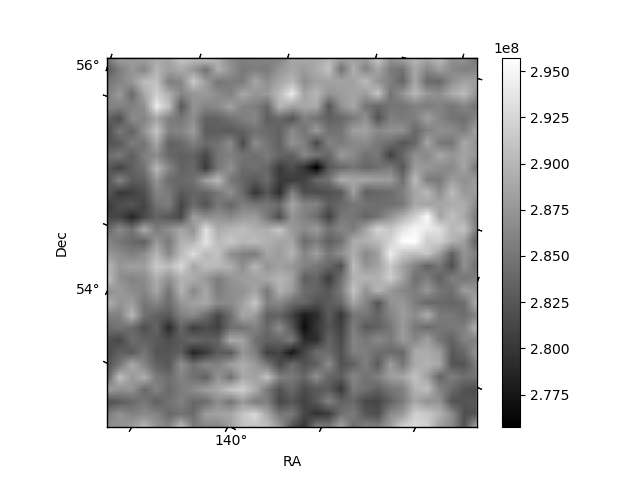
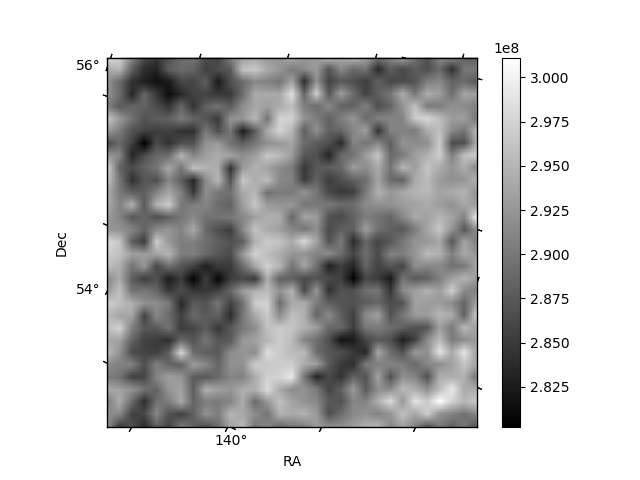
Histogram calculated using DETX and DETY for each event in the final _common_clean file
| Quadrant A | 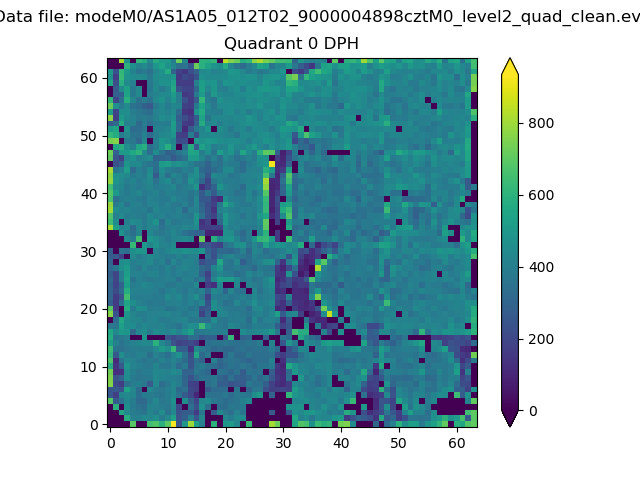 |
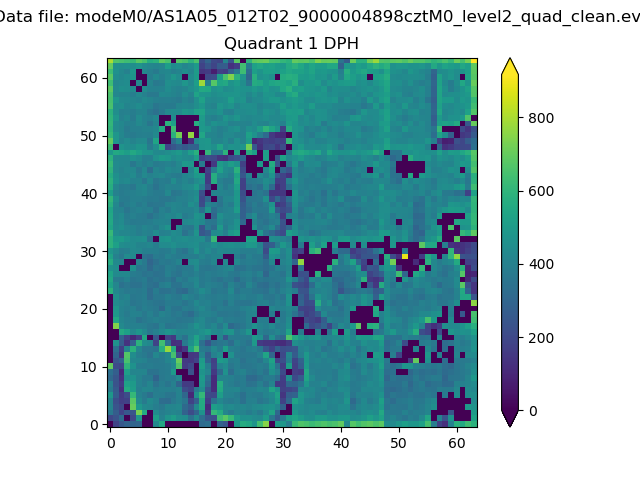 |
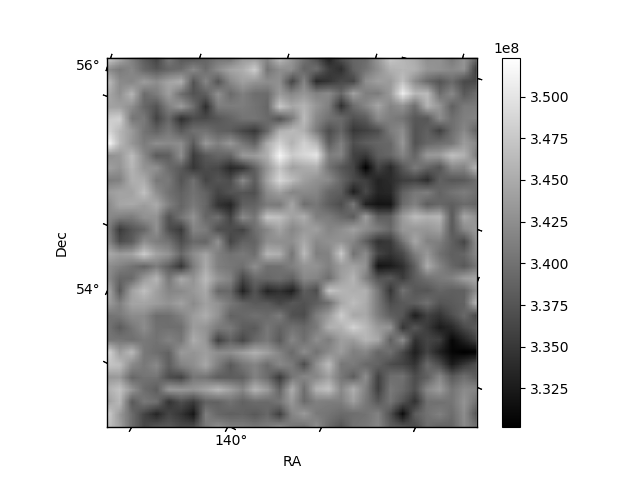
Quadrant B |
|---|---|---|---|
| Quadrant D | 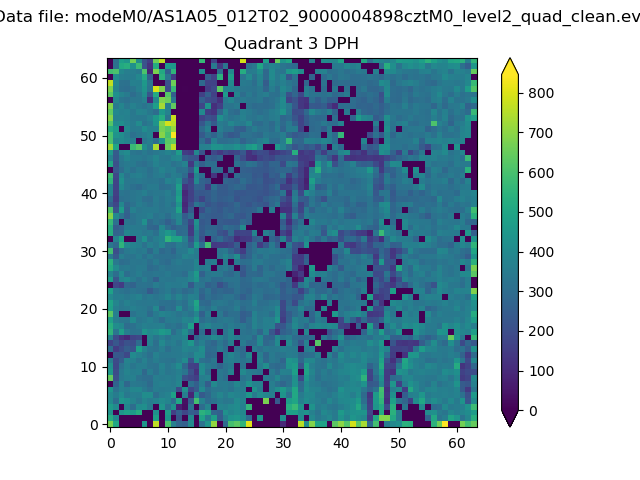 |
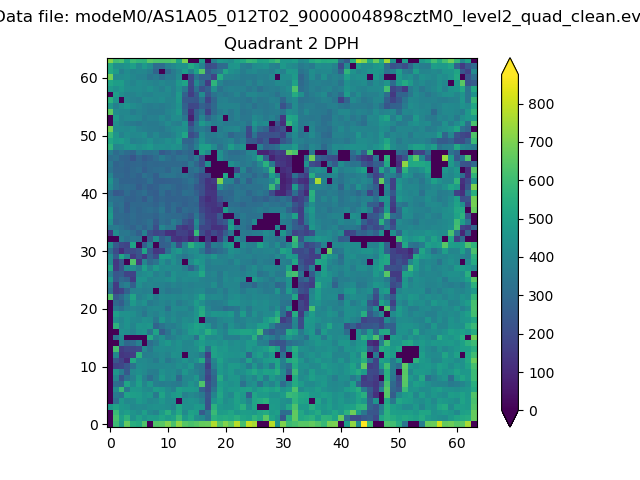 |
Quadrant C |
| Plot type | Count rate plots | Images |
|---|---|---|
| Comparison with Poisson distribution Blue bars denote a histogram of data divided into 1 sec bins. Red curve is a Poisson curve with rate = median count rate of data. |
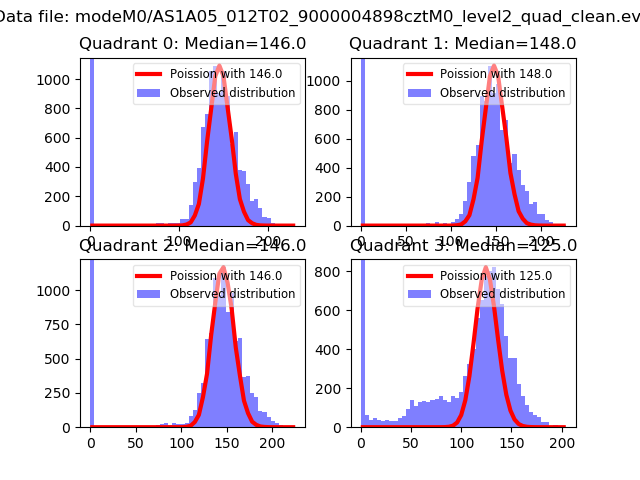 |
 |
| Quadrant-wise count rates Data is divided into 100 sec bins |
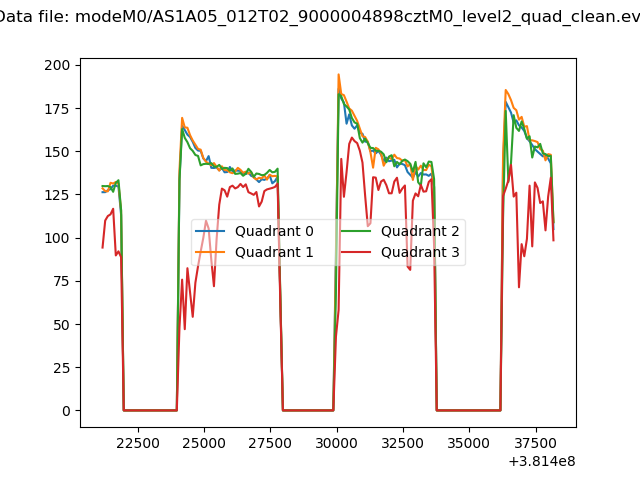 |
|
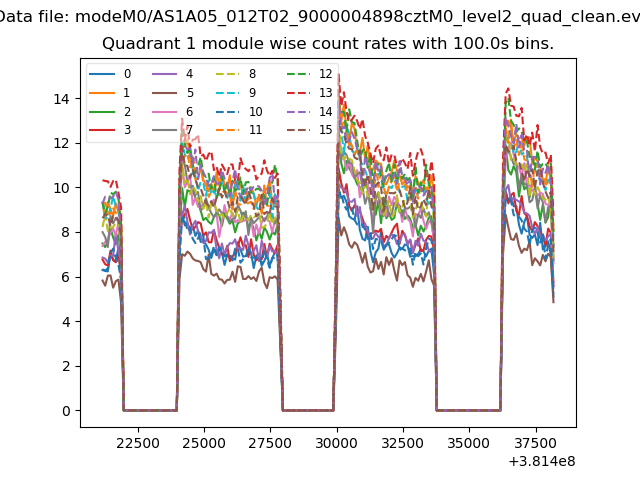
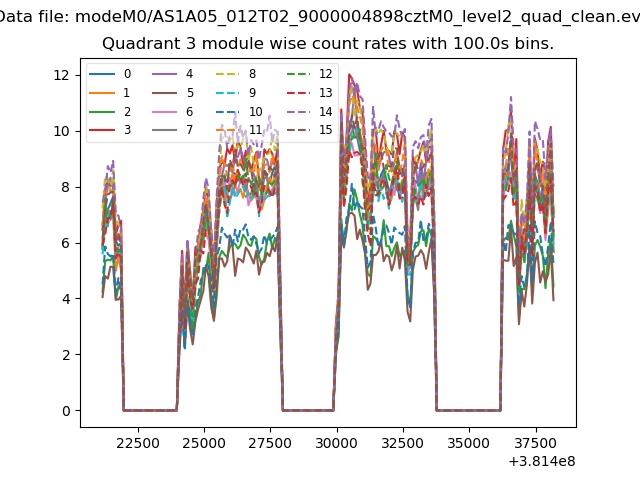
| Module-wise count rates for Quadrant A Data is divided into 100 sec bins |
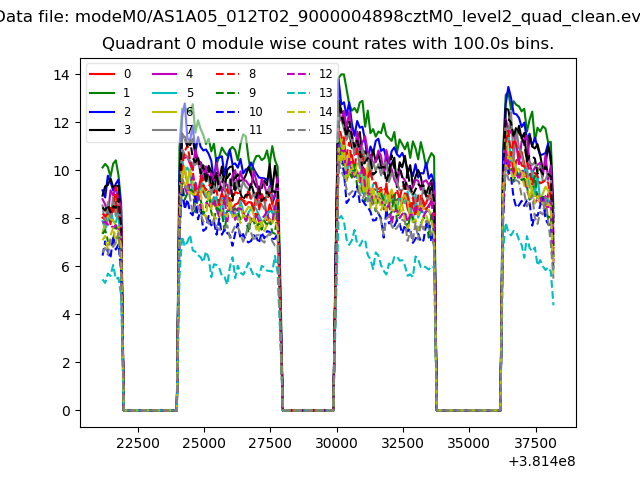 |
 |
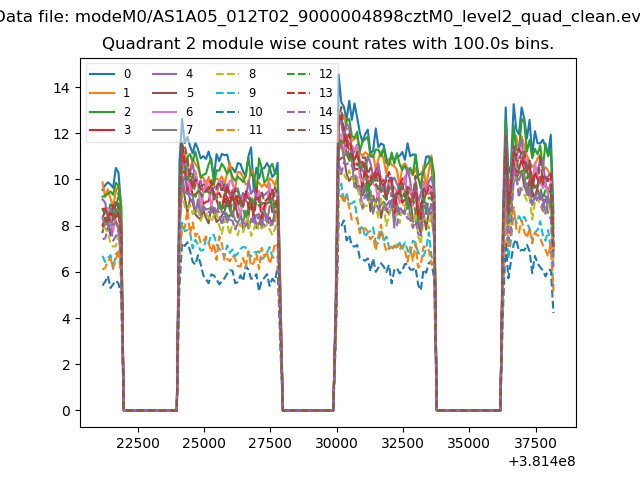
| Module-wise count rates for Quadrant B Data is divided into 100 sec bins |
 |
 |
| Module-wise count rates for Quadrant C Data is divided into 100 sec bins |
 |
 |
| Module-wise count rates for Quadrant D Data is divided into 100 sec bins |
 |
 |
| Parameter | Plot |
|---|---|
| CZT HV Monitor | 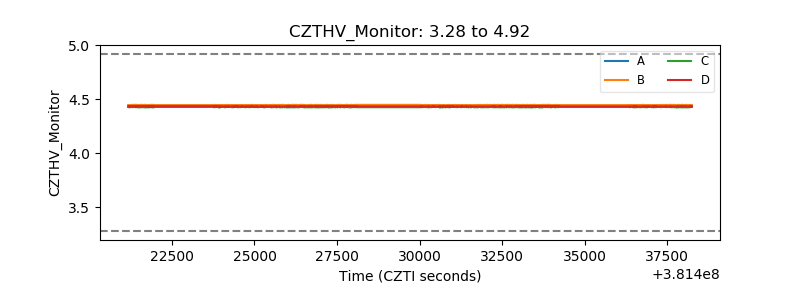 |
| D_VDD | 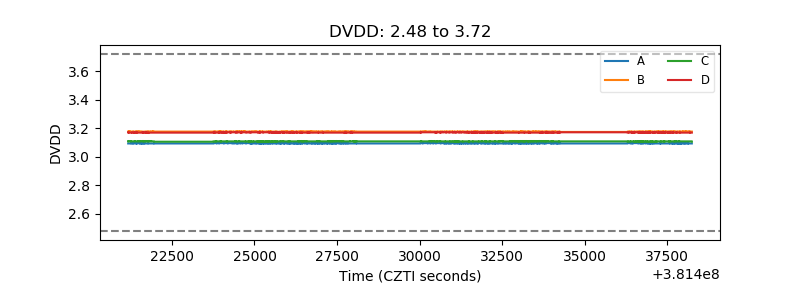 |
| Temperature 1 | 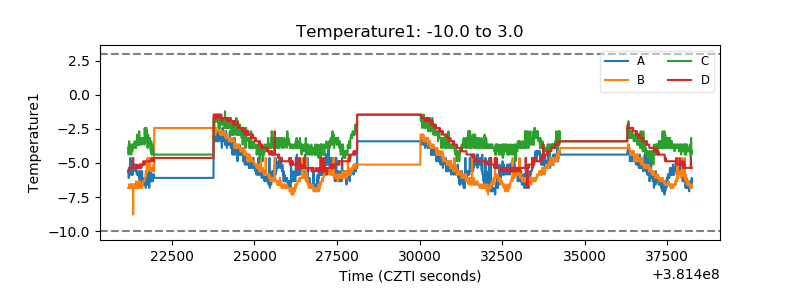 |
| Veto HV Monitor |  |
| Veto LLD | 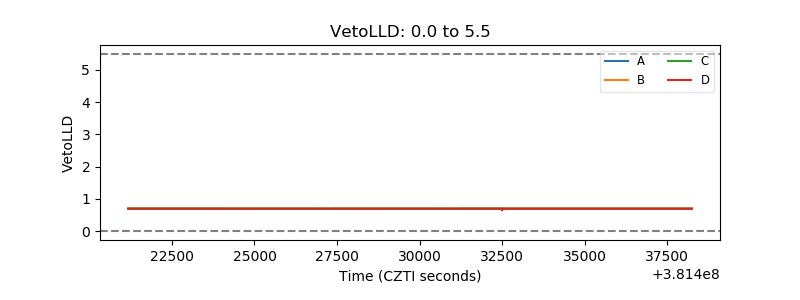 |
| Alpha Counter | 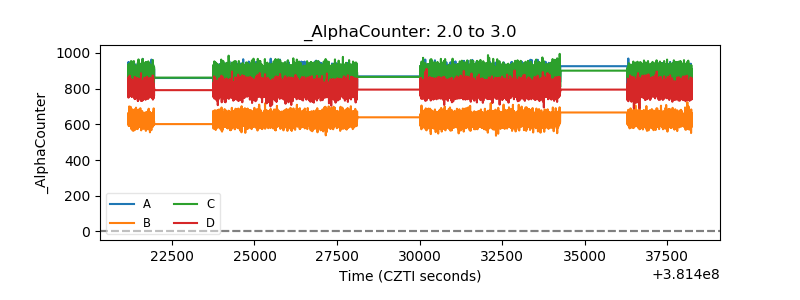 |
| _CPM_Rate | 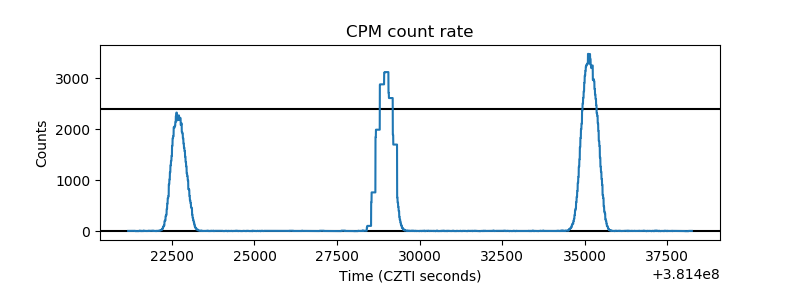 |
| CZT Counter |  |
| +2.5 Volts monitor | 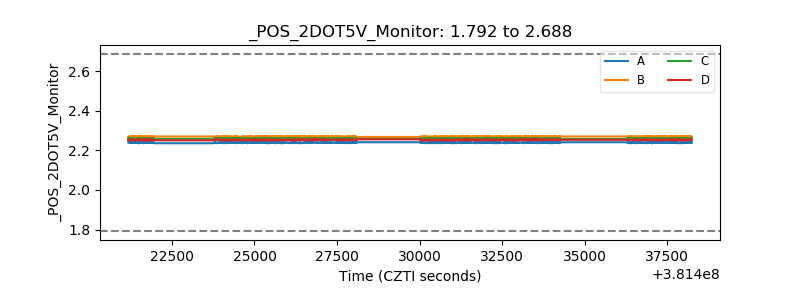 |
| +5 Volts monitor | 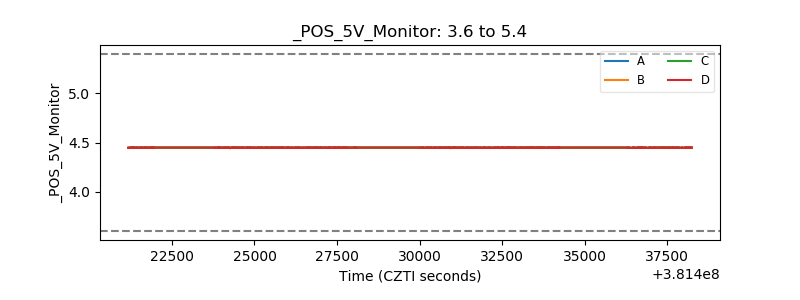 |
| _ROLL_ROT | 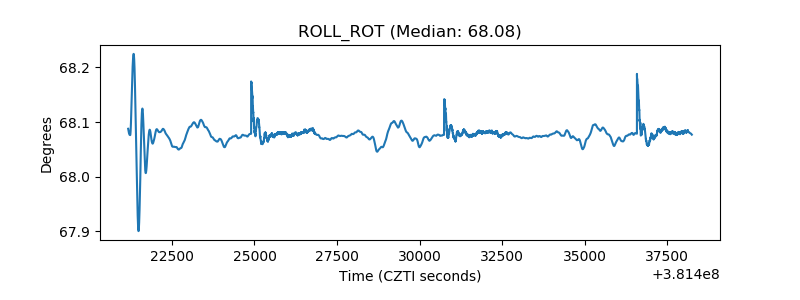 |
| _Roll_DEC | 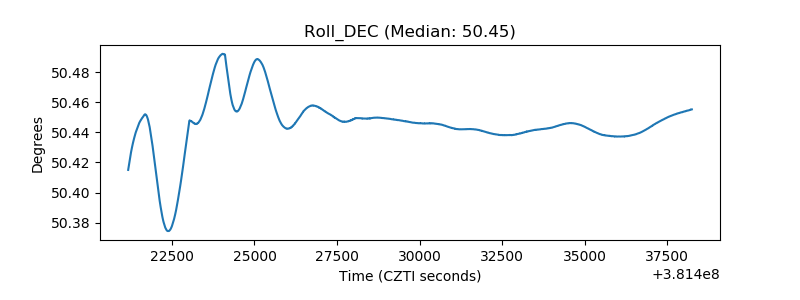 |
| _Roll_RA | 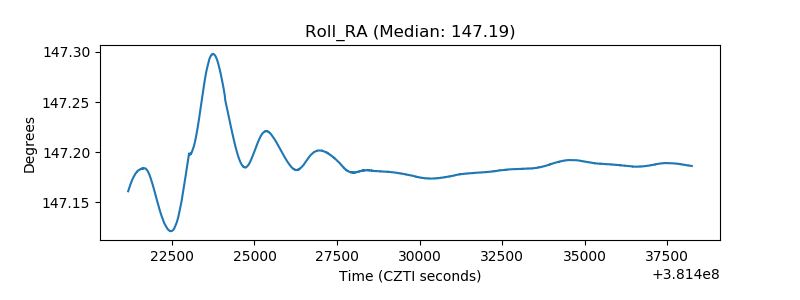 |
| Veto Counter | 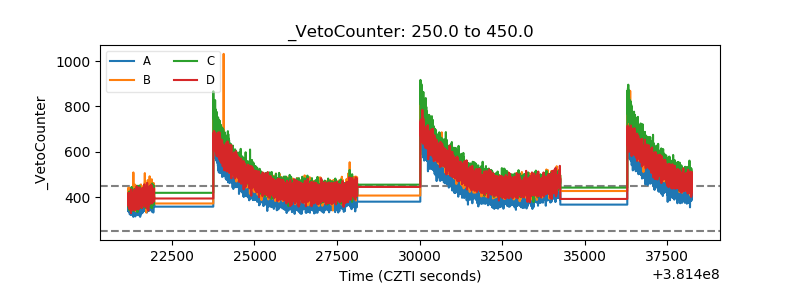 |