| Param | Original file | Final file |
|---|---|---|
| Filename | modeM0/AS1A11_091T01_9000004894_34315cztM0_level2.evt | modeM0/AS1A11_091T01_9000004894_34315cztM0_level2_quad_clean.evt |
| Size (bytes) | 473,641,920 | 48,476,160 |
| Size | 451.7 MB | 46.2 MB |
| Events in quadrant A | 1,980,227 | 300,367 |
| Events in quadrant B | 3,016,908 | 293,147 |
| Events in quadrant C | 2,182,354 | 300,169 |
| Events in quadrant D | 6,873,762 | 271,851 |
| Mode M0 | |||
|---|---|---|---|
| Quadrant | BADHDUFLAG | Total packets | Discarded packets |
| A | 0 | 8632 | 1 |
| B | 0 | 11709 | 1 |
| C | 0 | 8915 | 1 |
| D | 0 | 23416 | 1 |
| Mode M9 | |||
|---|---|---|---|
| Quadrant | BADHDUFLAG | Total packets | Discarded packets |
| A | 0 | 14 | 0 |
| B | 0 | 14 | 0 |
| C | 0 | 14 | 0 |
| D | 0 | 14 | 0 |
| Mode SS | |||
|---|---|---|---|
| Quadrant | BADHDUFLAG | Total packets | Discarded packets |
| A | 0 | 88 | 0 |
| B | 0 | 88 | 0 |
| C | 0 | 88 | 0 |
| D | 0 | 88 | 0 |
| Quadrant | Total seconds | Saturated seconds | Saturation percentage |
|---|---|---|---|
| A | 4287 | 2 | 0.046653% |
| B | 4287 | 240 | 5.598321% |
| C | 4287 | 9 | 0.209937% |
| D | 4287 | 1465 | 34.173081% |
Noise dominated data is calculated using 1-second bins in cleaned event files. If a bin has >2000 counts, and if more than 50% of those come from <1% of pixels, then it is considered to be noise-dominated and hence unusable.
| Quadrant | # 1 sec bins | Bins with >0 counts | Bins with >2000 counts | High rate bins dominated by noise | Noise dominated (total time) | Noise dominated (detector-on time) | Marked lightcurve |
|---|---|---|---|---|---|---|---|
| A | 5720 | 4288 | 0 | 0 | 0.00% | 0.00% | 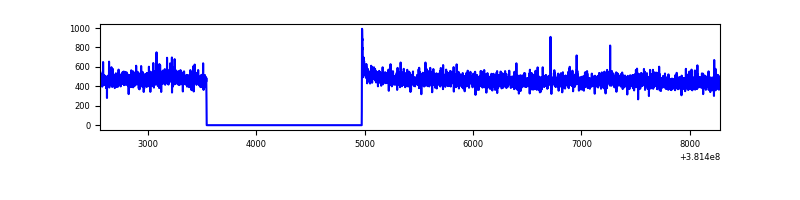 |
| B | 5720 | 4288 | 157 | 157 | 2.74% | 3.66% | 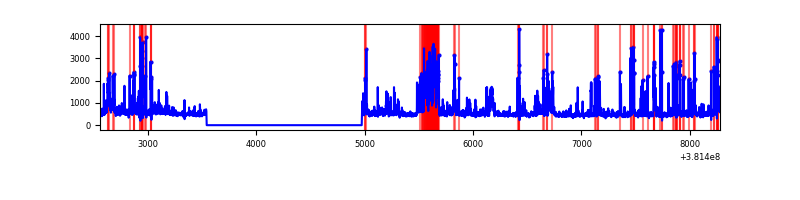 |
| C | 5720 | 4288 | 6 | 6 | 0.10% | 0.14% | 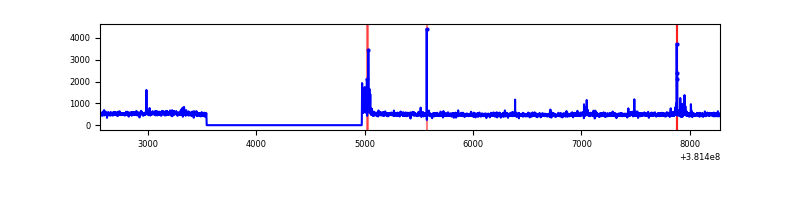 |
| D | 5720 | 4288 | 1251 | 1251 | 21.87% | 29.17% | 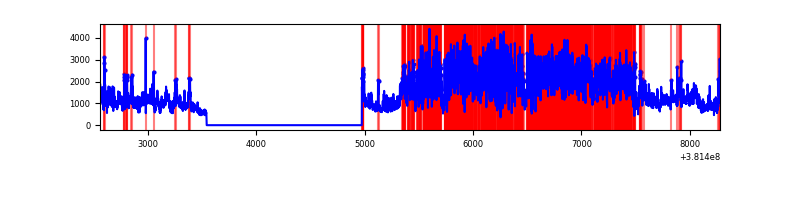 |
Top three noisy pixels from each quadrant. If the there are fewer than three noisy pixels in the level2.evt file, extra rows are filled as -1
| Pixel properties | Quadrant properties | ||||||
|---|---|---|---|---|---|---|---|
| Quadrant | DetID | PixID | Counts | Sigma | Mean | Median | Sigma |
| A | 13 | 6 | 19560 | 186.56 | 502 | 490 | 102.2 |
| A | 10 | 83 | 15895 | 150.7 | 502 | 490 | 102.2 |
| A | 13 | 254 | 7402 | 67.62 | 502 | 490 | 102.2 |
| B | 5 | 172 | 844098 | 8776.44 | 489 | 476 | 96.1 |
| B | 5 | 255 | 81000 | 837.71 | 489 | 476 | 96.1 |
| B | 4 | 251 | 50895 | 524.52 | 489 | 476 | 96.1 |
| C | 15 | 214 | 178603 | 1553.08 | 488 | 491 | 114.7 |
| C | 0 | 10 | 45351 | 391.16 | 488 | 491 | 114.7 |
| C | 14 | 254 | 18661 | 158.44 | 488 | 491 | 114.7 |
| D | 12 | 227 | 1998476 | 18483.87 | 435 | 423 | 108.1 |
| D | 7 | 223 | 1307113 | 12088.11 | 435 | 423 | 108.1 |
| D | 8 | 195 | 584920 | 5407.15 | 435 | 423 | 108.1 |
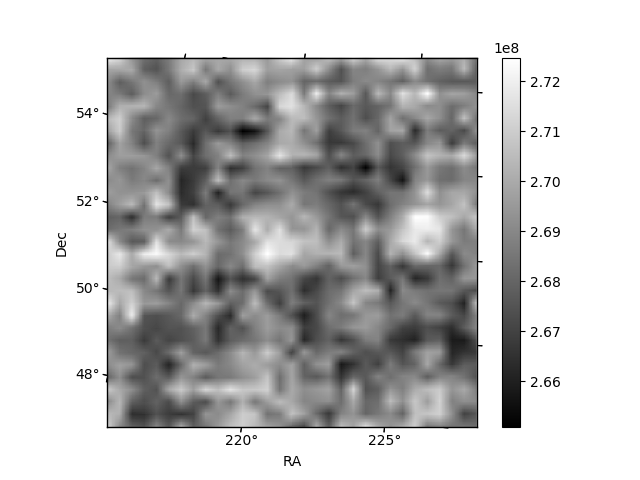
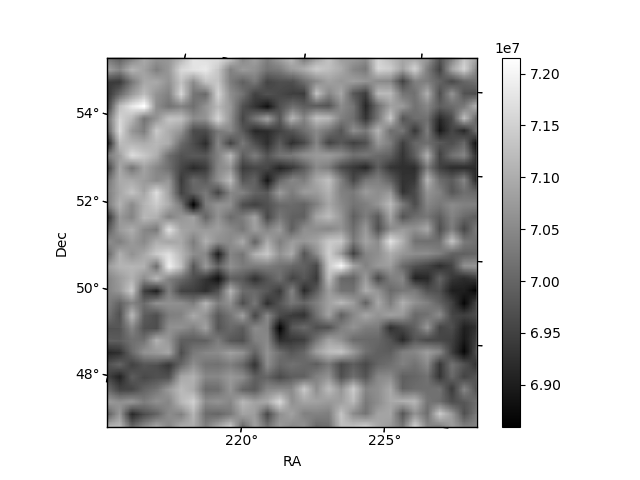
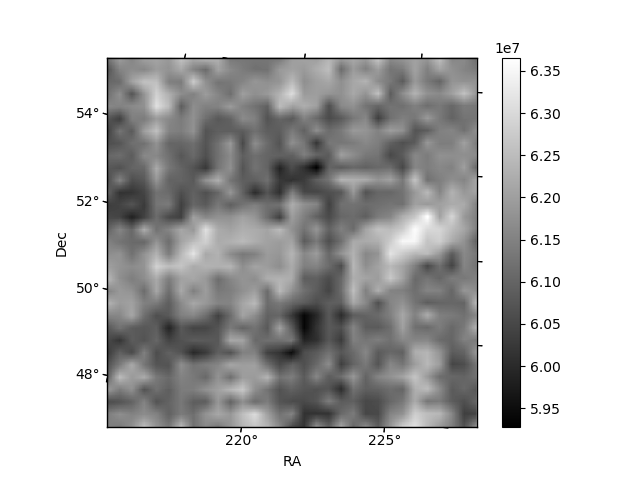
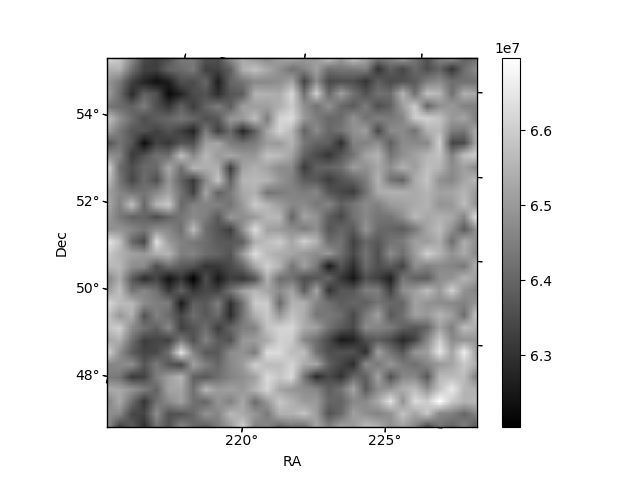
Histogram calculated using DETX and DETY for each event in the final _common_clean file
| Quadrant A | 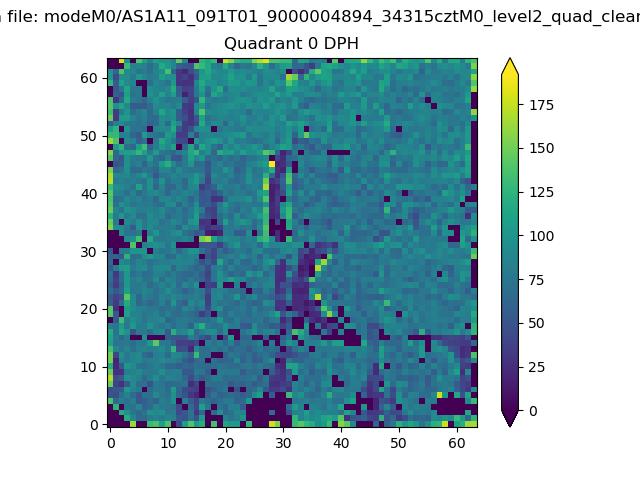 |
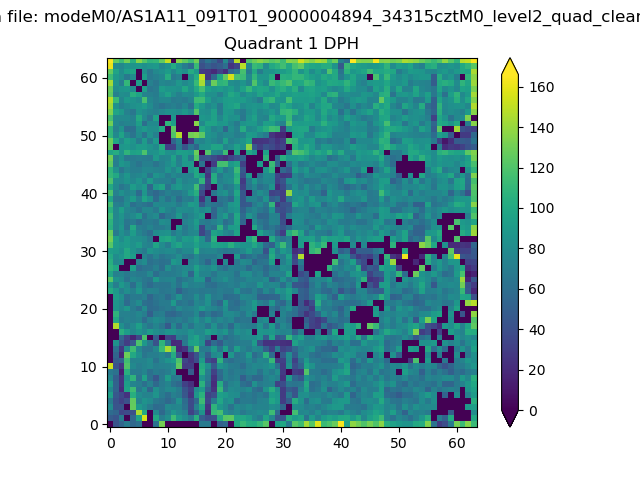 |
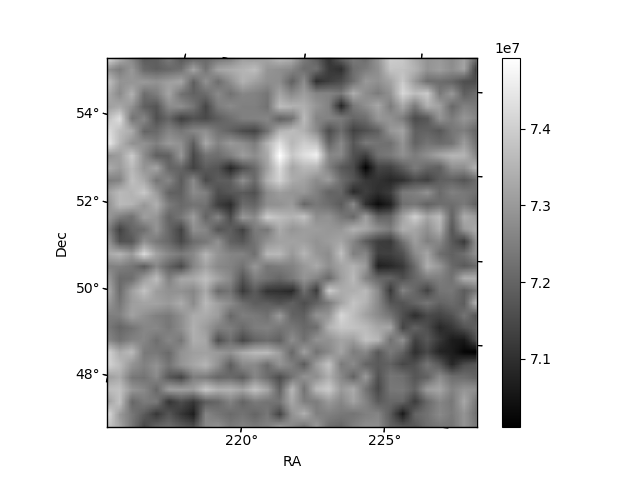
Quadrant B |
|---|---|---|---|
| Quadrant D | 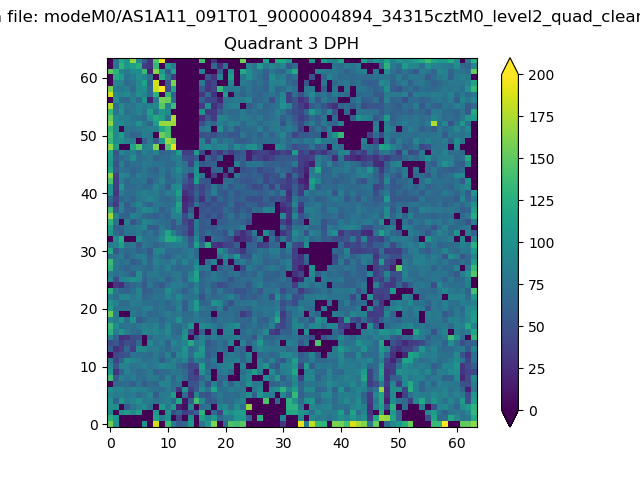 |
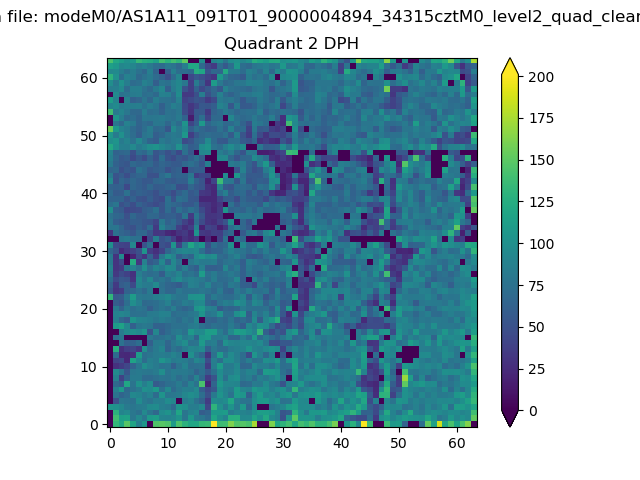 |
Quadrant C |
| Plot type | Count rate plots | Images |
|---|---|---|
| Comparison with Poisson distribution Blue bars denote a histogram of data divided into 1 sec bins. Red curve is a Poisson curve with rate = median count rate of data. |
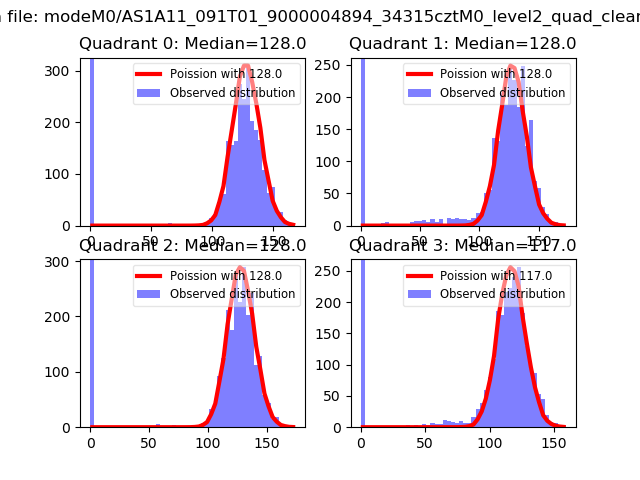 |
 |
| Quadrant-wise count rates Data is divided into 100 sec bins |
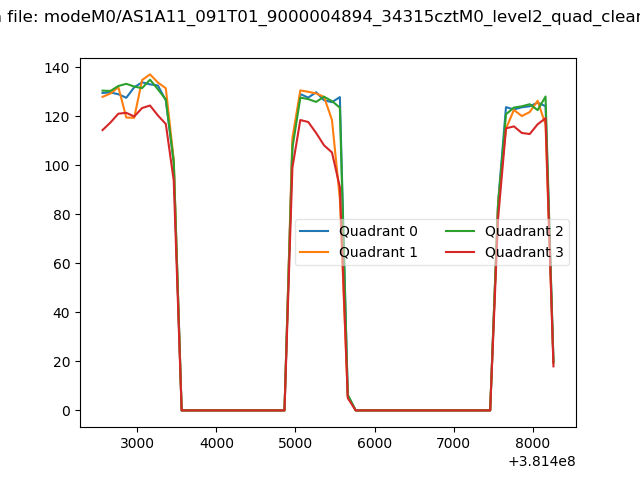 |
|
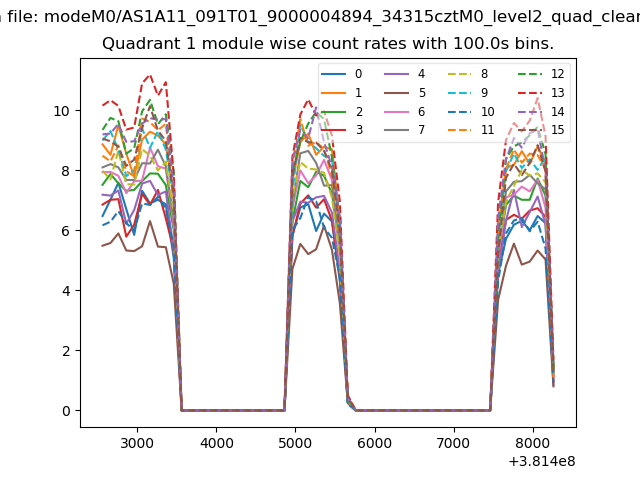
| Module-wise count rates for Quadrant A Data is divided into 100 sec bins |
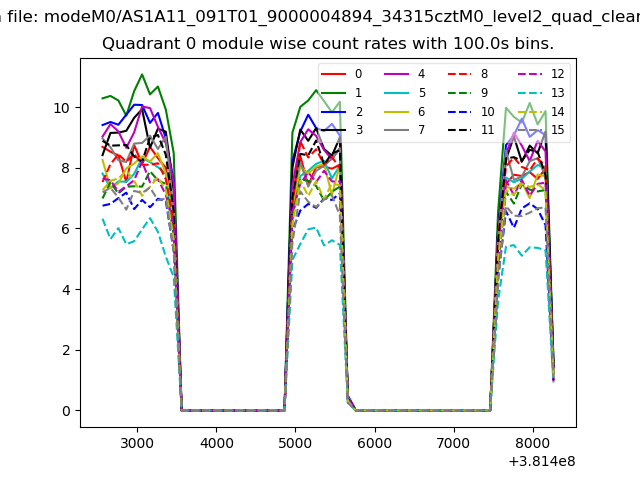 |
 |
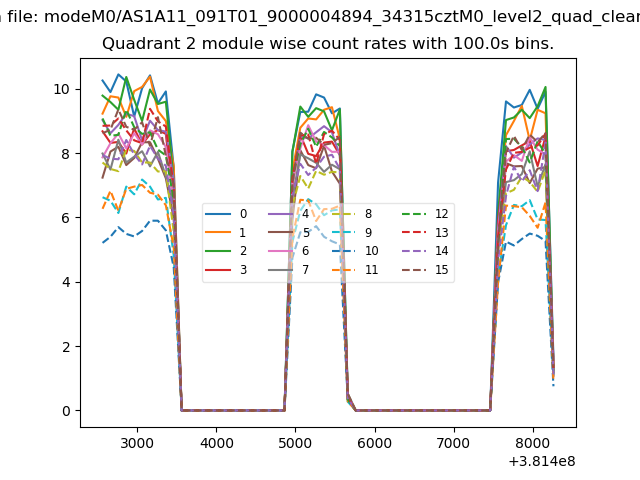
| Module-wise count rates for Quadrant B Data is divided into 100 sec bins |
 |
 |
| Module-wise count rates for Quadrant C Data is divided into 100 sec bins |
 |
 |
| Module-wise count rates for Quadrant D Data is divided into 100 sec bins |
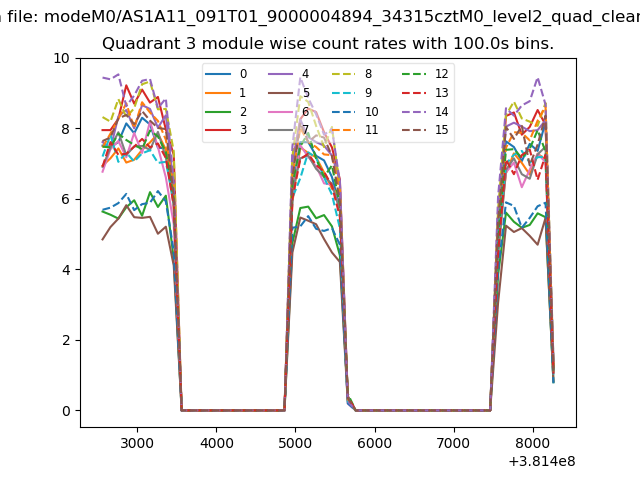 |
 |
| Parameter | Plot |
|---|---|
| CZT HV Monitor | 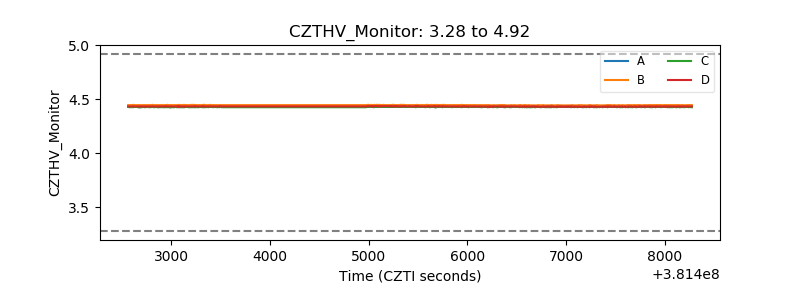 |
| D_VDD | 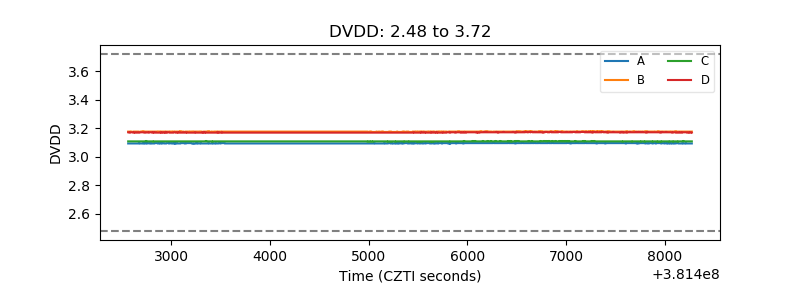 |
| Temperature 1 | 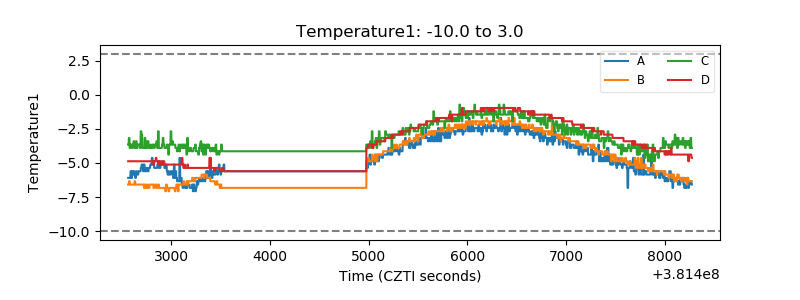 |
| Veto HV Monitor | 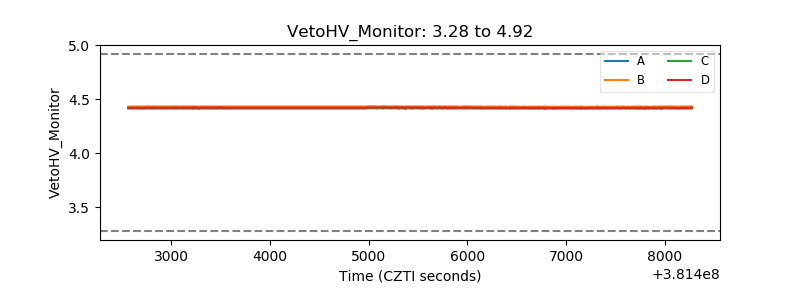 |
| Veto LLD | 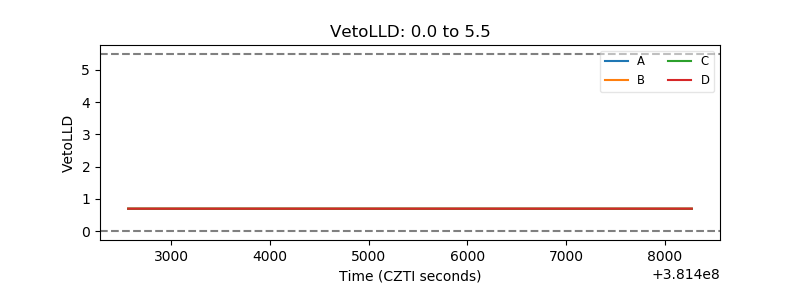 |
| Alpha Counter |  |
| _CPM_Rate | 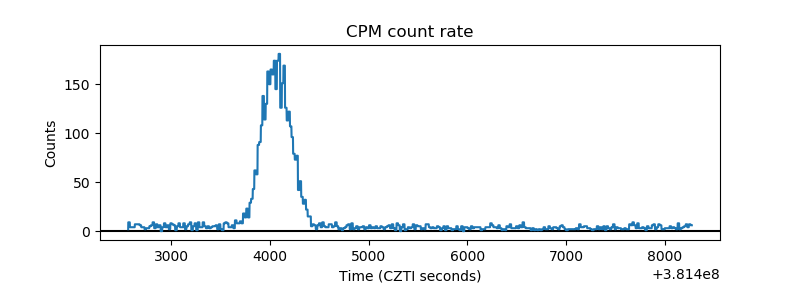 |
| CZT Counter | 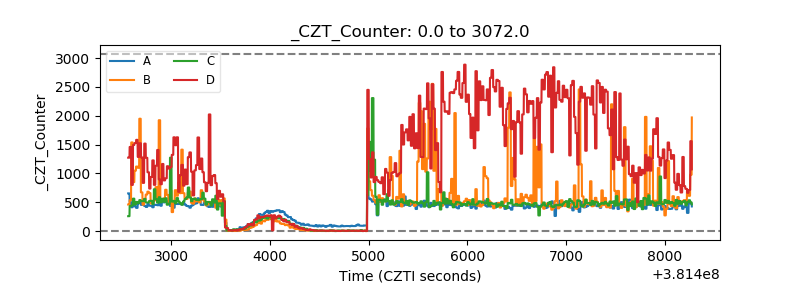 |
| +2.5 Volts monitor | 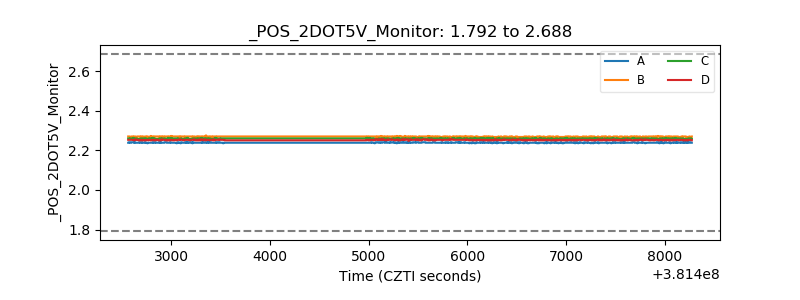 |
| +5 Volts monitor | 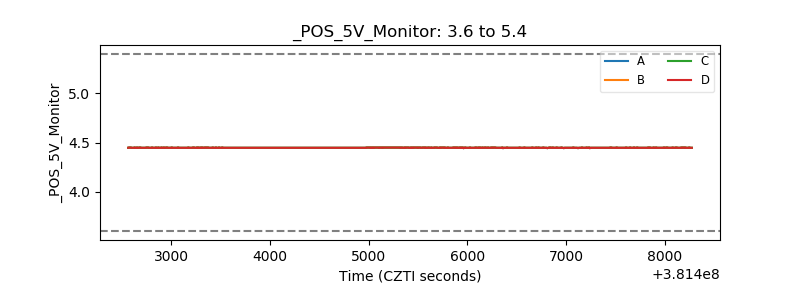 |
| _ROLL_ROT | 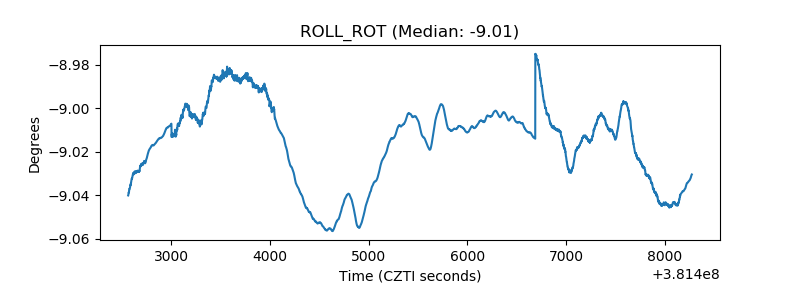 |
| _Roll_DEC | 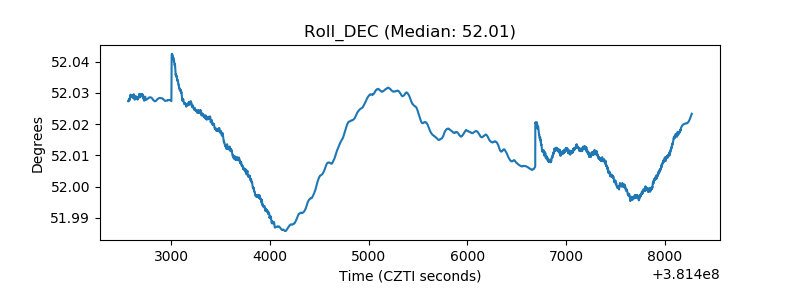 |
| _Roll_RA | 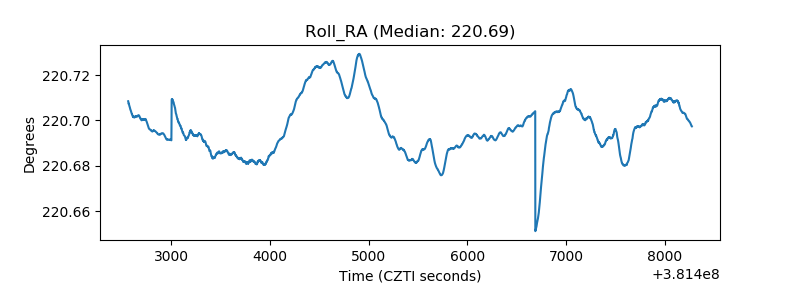 |
| Veto Counter | 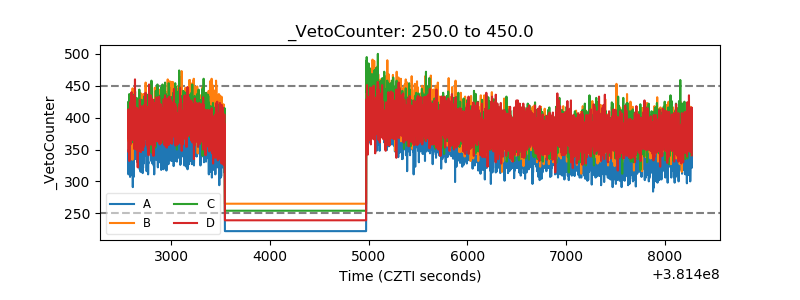 |