| Param | Original file | Final file |
|---|---|---|
| Filename | modeM0/AS1A11_091T01_9000004894_34310cztM0_level2.evt | modeM0/AS1A11_091T01_9000004894_34310cztM0_level2_quad_clean.evt |
| Size (bytes) | 504,472,320 | 74,315,520 |
| Size | 481.1 MB | 70.9 MB |
| Events in quadrant A | 2,614,631 | 467,974 |
| Events in quadrant B | 4,044,862 | 474,349 |
| Events in quadrant C | 2,899,263 | 472,063 |
| Events in quadrant D | 5,332,576 | 436,821 |
| Mode M0 | |||
|---|---|---|---|
| Quadrant | BADHDUFLAG | Total packets | Discarded packets |
| A | 0 | 11688 | 10 |
| B | 0 | 15923 | 11 |
| C | 0 | 12148 | 11 |
| D | 0 | 19897 | 76 |
| Mode M9 | |||
|---|---|---|---|
| Quadrant | BADHDUFLAG | Total packets | Discarded packets |
| A | 0 | 36 | 0 |
| B | 0 | 36 | 0 |
| C | 0 | 36 | 0 |
| D | 0 | 36 | 0 |
| Mode SS | |||
|---|---|---|---|
| Quadrant | BADHDUFLAG | Total packets | Discarded packets |
| A | 0 | 118 | 0 |
| B | 0 | 118 | 0 |
| C | 0 | 118 | 0 |
| D | 0 | 118 | 0 |
| Quadrant | Total seconds | Saturated seconds | Saturation percentage |
|---|---|---|---|
| A | 5708 | 13 | 0.227751% |
| B | 5709 | 195 | 3.415659% |
| C | 5707 | 34 | 0.595760% |
| D | 5698 | 379 | 6.651457% |
Noise dominated data is calculated using 1-second bins in cleaned event files. If a bin has >2000 counts, and if more than 50% of those come from <1% of pixels, then it is considered to be noise-dominated and hence unusable.
| Quadrant | # 1 sec bins | Bins with >0 counts | Bins with >2000 counts | High rate bins dominated by noise | Noise dominated (total time) | Noise dominated (detector-on time) | Marked lightcurve |
|---|---|---|---|---|---|---|---|
| A | 9267 | 5714 | 9 | 9 | 0.10% | 0.16% | 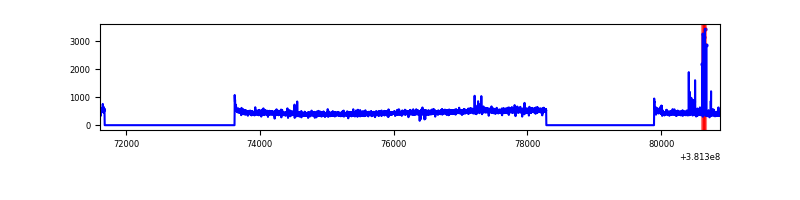 |
| B | 9267 | 5714 | 117 | 117 | 1.26% | 2.05% | 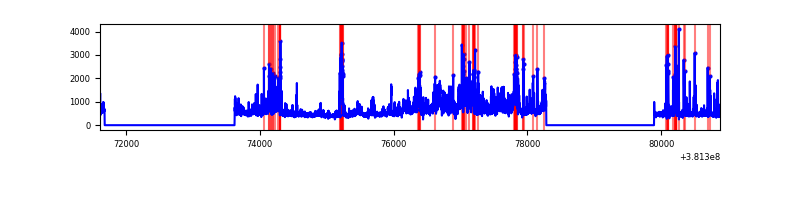 |
| C | 9267 | 5714 | 22 | 22 | 0.24% | 0.39% | 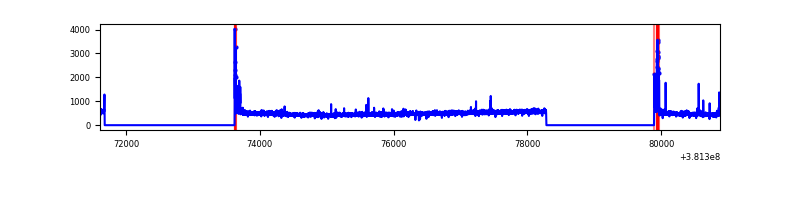 |
| D | 9267 | 5713 | 339 | 339 | 3.66% | 5.93% | 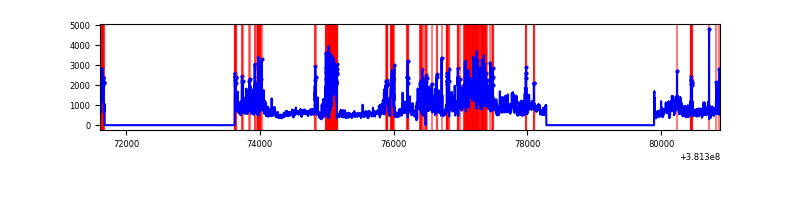 |
Top three noisy pixels from each quadrant. If the there are fewer than three noisy pixels in the level2.evt file, extra rows are filled as -1
| Pixel properties | Quadrant properties | ||||||
|---|---|---|---|---|---|---|---|
| Quadrant | DetID | PixID | Counts | Sigma | Mean | Median | Sigma |
| A | 9 | 191 | 56609 | 433.3 | 649 | 638 | 129.2 |
| A | 10 | 83 | 27861 | 210.75 | 649 | 638 | 129.2 |
| A | 13 | 6 | 15063 | 111.67 | 649 | 638 | 129.2 |
| B | 5 | 31 | 649187 | 5314.18 | 642 | 626 | 122.0 |
| B | 5 | 172 | 374074 | 3059.96 | 642 | 626 | 122.0 |
| B | 5 | 15 | 143748 | 1172.71 | 642 | 626 | 122.0 |
| C | 15 | 214 | 242766 | 1668.03 | 631 | 637 | 145.2 |
| C | 0 | 10 | 128512 | 880.93 | 631 | 637 | 145.2 |
| C | 14 | 67 | 26869 | 180.71 | 631 | 637 | 145.2 |
| D | 10 | 118 | 735089 | 4448.89 | 610 | 597 | 165.1 |
| D | 12 | 235 | 693020 | 4194.07 | 610 | 597 | 165.1 |
| D | 8 | 195 | 635373 | 3844.9 | 610 | 597 | 165.1 |
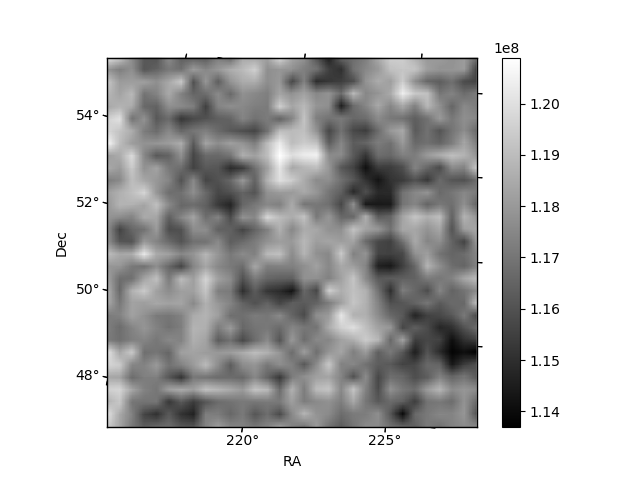
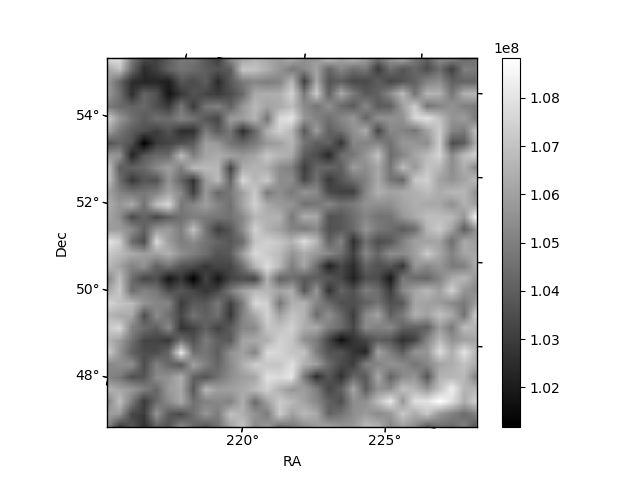
Histogram calculated using DETX and DETY for each event in the final _common_clean file
| Quadrant A | 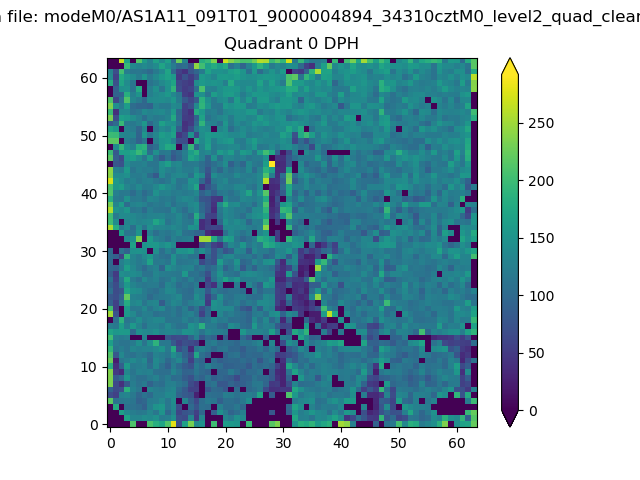 |
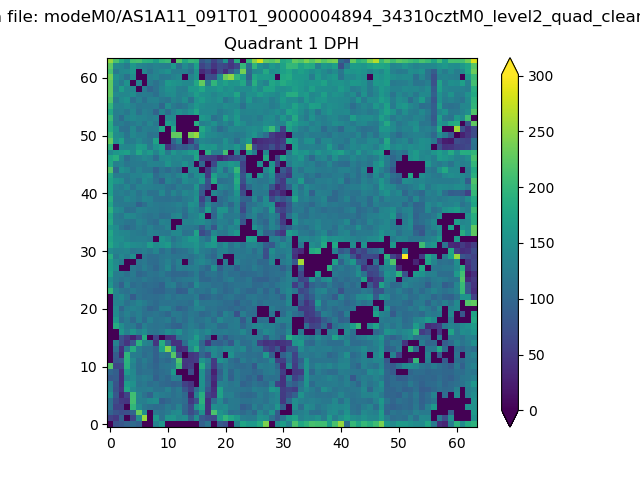 |
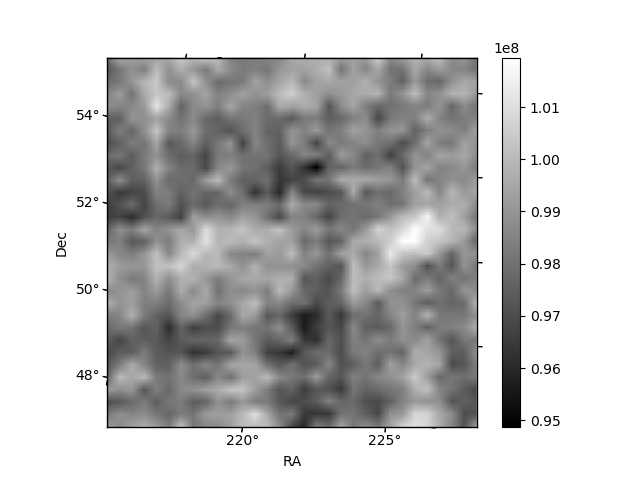
Quadrant B |
|---|---|---|---|
| Quadrant D | 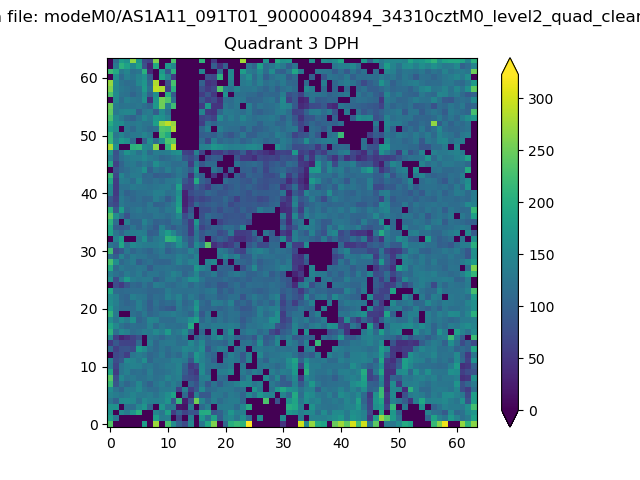 |
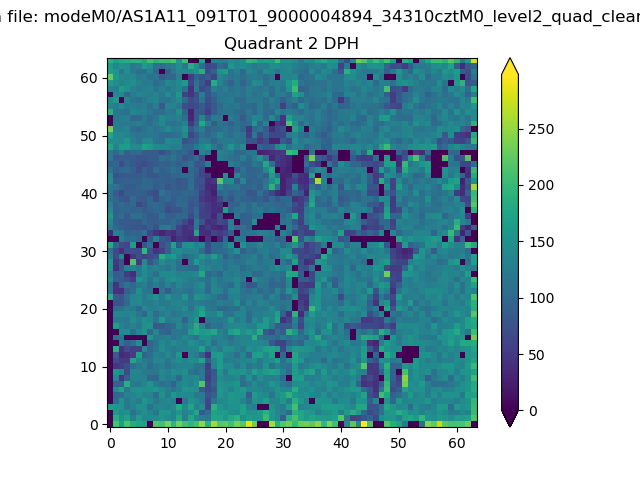 |
Quadrant C |
| Plot type | Count rate plots | Images |
|---|---|---|
| Comparison with Poisson distribution Blue bars denote a histogram of data divided into 1 sec bins. Red curve is a Poisson curve with rate = median count rate of data. |
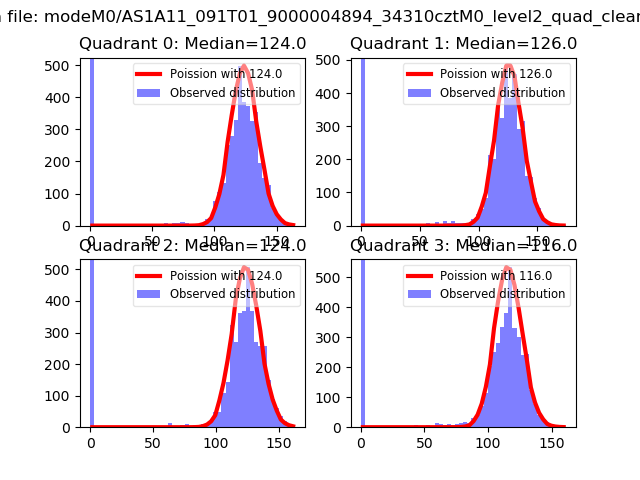 |
 |
| Quadrant-wise count rates Data is divided into 100 sec bins |
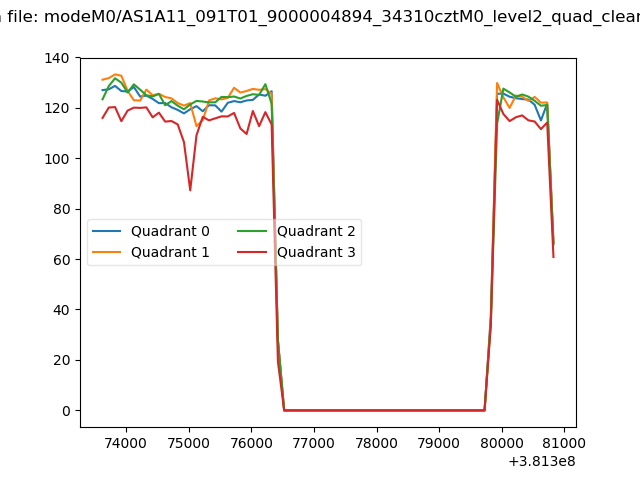 |
|
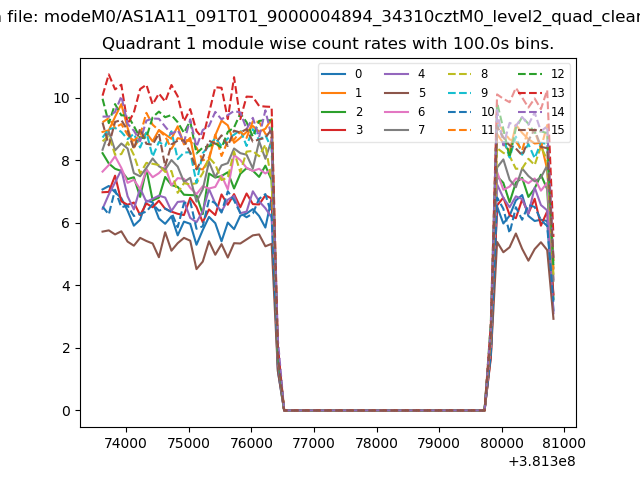
| Module-wise count rates for Quadrant A Data is divided into 100 sec bins |
 |
 |
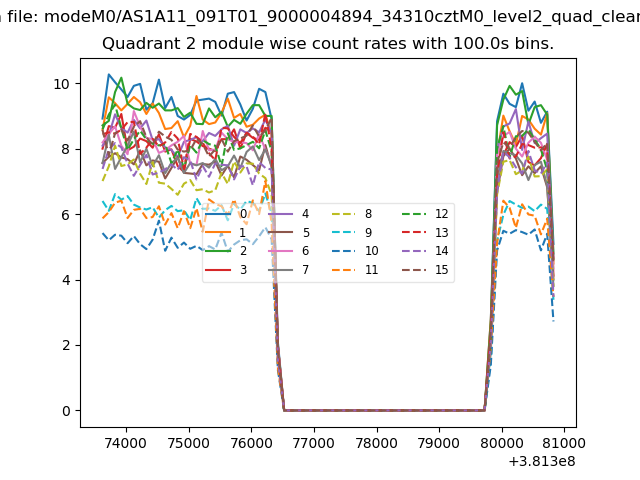
| Module-wise count rates for Quadrant B Data is divided into 100 sec bins |
 |
 |
| Module-wise count rates for Quadrant C Data is divided into 100 sec bins |
 |
 |
| Module-wise count rates for Quadrant D Data is divided into 100 sec bins |
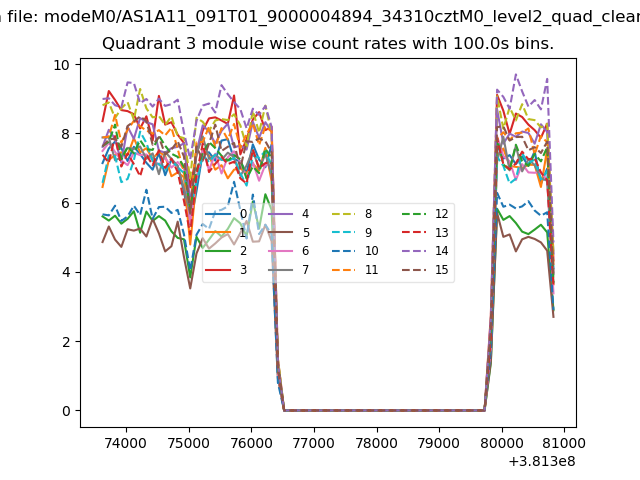 |
 |
| Parameter | Plot |
|---|---|
| CZT HV Monitor | 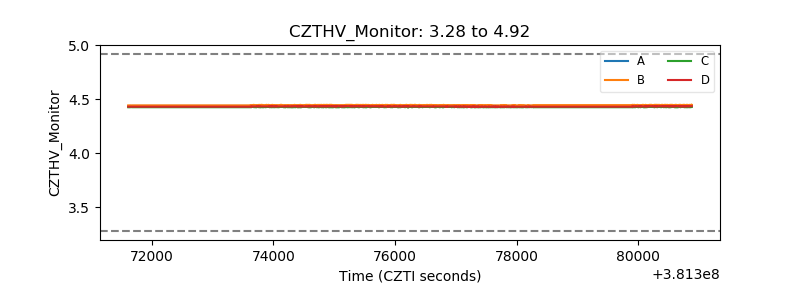 |
| D_VDD | 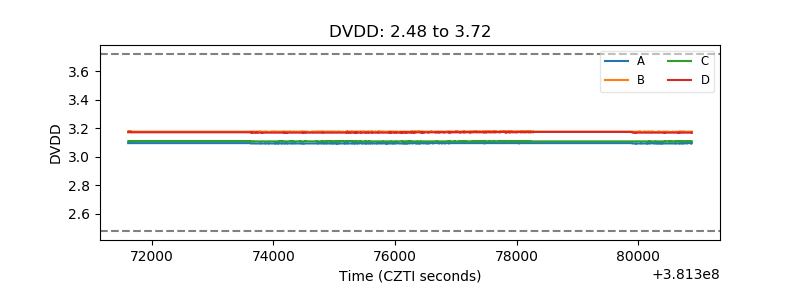 |
| Temperature 1 | 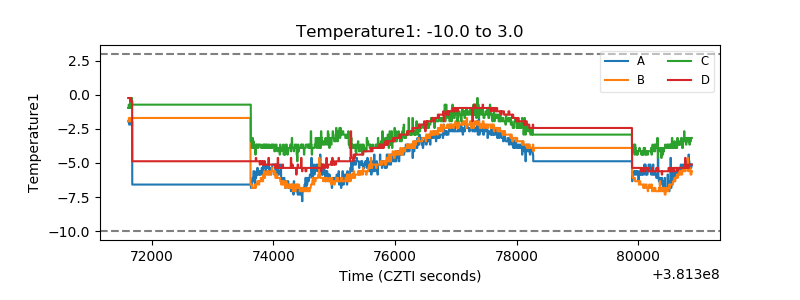 |
| Veto HV Monitor | 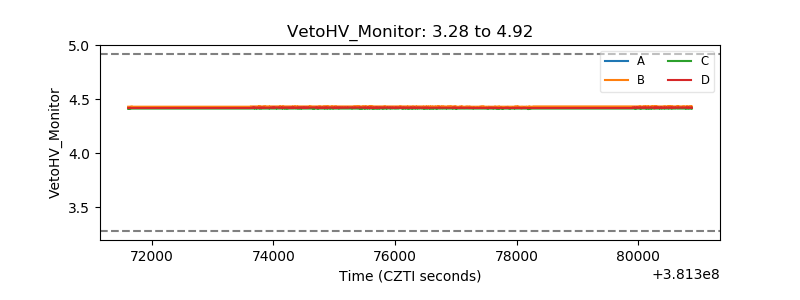 |
| Veto LLD | 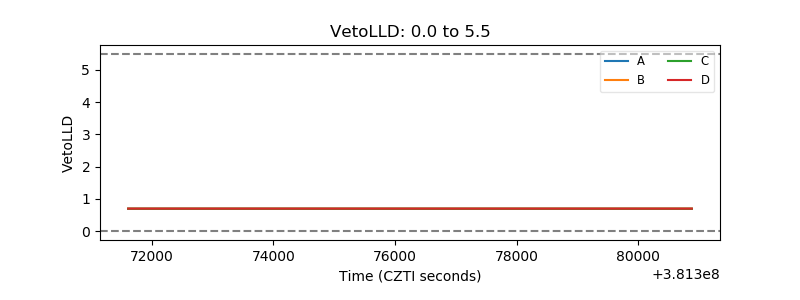 |
| Alpha Counter | 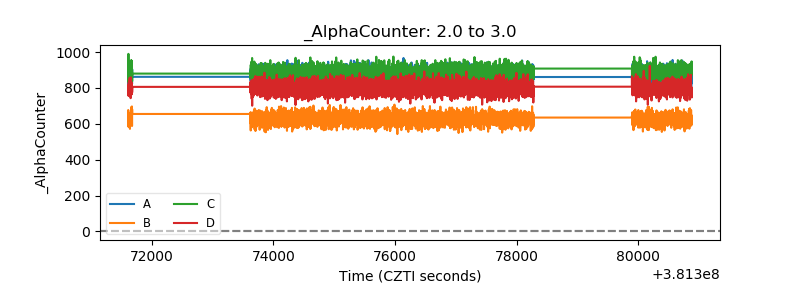 |
| _CPM_Rate | 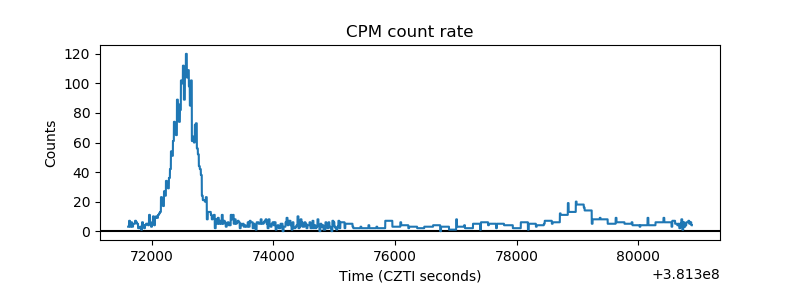 |
| CZT Counter | 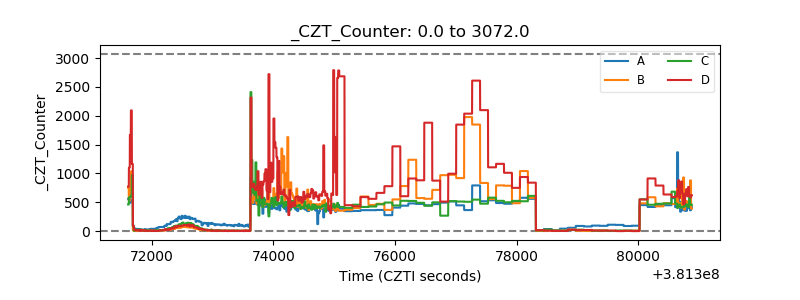 |
| +2.5 Volts monitor | 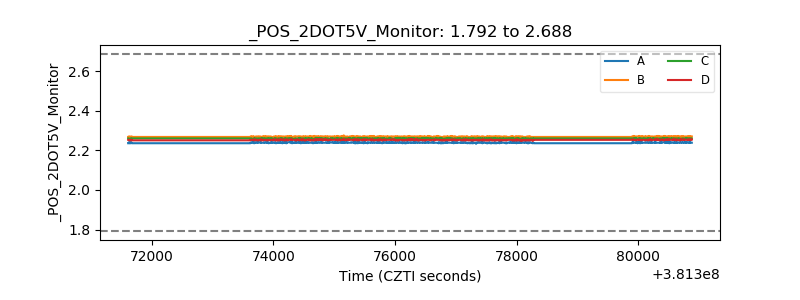 |
| +5 Volts monitor | 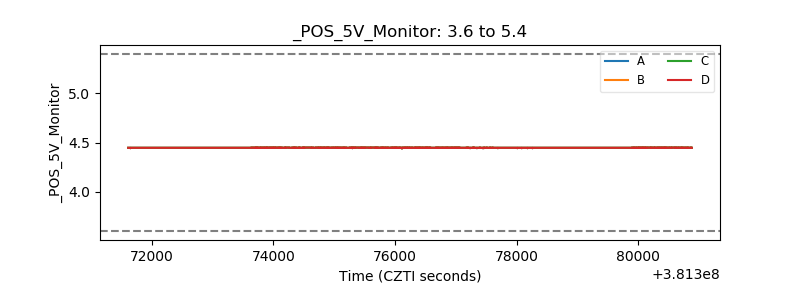 |
| _ROLL_ROT | 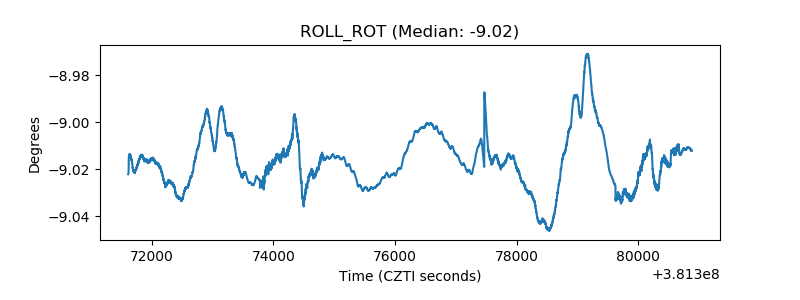 |
| _Roll_DEC | 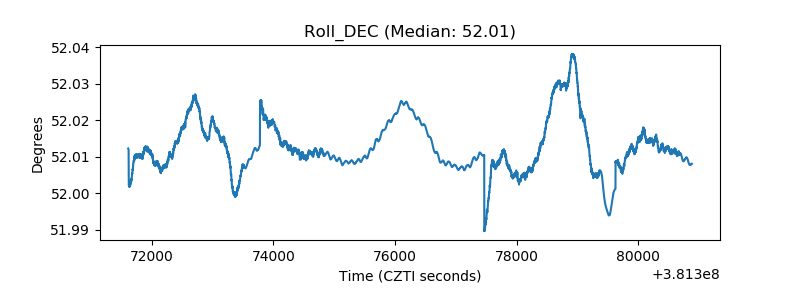 |
| _Roll_RA | 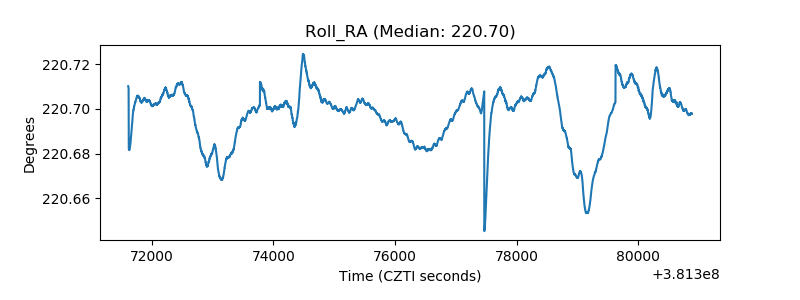 |
| Veto Counter | 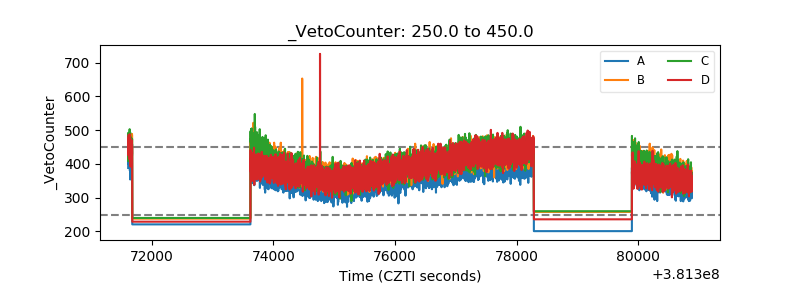 |