| Param | Original file | Final file |
|---|---|---|
| Filename | modeM0/AS1A11_047T07_9000004892_34305cztM0_level2.evt | modeM0/AS1A11_047T07_9000004892_34305cztM0_level2_quad_clean.evt |
| Size (bytes) | 472,170,240 | 62,029,440 |
| Size | 450.3 MB | 59.2 MB |
| Events in quadrant A | 2,885,660 | 382,289 |
| Events in quadrant B | 3,466,885 | 381,708 |
| Events in quadrant C | 3,021,528 | 389,920 |
| Events in quadrant D | 4,575,715 | 362,184 |
| Mode M0 | |||
|---|---|---|---|
| Quadrant | BADHDUFLAG | Total packets | Discarded packets |
| A | 0 | 11829 | 3 |
| B | 0 | 13722 | 2 |
| C | 0 | 12213 | 2 |
| D | 0 | 17269 | 2 |
| Mode M9 | |||
|---|---|---|---|
| Quadrant | BADHDUFLAG | Total packets | Discarded packets |
| A | 0 | 28 | 0 |
| B | 0 | 28 | 0 |
| C | 0 | 28 | 0 |
| D | 0 | 29 | 0 |
| Mode SS | |||
|---|---|---|---|
| Quadrant | BADHDUFLAG | Total packets | Discarded packets |
| A | 0 | 106 | 0 |
| B | 0 | 106 | 0 |
| C | 0 | 106 | 0 |
| D | 0 | 106 | 0 |
| Quadrant | Total seconds | Saturated seconds | Saturation percentage |
|---|---|---|---|
| A | 5163 | 30 | 0.581058% |
| B | 5163 | 126 | 2.440442% |
| C | 5163 | 35 | 0.677900% |
| D | 5163 | 306 | 5.926787% |
Noise dominated data is calculated using 1-second bins in cleaned event files. If a bin has >2000 counts, and if more than 50% of those come from <1% of pixels, then it is considered to be noise-dominated and hence unusable.
| Quadrant | # 1 sec bins | Bins with >0 counts | Bins with >2000 counts | High rate bins dominated by noise | Noise dominated (total time) | Noise dominated (detector-on time) | Marked lightcurve |
|---|---|---|---|---|---|---|---|
| A | 7166 | 5164 | 13 | 13 | 0.18% | 0.25% | 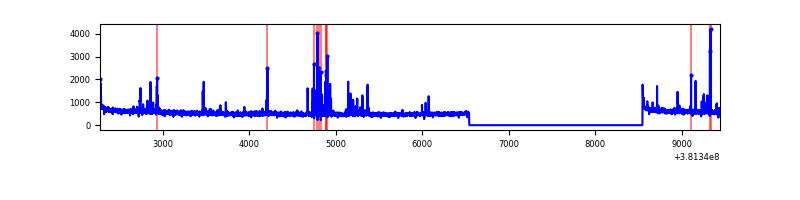 |
| B | 7166 | 5164 | 72 | 72 | 1.00% | 1.39% | 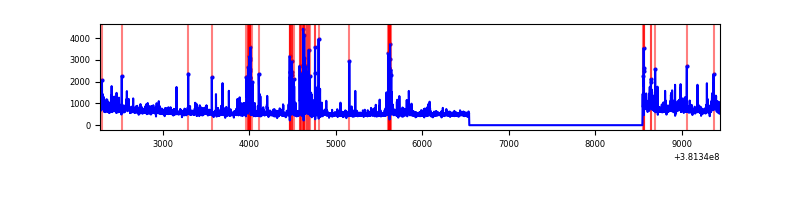 |
| C | 7166 | 5164 | 11 | 11 | 0.15% | 0.21% |  |
| D | 7166 | 5164 | 188 | 188 | 2.62% | 3.64% | 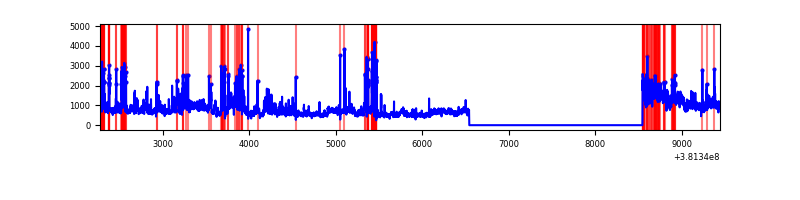 |
Top three noisy pixels from each quadrant. If the there are fewer than three noisy pixels in the level2.evt file, extra rows are filled as -1
| Pixel properties | Quadrant properties | ||||||
|---|---|---|---|---|---|---|---|
| Quadrant | DetID | PixID | Counts | Sigma | Mean | Median | Sigma |
| A | 7 | 16 | 159982 | 1171.18 | 684 | 674 | 136.0 |
| A | 9 | 143 | 33970 | 244.78 | 684 | 674 | 136.0 |
| A | 10 | 83 | 30248 | 217.42 | 684 | 674 | 136.0 |
| B | 5 | 172 | 351992 | 2755.48 | 680 | 667 | 127.5 |
| B | 0 | 229 | 135524 | 1057.7 | 680 | 667 | 127.5 |
| B | 4 | 251 | 113155 | 882.25 | 680 | 667 | 127.5 |
| C | 15 | 214 | 220436 | 1414.01 | 678 | 684 | 155.4 |
| C | 0 | 10 | 89895 | 574.03 | 678 | 684 | 155.4 |
| C | 14 | 254 | 40851 | 258.46 | 678 | 684 | 155.4 |
| D | 8 | 195 | 525558 | 3204.01 | 657 | 644 | 163.8 |
| D | 7 | 223 | 379247 | 2310.94 | 657 | 644 | 163.8 |
| D | 1 | 52 | 298013 | 1815.1 | 657 | 644 | 163.8 |
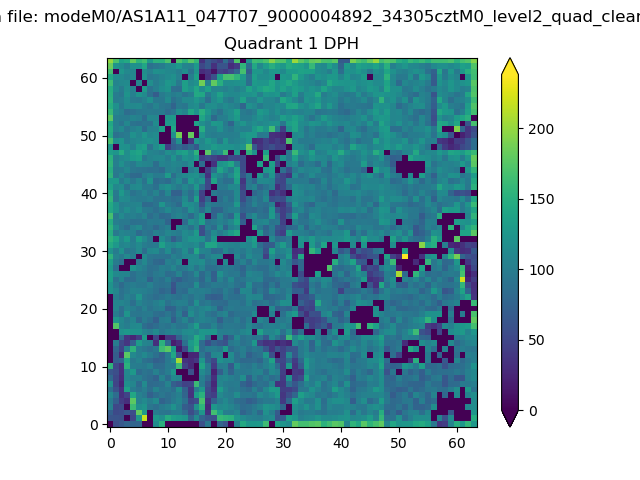
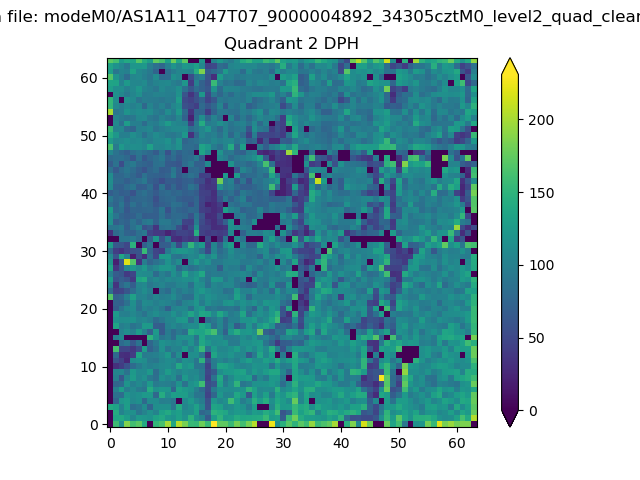
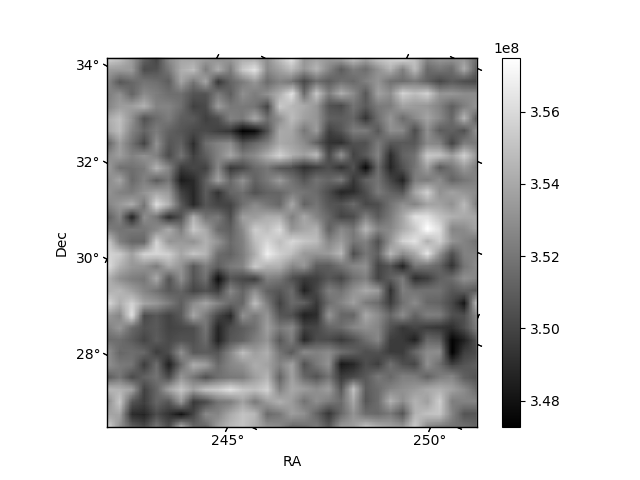
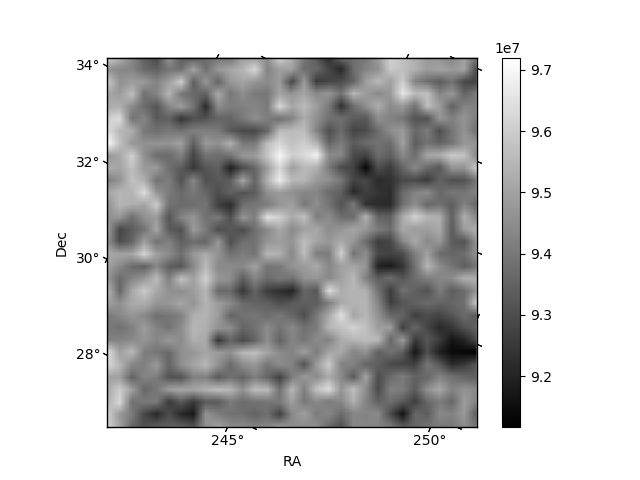
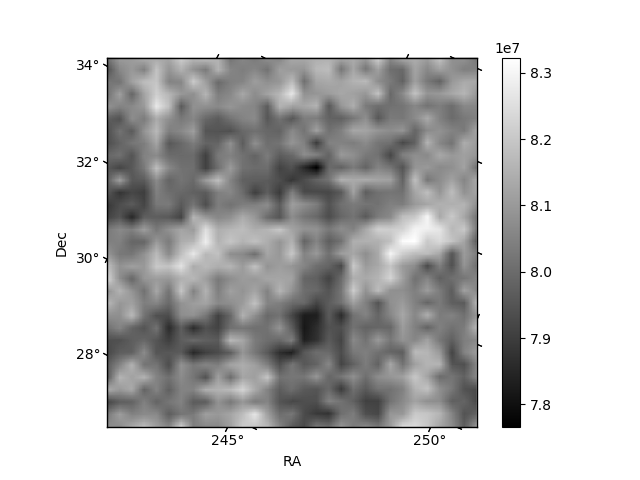
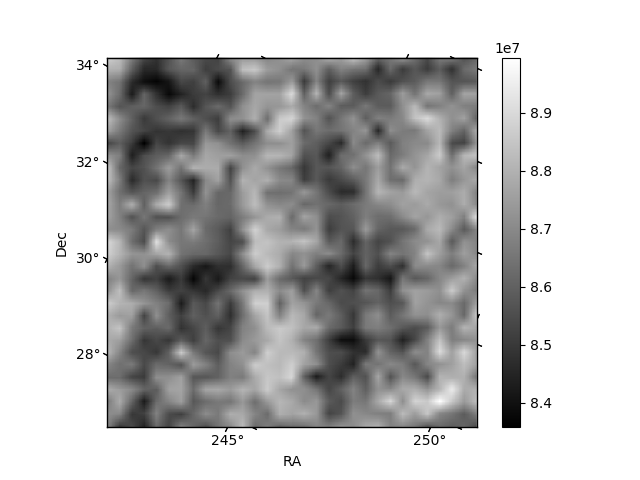
Histogram calculated using DETX and DETY for each event in the final _common_clean file
| Quadrant A | 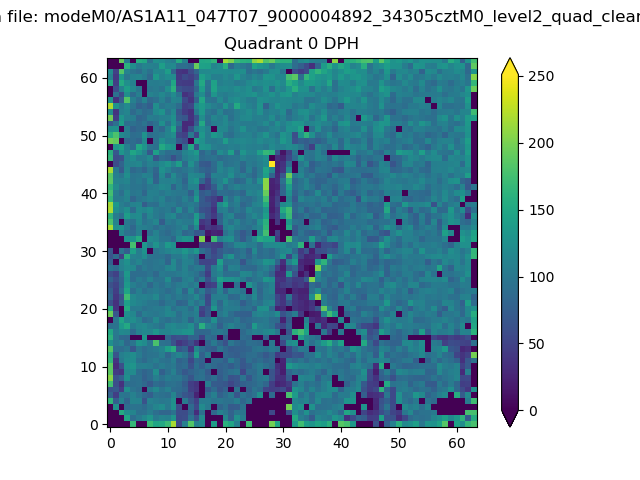 |
 |
Quadrant B |
|---|---|---|---|
| Quadrant D | 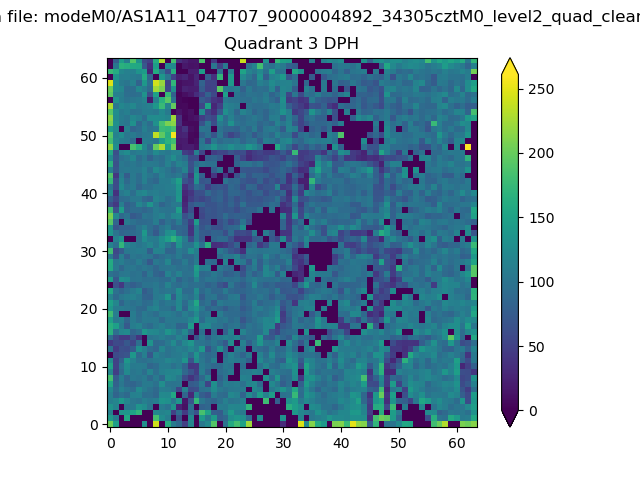 |
 |
Quadrant C |
| Plot type | Count rate plots | Images |
|---|---|---|
| Comparison with Poisson distribution Blue bars denote a histogram of data divided into 1 sec bins. Red curve is a Poisson curve with rate = median count rate of data. |
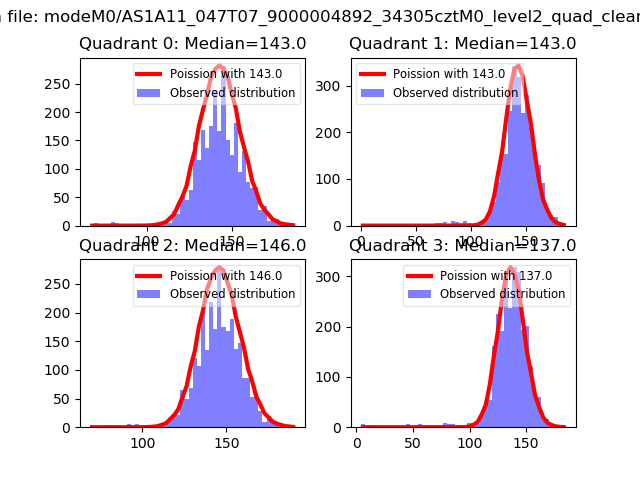 |
 |
| Quadrant-wise count rates Data is divided into 100 sec bins |
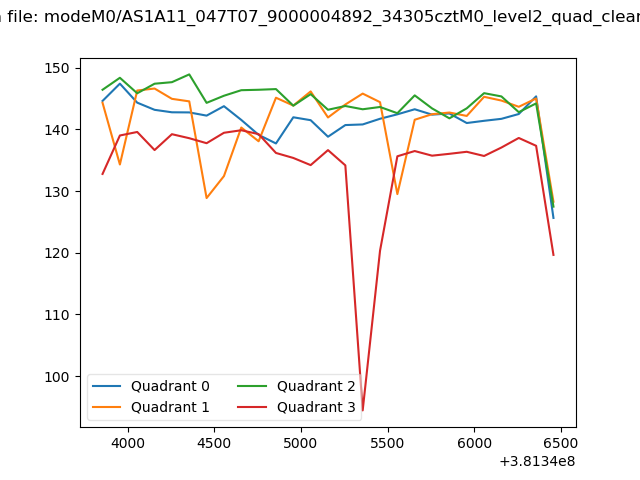 |
|
| Module-wise count rates for Quadrant A Data is divided into 100 sec bins |
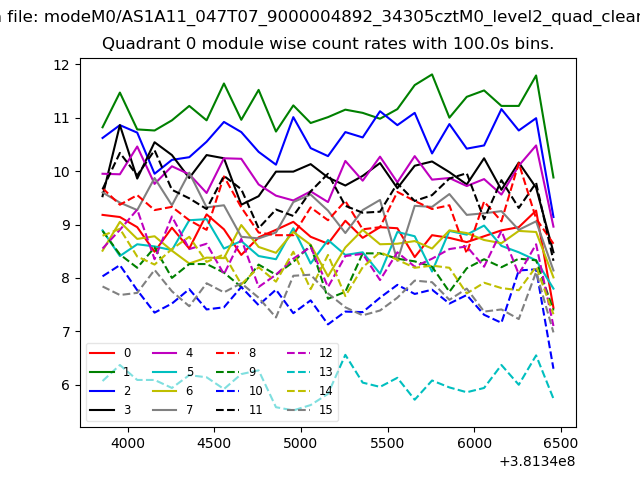 |
 |
| Module-wise count rates for Quadrant B Data is divided into 100 sec bins |
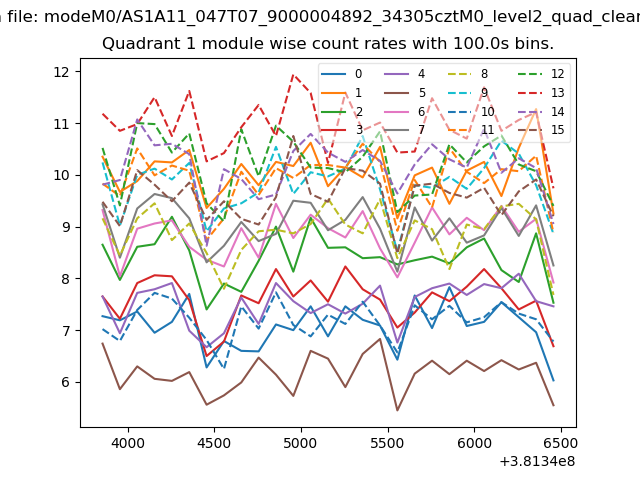 |
 |
| Module-wise count rates for Quadrant C Data is divided into 100 sec bins |
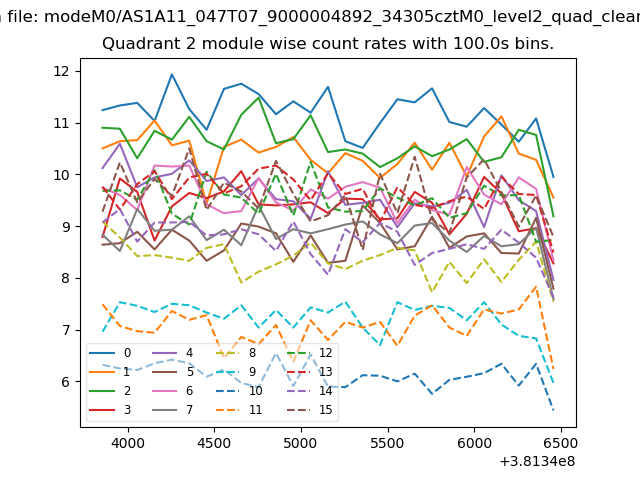 |
 |
| Module-wise count rates for Quadrant D Data is divided into 100 sec bins |
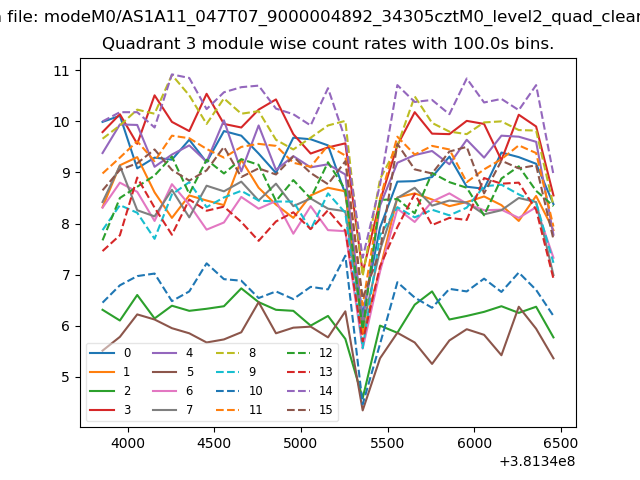 |
 |
| Parameter | Plot |
|---|---|
| CZT HV Monitor | 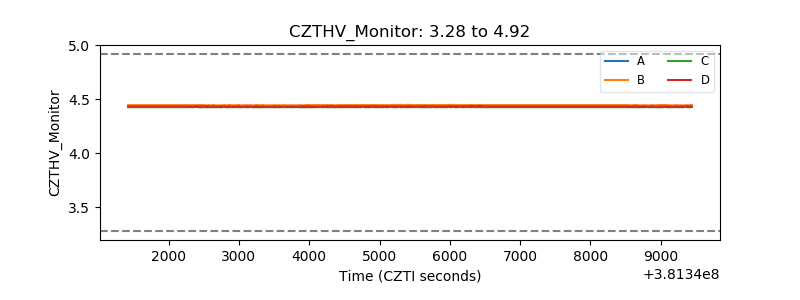 |
| D_VDD | 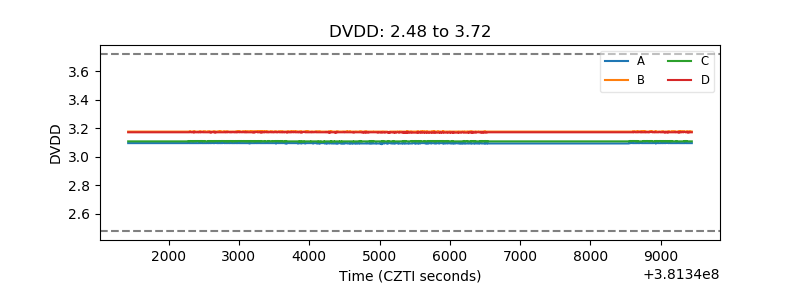 |
| Temperature 1 | 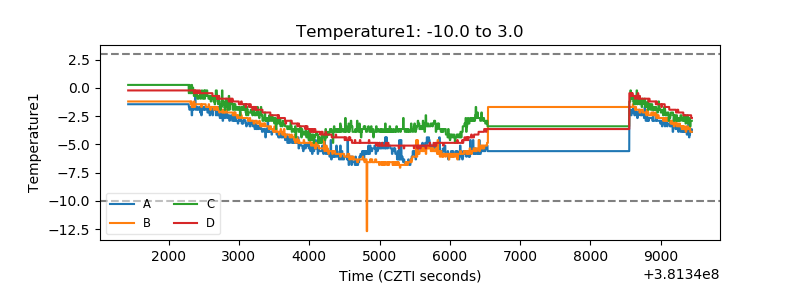 |
| Veto HV Monitor | 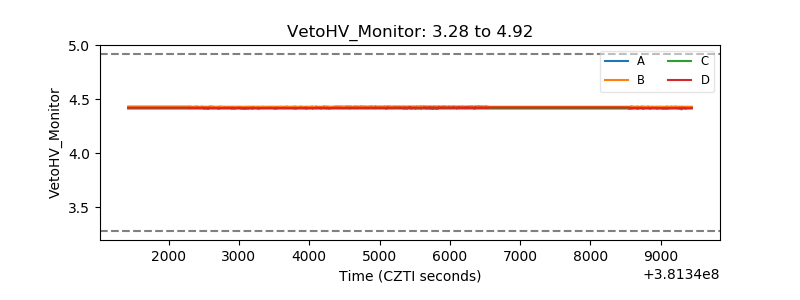 |
| Veto LLD | 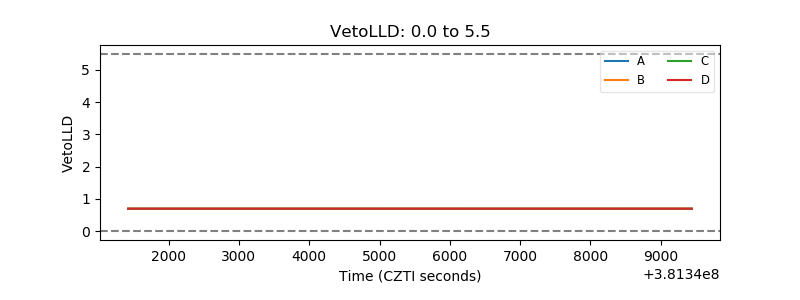 |
| Alpha Counter | 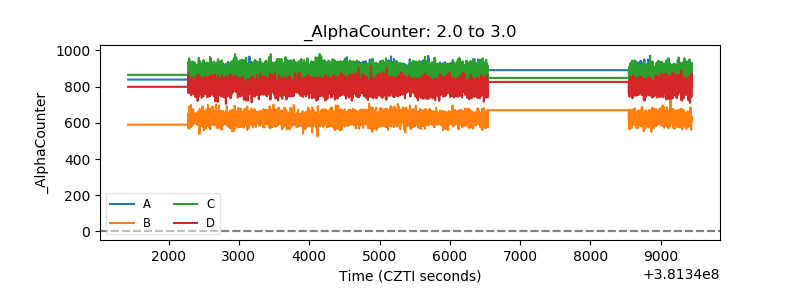 |
| _CPM_Rate | 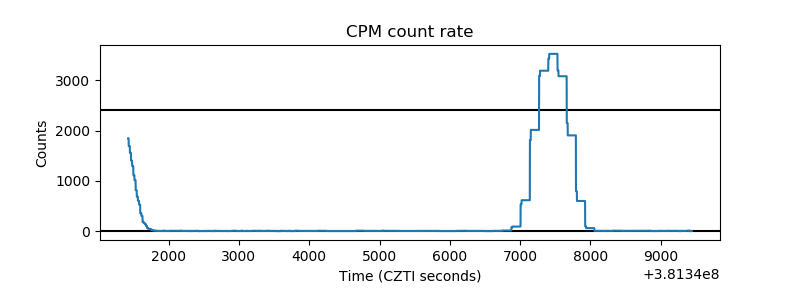 |
| CZT Counter | 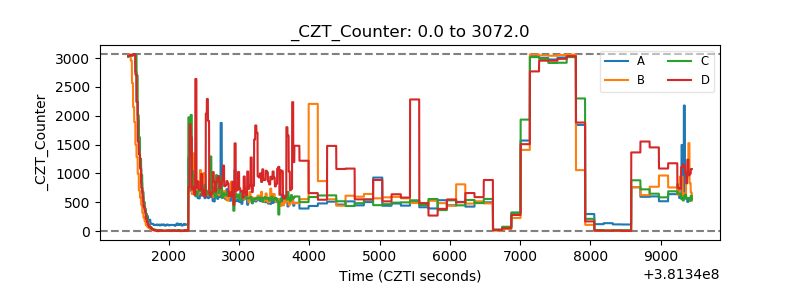 |
| +2.5 Volts monitor | 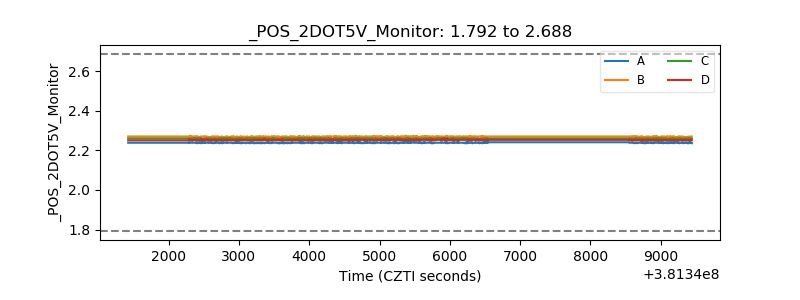 |
| +5 Volts monitor | 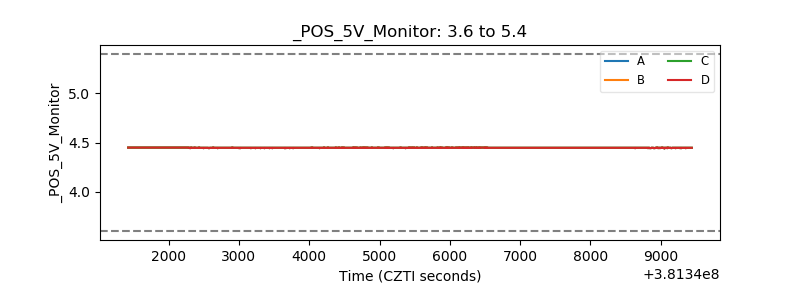 |
| _ROLL_ROT | 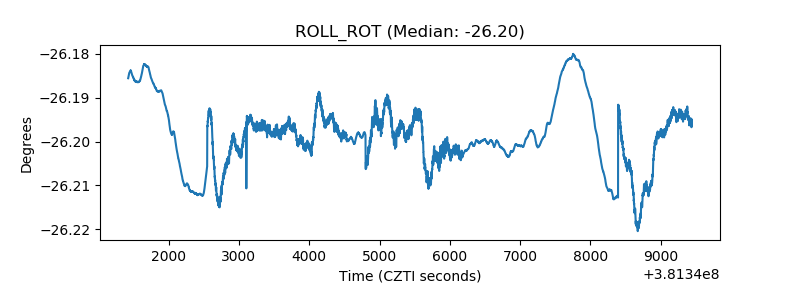 |
| _Roll_DEC | 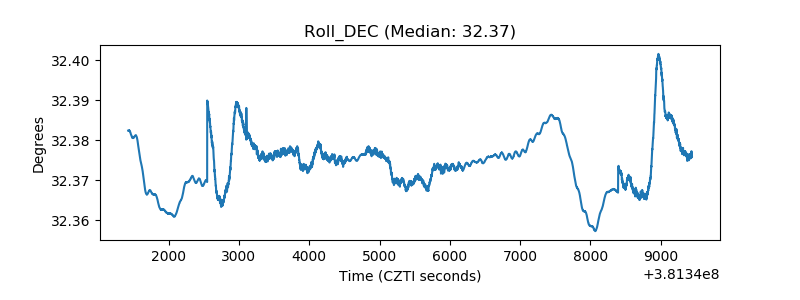 |
| _Roll_RA | 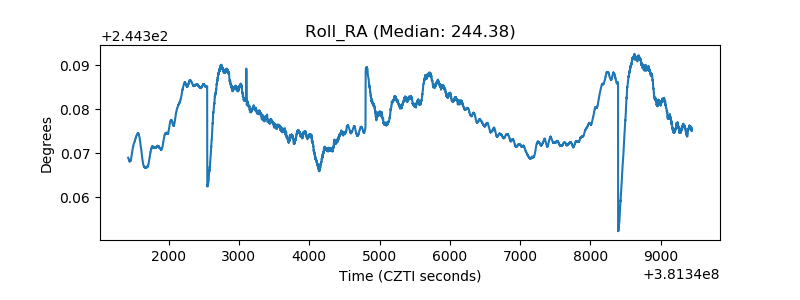 |
| Veto Counter | 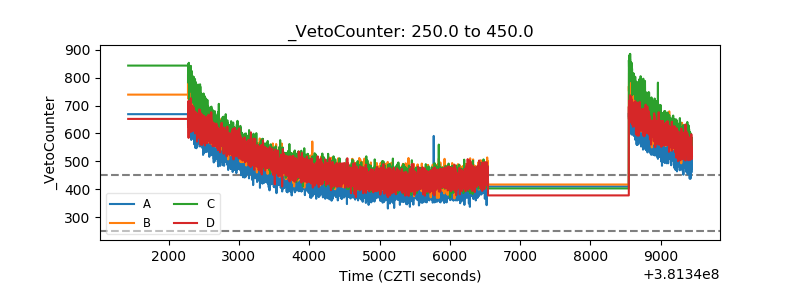 |