| Param | Original file | Final file |
|---|---|---|
| Filename | modeM0/AS1A11_047T07_9000004892_34304cztM0_level2.evt | modeM0/AS1A11_047T07_9000004892_34304cztM0_level2_quad_clean.evt |
| Size (bytes) | 456,719,040 | 54,694,080 |
| Size | 435.6 MB | 52.2 MB |
| Events in quadrant A | 2,832,408 | 321,178 |
| Events in quadrant B | 3,511,432 | 321,139 |
| Events in quadrant C | 3,125,049 | 323,509 |
| Events in quadrant D | 3,992,480 | 307,740 |
| Mode M0 | |||
|---|---|---|---|
| Quadrant | BADHDUFLAG | Total packets | Discarded packets |
| A | 0 | 11852 | 3 |
| B | 0 | 14036 | 2 |
| C | 0 | 12616 | 2 |
| D | 0 | 15548 | 2 |
| Mode M9 | |||
|---|---|---|---|
| Quadrant | BADHDUFLAG | Total packets | Discarded packets |
| A | 0 | 29 | 0 |
| B | 0 | 29 | 0 |
| C | 0 | 29 | 0 |
| D | 0 | 30 | 0 |
| Mode SS | |||
|---|---|---|---|
| Quadrant | BADHDUFLAG | Total packets | Discarded packets |
| A | 0 | 112 | 0 |
| B | 0 | 112 | 0 |
| C | 0 | 112 | 0 |
| D | 0 | 112 | 0 |
| Quadrant | Total seconds | Saturated seconds | Saturation percentage |
|---|---|---|---|
| A | 5457 | 9 | 0.164926% |
| B | 5457 | 98 | 1.795859% |
| C | 5457 | 41 | 0.751329% |
| D | 5457 | 171 | 3.133590% |
Noise dominated data is calculated using 1-second bins in cleaned event files. If a bin has >2000 counts, and if more than 50% of those come from <1% of pixels, then it is considered to be noise-dominated and hence unusable.
| Quadrant | # 1 sec bins | Bins with >0 counts | Bins with >2000 counts | High rate bins dominated by noise | Noise dominated (total time) | Noise dominated (detector-on time) | Marked lightcurve |
|---|---|---|---|---|---|---|---|
| A | 7341 | 5458 | 2 | 2 | 0.03% | 0.04% | 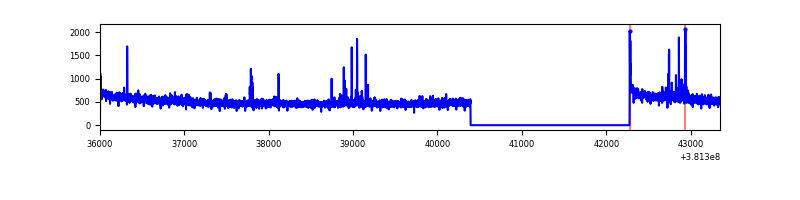 |
| B | 7341 | 5458 | 59 | 59 | 0.80% | 1.08% | 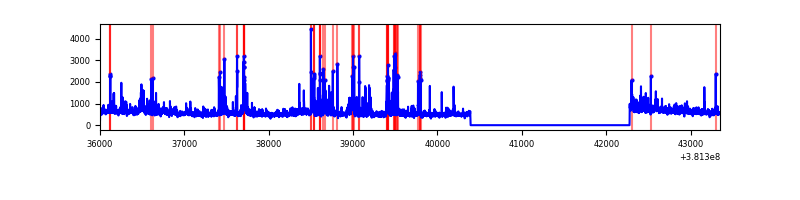 |
| C | 7341 | 5458 | 22 | 22 | 0.30% | 0.40% | 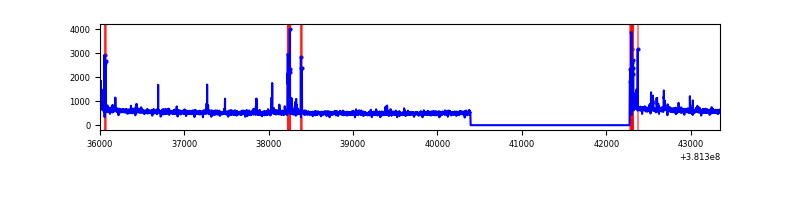 |
| D | 7341 | 5458 | 114 | 114 | 1.55% | 2.09% | 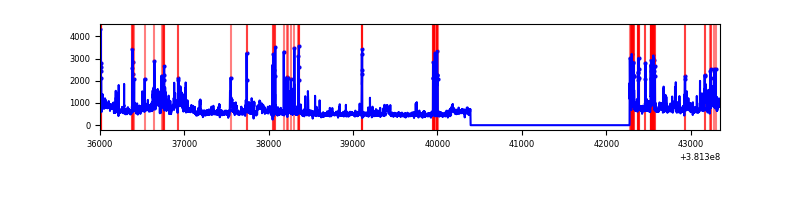 |
Top three noisy pixels from each quadrant. If the there are fewer than three noisy pixels in the level2.evt file, extra rows are filled as -1
| Pixel properties | Quadrant properties | ||||||
|---|---|---|---|---|---|---|---|
| Quadrant | DetID | PixID | Counts | Sigma | Mean | Median | Sigma |
| A | 7 | 16 | 44672 | 315.79 | 701 | 690 | 139.3 |
| A | 10 | 83 | 29965 | 210.19 | 701 | 690 | 139.3 |
| A | 13 | 6 | 17015 | 117.21 | 701 | 690 | 139.3 |
| B | 5 | 172 | 302518 | 2296.31 | 696 | 680 | 131.4 |
| B | 4 | 251 | 122089 | 923.65 | 696 | 680 | 131.4 |
| B | 0 | 190 | 77405 | 583.7 | 696 | 680 | 131.4 |
| C | 15 | 214 | 233252 | 1470.94 | 688 | 694 | 158.1 |
| C | 14 | 254 | 89559 | 562.08 | 688 | 694 | 158.1 |
| C | 0 | 10 | 87596 | 549.66 | 688 | 694 | 158.1 |
| D | 8 | 195 | 376630 | 2116.04 | 675 | 662 | 177.7 |
| D | 12 | 235 | 183077 | 1026.68 | 675 | 662 | 177.7 |
| D | 2 | 249 | 151374 | 848.25 | 675 | 662 | 177.7 |
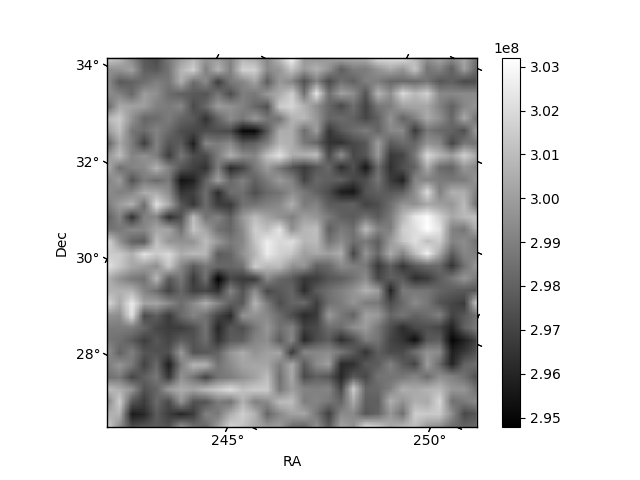
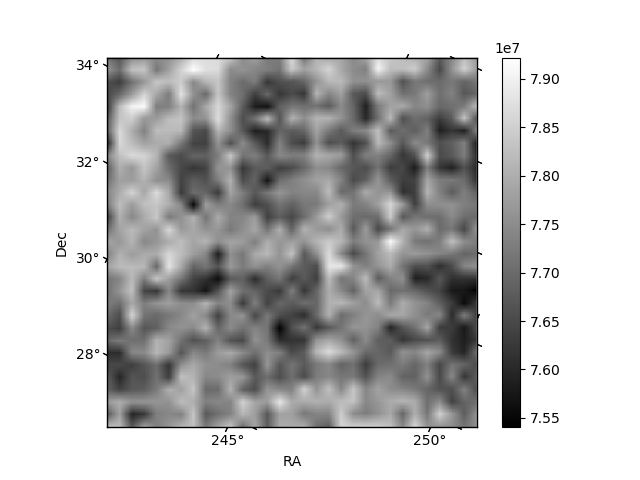
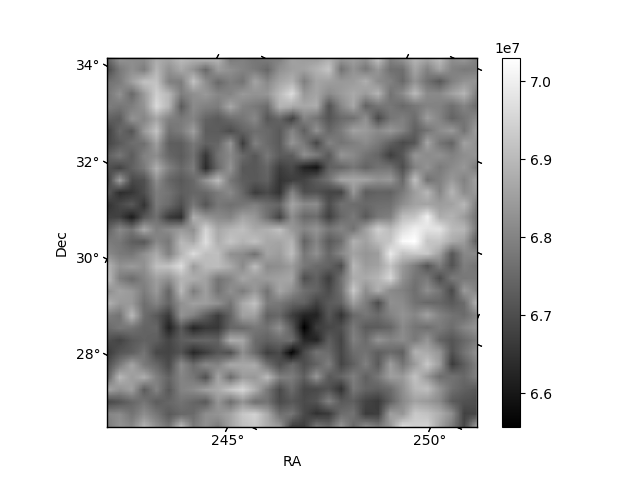
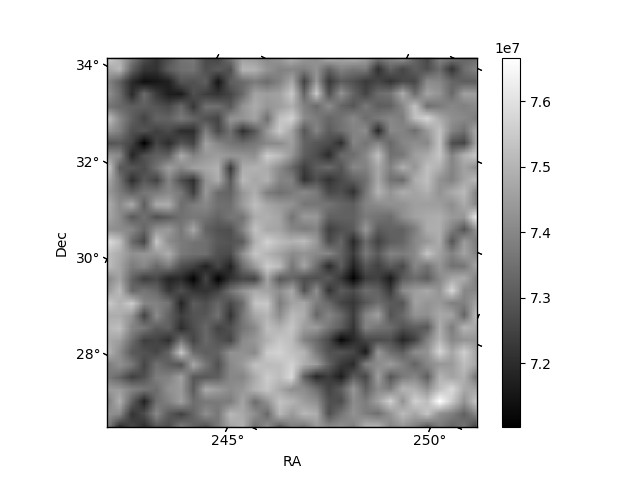
Histogram calculated using DETX and DETY for each event in the final _common_clean file
| Quadrant A | 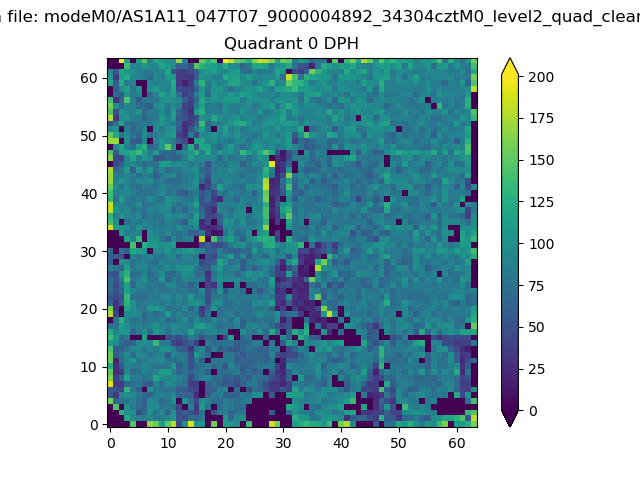 |
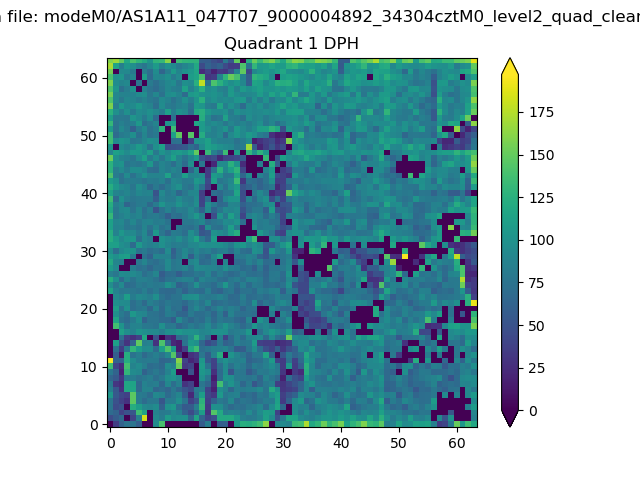 |
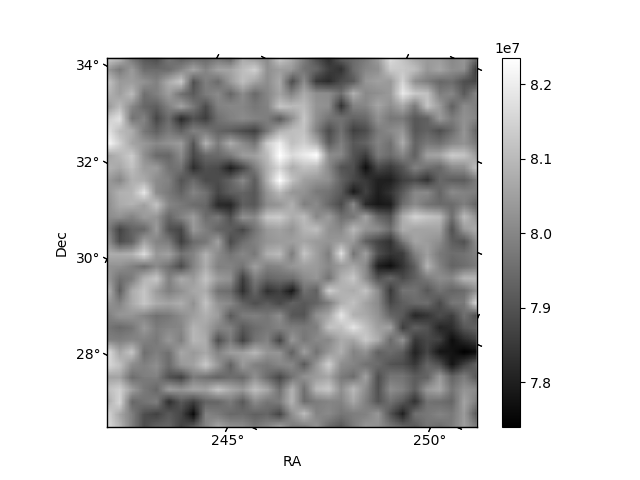
Quadrant B |
|---|---|---|---|
| Quadrant D | 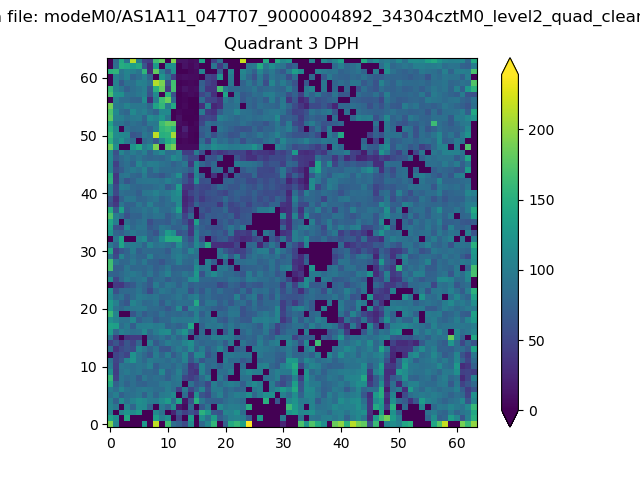 |
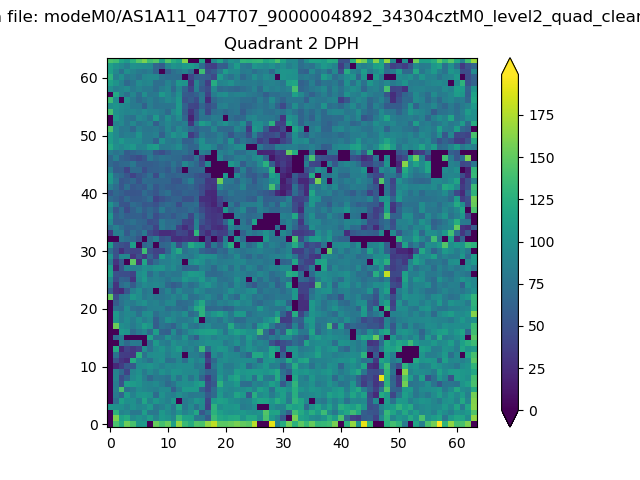 |
Quadrant C |
| Plot type | Count rate plots | Images |
|---|---|---|
| Comparison with Poisson distribution Blue bars denote a histogram of data divided into 1 sec bins. Red curve is a Poisson curve with rate = median count rate of data. |
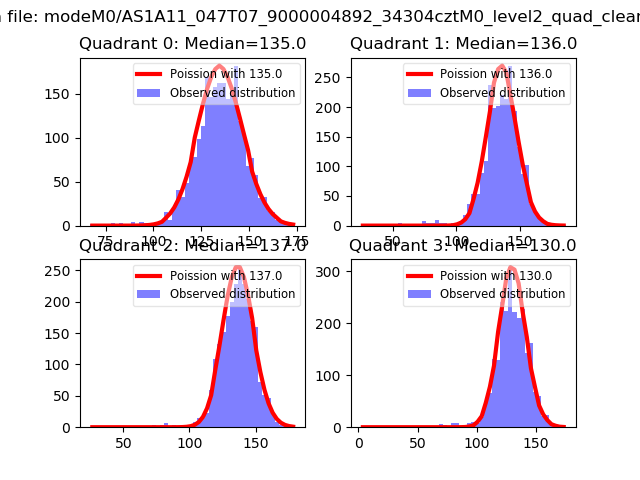 |
 |
| Quadrant-wise count rates Data is divided into 100 sec bins |
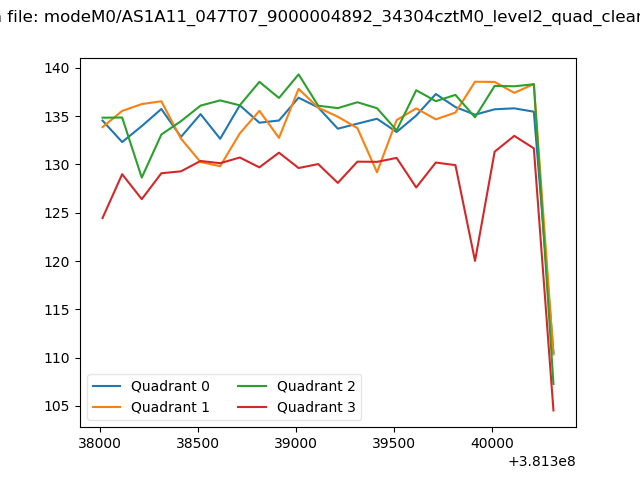 |
|
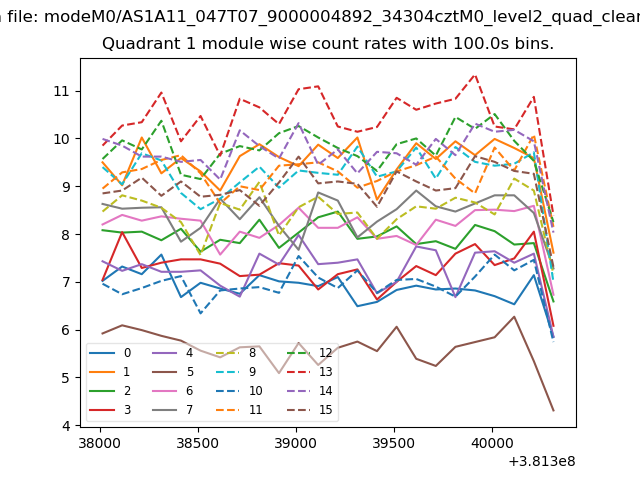
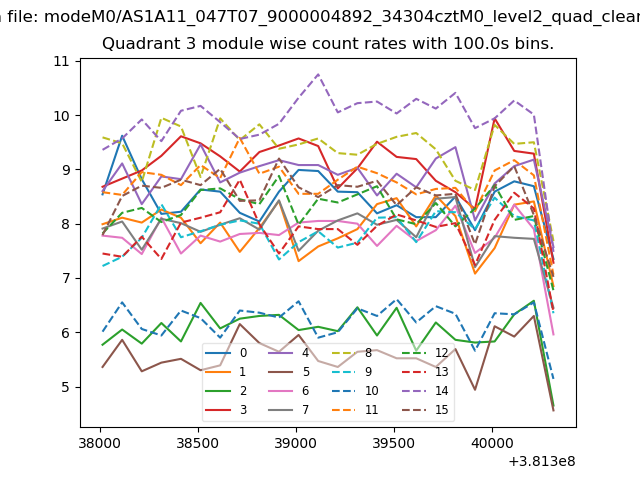
| Module-wise count rates for Quadrant A Data is divided into 100 sec bins |
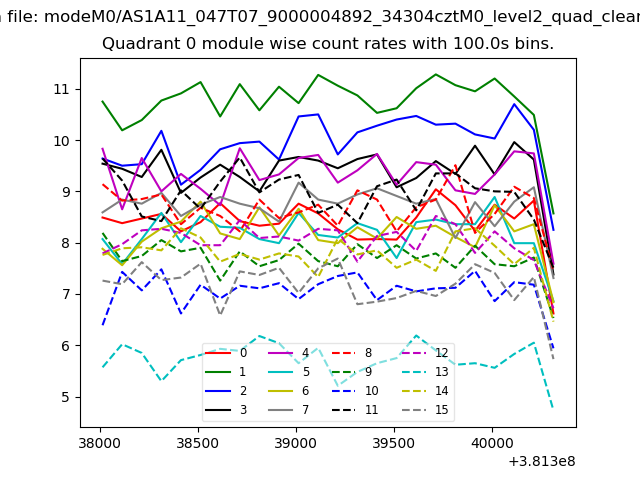 |
 |
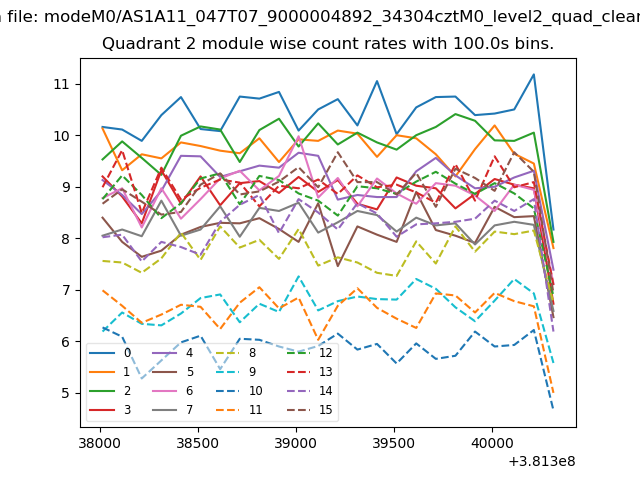
| Module-wise count rates for Quadrant B Data is divided into 100 sec bins |
 |
 |
| Module-wise count rates for Quadrant C Data is divided into 100 sec bins |
 |
 |
| Module-wise count rates for Quadrant D Data is divided into 100 sec bins |
 |
 |
| Parameter | Plot |
|---|---|
| CZT HV Monitor | 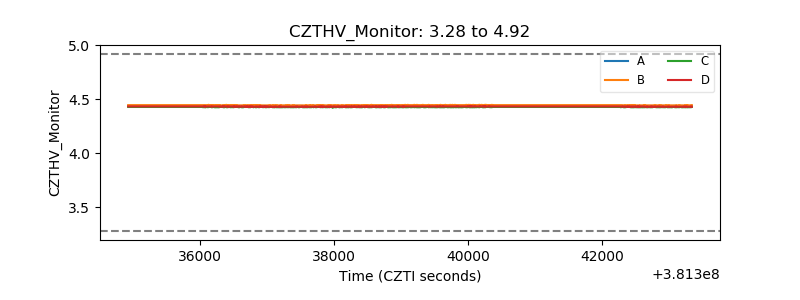 |
| D_VDD | 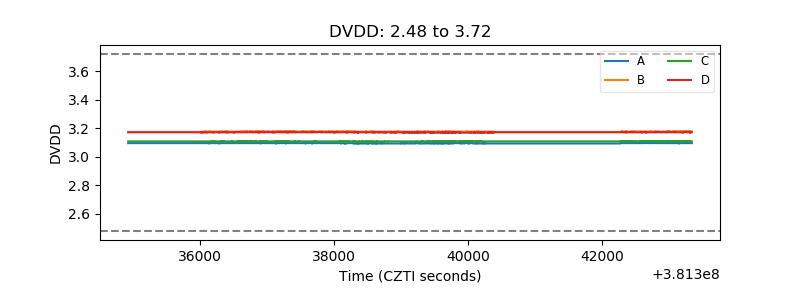 |
| Temperature 1 | 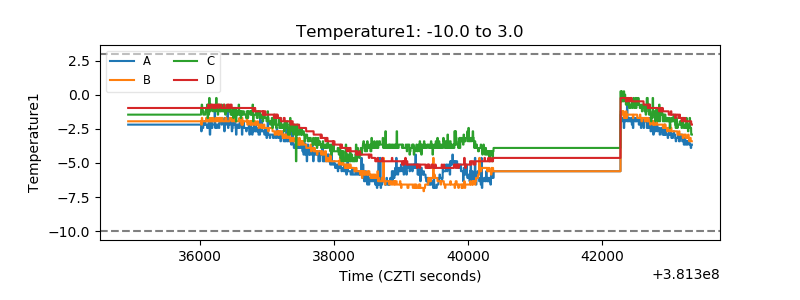 |
| Veto HV Monitor | 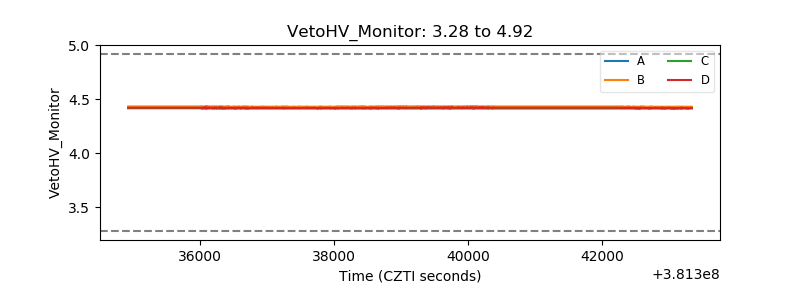 |
| Veto LLD | 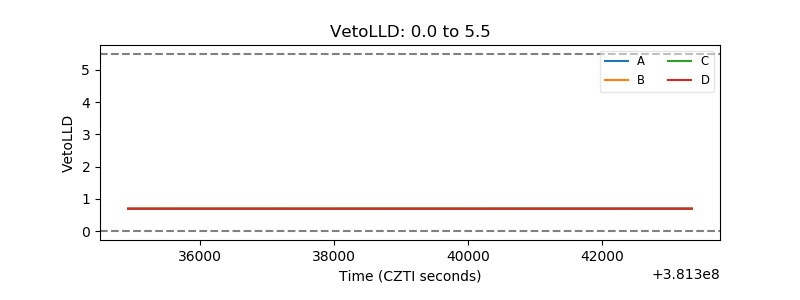 |
| Alpha Counter | 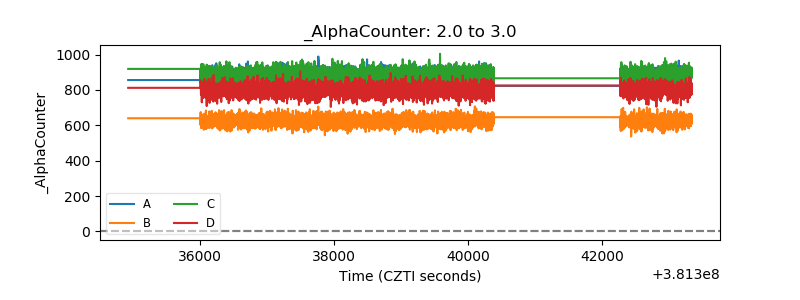 |
| _CPM_Rate | 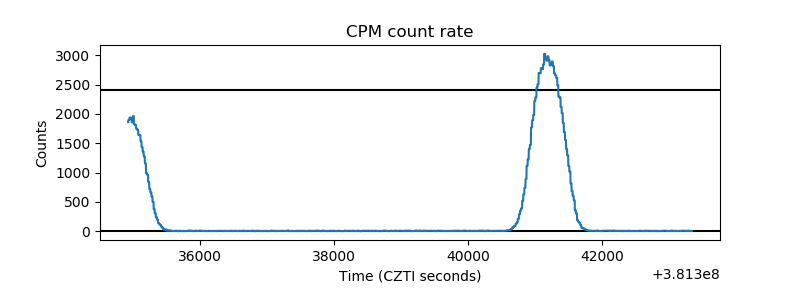 |
| CZT Counter | 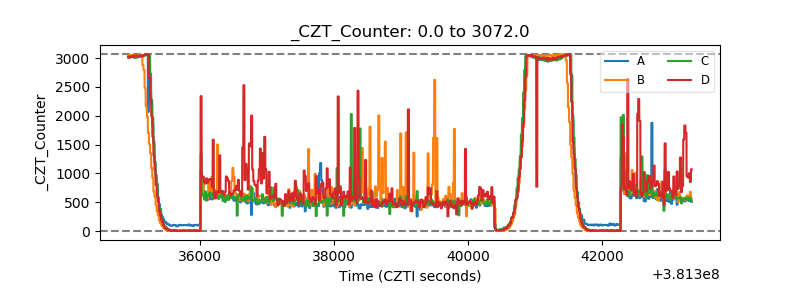 |
| +2.5 Volts monitor | 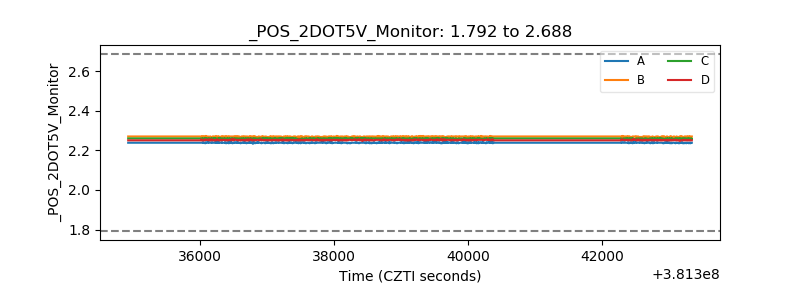 |
| +5 Volts monitor | 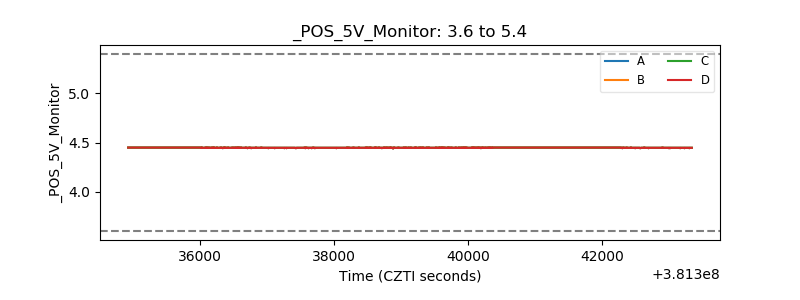 |
| _ROLL_ROT | 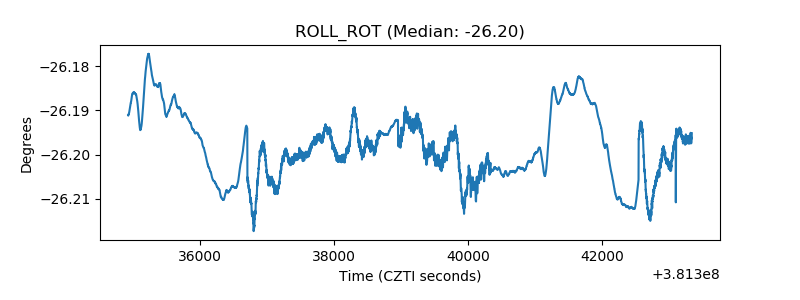 |
| _Roll_DEC | 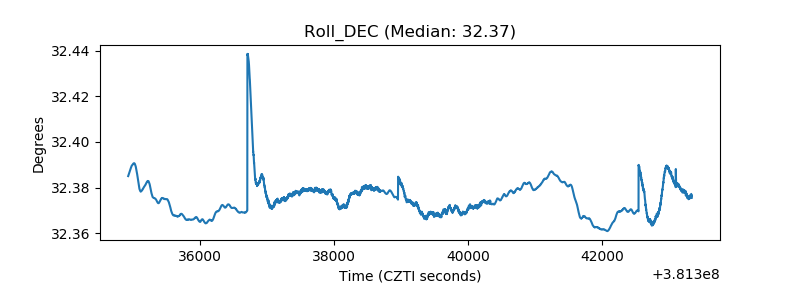 |
| _Roll_RA | 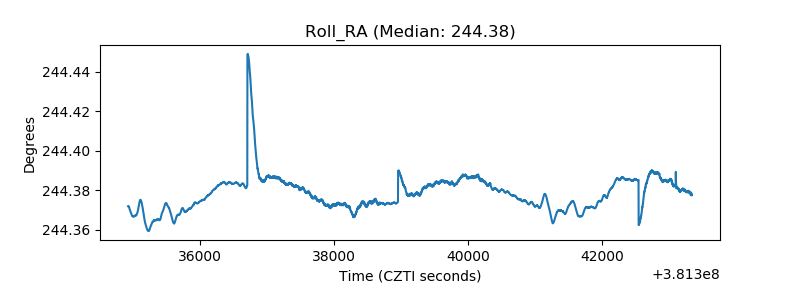 |
| Veto Counter | 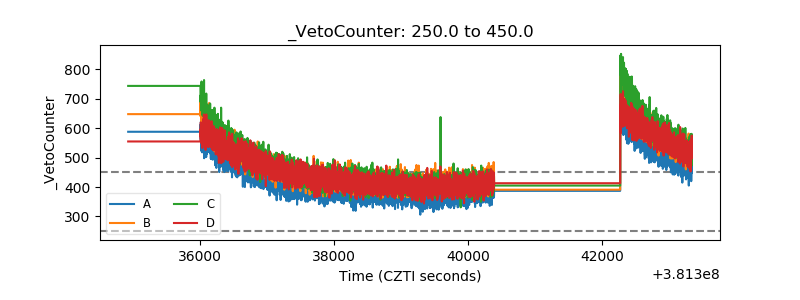 |