| Param | Original file | Final file |
|---|---|---|
| Filename | modeM0/AS1A11_047T07_9000004892_34303cztM0_level2.evt | modeM0/AS1A11_047T07_9000004892_34303cztM0_level2_quad_clean.evt |
| Size (bytes) | 190,411,200 | 29,260,800 |
| Size | 181.6 MB | 27.9 MB |
| Events in quadrant A | 1,168,606 | 182,054 |
| Events in quadrant B | 1,549,953 | 180,507 |
| Events in quadrant C | 1,241,442 | 182,705 |
| Events in quadrant D | 1,648,159 | 174,030 |
| Mode M0 | |||
|---|---|---|---|
| Quadrant | BADHDUFLAG | Total packets | Discarded packets |
| A | 0 | 4941 | 2 |
| B | 0 | 6155 | 1 |
| C | 0 | 5103 | 1 |
| D | 0 | 6560 | 1 |
| Mode M9 | |||
|---|---|---|---|
| Quadrant | BADHDUFLAG | Total packets | Discarded packets |
| A | 0 | 17 | 0 |
| B | 0 | 17 | 0 |
| C | 0 | 17 | 0 |
| D | 0 | 17 | 0 |
| Mode SS | |||
|---|---|---|---|
| Quadrant | BADHDUFLAG | Total packets | Discarded packets |
| A | 0 | 48 | 0 |
| B | 0 | 48 | 0 |
| C | 0 | 48 | 0 |
| D | 0 | 48 | 0 |
| Quadrant | Total seconds | Saturated seconds | Saturation percentage |
|---|---|---|---|
| A | 2304 | 1 | 0.043403% |
| B | 2304 | 79 | 3.428819% |
| C | 2304 | 6 | 0.260417% |
| D | 2304 | 32 | 1.388889% |
Noise dominated data is calculated using 1-second bins in cleaned event files. If a bin has >2000 counts, and if more than 50% of those come from <1% of pixels, then it is considered to be noise-dominated and hence unusable.
| Quadrant | # 1 sec bins | Bins with >0 counts | Bins with >2000 counts | High rate bins dominated by noise | Noise dominated (total time) | Noise dominated (detector-on time) | Marked lightcurve |
|---|---|---|---|---|---|---|---|
| A | 4036 | 2305 | 0 | 0 | 0.00% | 0.00% | 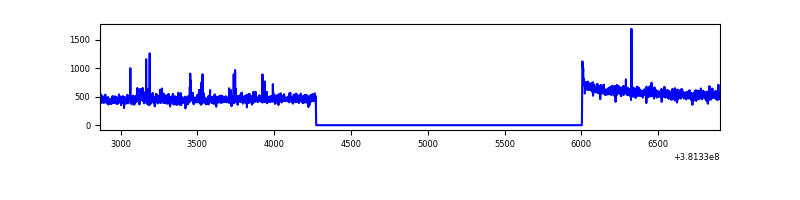 |
| B | 4036 | 2305 | 42 | 42 | 1.04% | 1.82% | 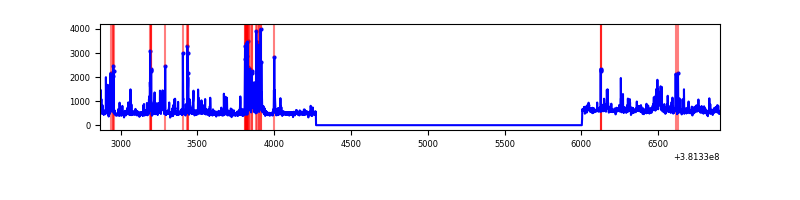 |
| C | 4036 | 2305 | 3 | 3 | 0.07% | 0.13% | 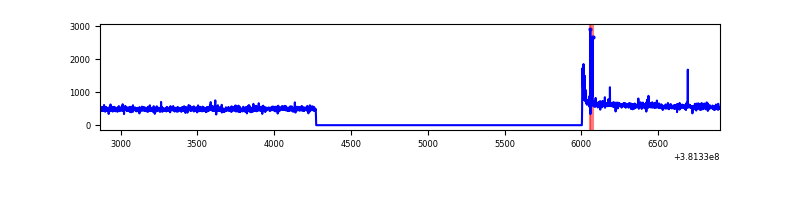 |
| D | 4036 | 2305 | 27 | 27 | 0.67% | 1.17% | 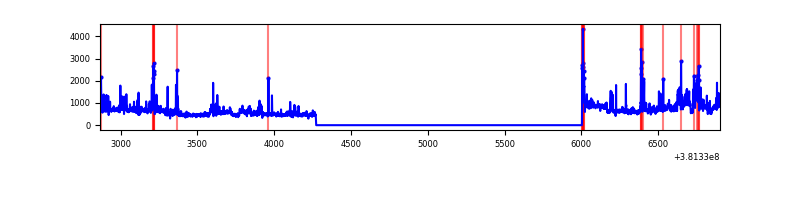 |
Top three noisy pixels from each quadrant. If the there are fewer than three noisy pixels in the level2.evt file, extra rows are filled as -1
| Pixel properties | Quadrant properties | ||||||
|---|---|---|---|---|---|---|---|
| Quadrant | DetID | PixID | Counts | Sigma | Mean | Median | Sigma |
| A | 7 | 16 | 14974 | 246.87 | 291 | 286 | 59.5 |
| A | 10 | 83 | 14138 | 232.82 | 291 | 286 | 59.5 |
| A | 13 | 6 | 9236 | 150.43 | 291 | 286 | 59.5 |
| B | 5 | 172 | 158274 | 2798.55 | 287 | 281 | 56.5 |
| B | 4 | 171 | 108444 | 1915.91 | 287 | 281 | 56.5 |
| B | 15 | 85 | 40940 | 720.2 | 287 | 281 | 56.5 |
| C | 15 | 214 | 99077 | 1471.82 | 283 | 285 | 67.1 |
| C | 0 | 10 | 26155 | 385.41 | 283 | 285 | 67.1 |
| C | 14 | 67 | 6637 | 94.63 | 283 | 285 | 67.1 |
| D | 8 | 195 | 194366 | 2762.68 | 279 | 271 | 70.3 |
| D | 12 | 235 | 111938 | 1589.43 | 279 | 271 | 70.3 |
| D | 1 | 3 | 67016 | 950.02 | 279 | 271 | 70.3 |
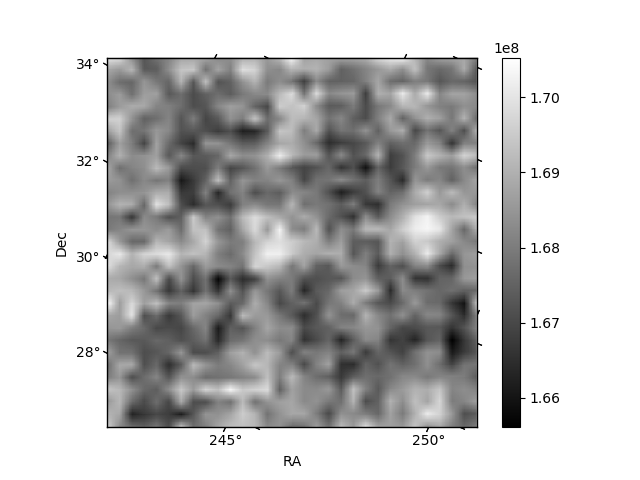
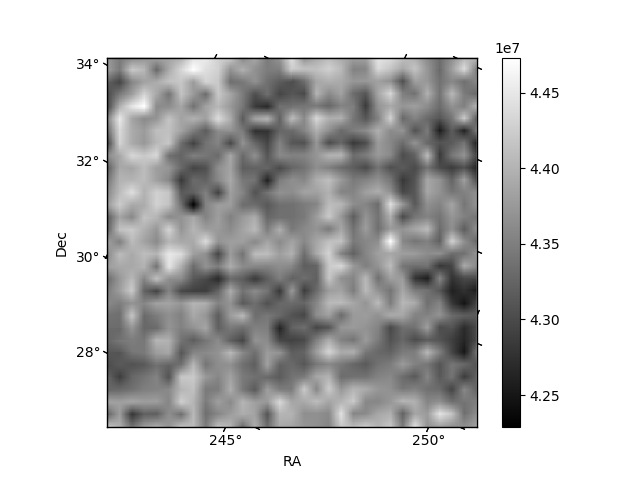
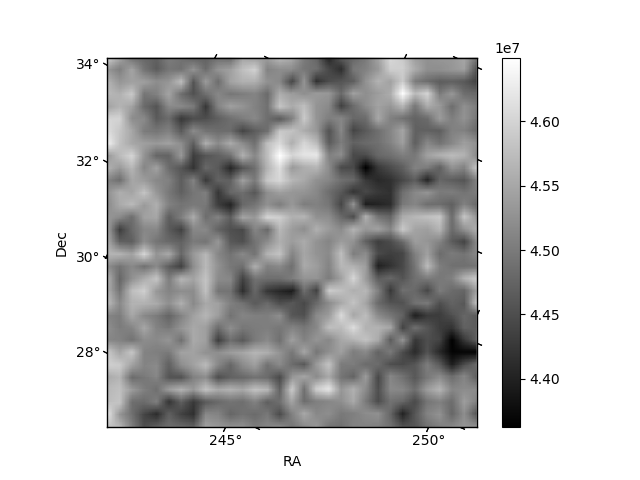
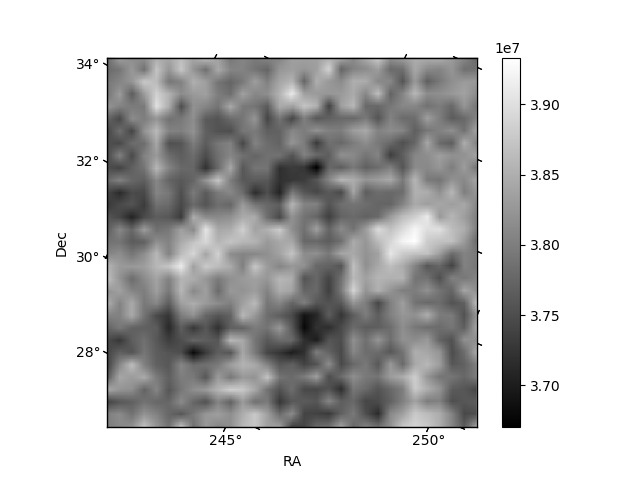
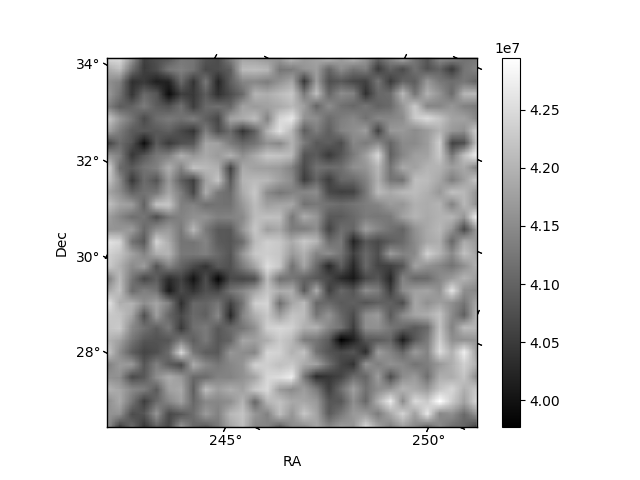
Histogram calculated using DETX and DETY for each event in the final _common_clean file
| Quadrant A | 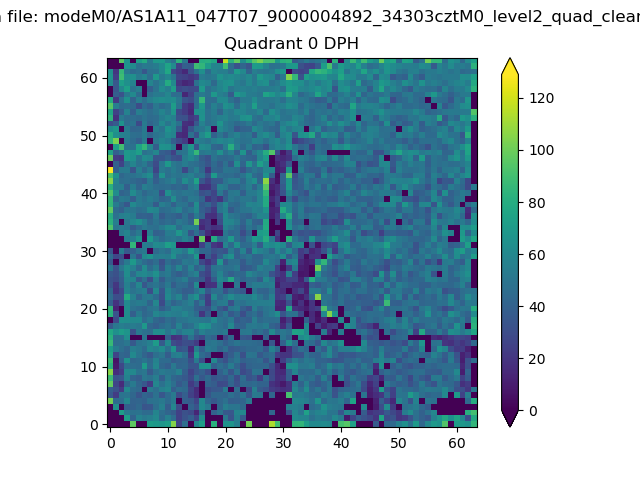 |
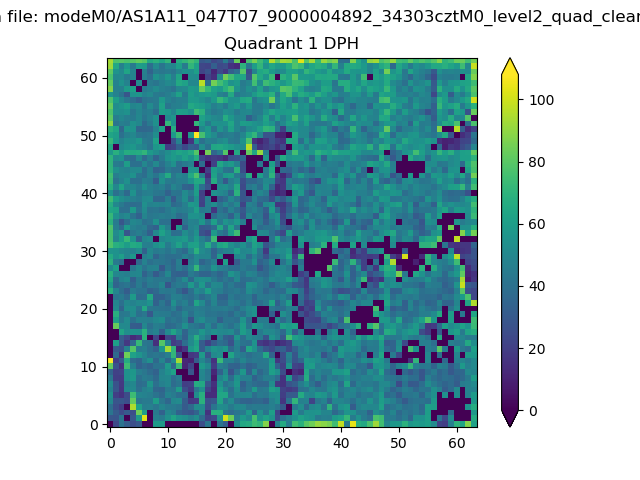 |
Quadrant B |
|---|---|---|---|
| Quadrant D |  |
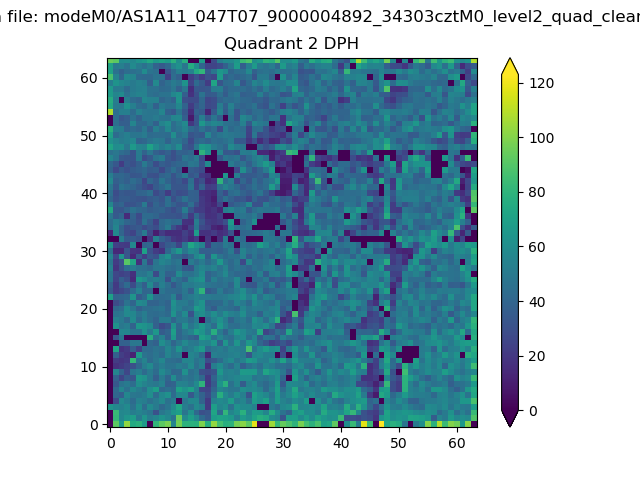 |
Quadrant C |
| Plot type | Count rate plots | Images |
|---|---|---|
| Comparison with Poisson distribution Blue bars denote a histogram of data divided into 1 sec bins. Red curve is a Poisson curve with rate = median count rate of data. |
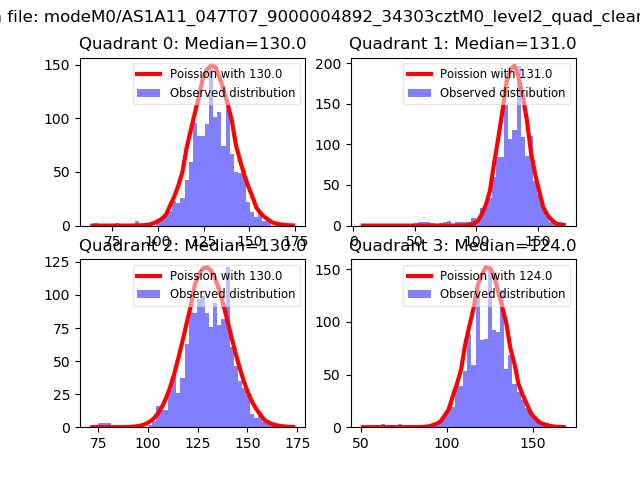 |
 |
| Quadrant-wise count rates Data is divided into 100 sec bins |
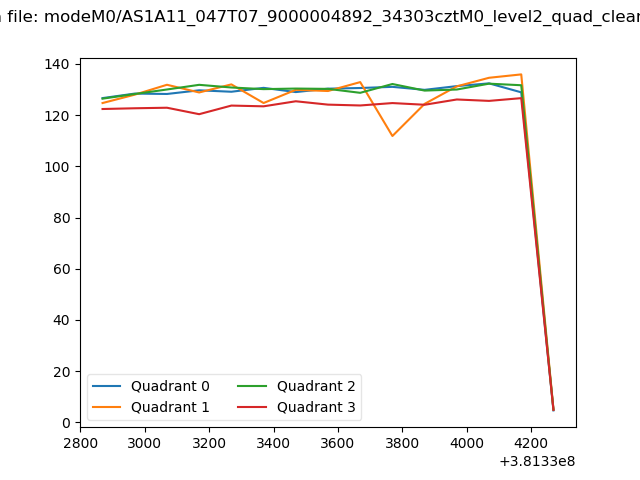 |
|
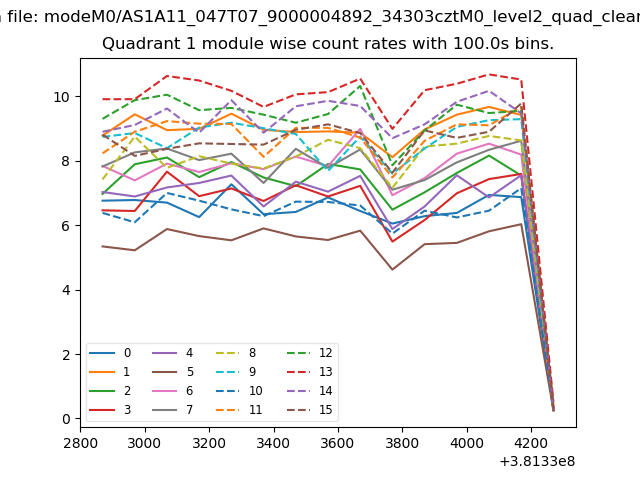
| Module-wise count rates for Quadrant A Data is divided into 100 sec bins |
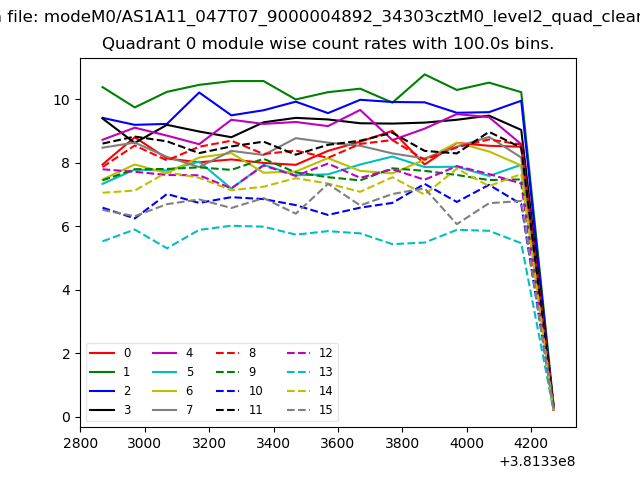 |
 |
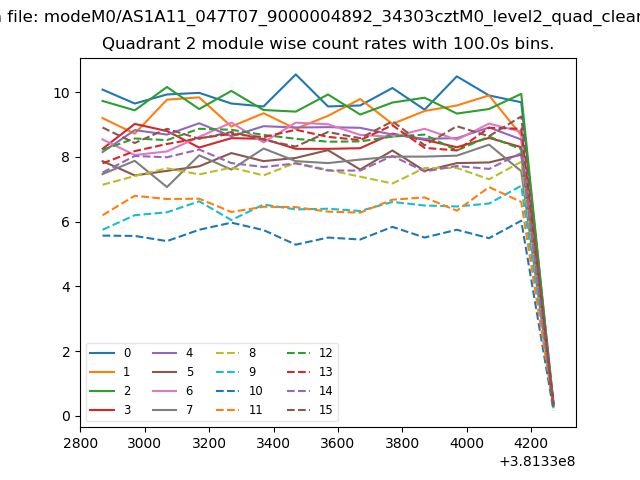
| Module-wise count rates for Quadrant B Data is divided into 100 sec bins |
 |
 |
| Module-wise count rates for Quadrant C Data is divided into 100 sec bins |
 |
 |
| Module-wise count rates for Quadrant D Data is divided into 100 sec bins |
 |
 |
| Parameter | Plot |
|---|---|
| CZT HV Monitor |  |
| D_VDD | 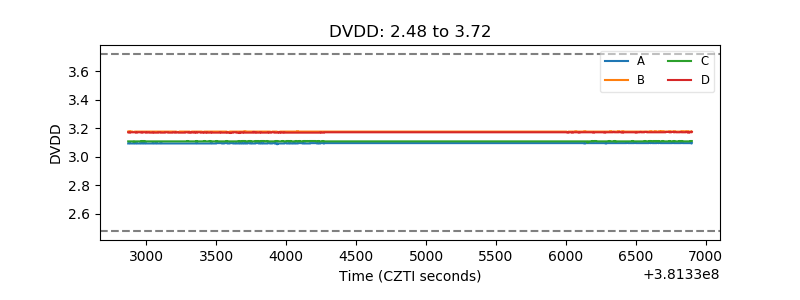 |
| Temperature 1 | 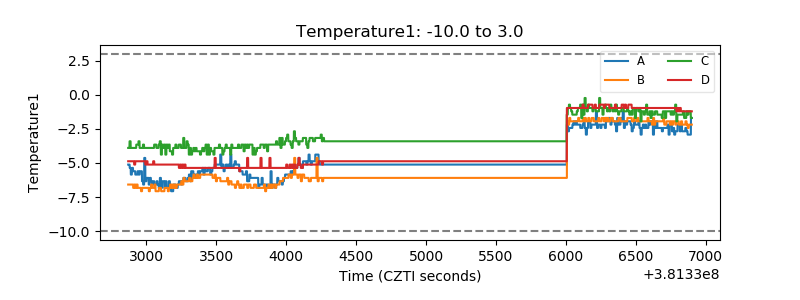 |
| Veto HV Monitor | 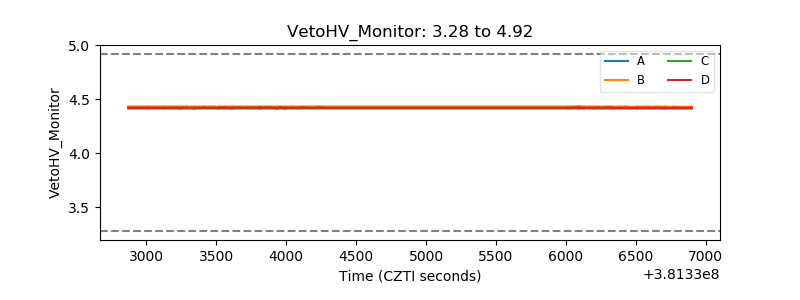 |
| Veto LLD | 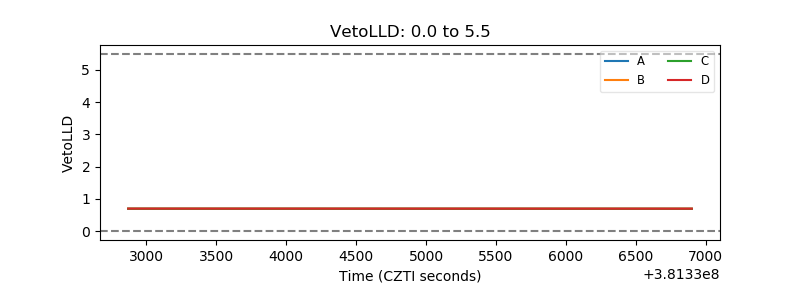 |
| Alpha Counter | 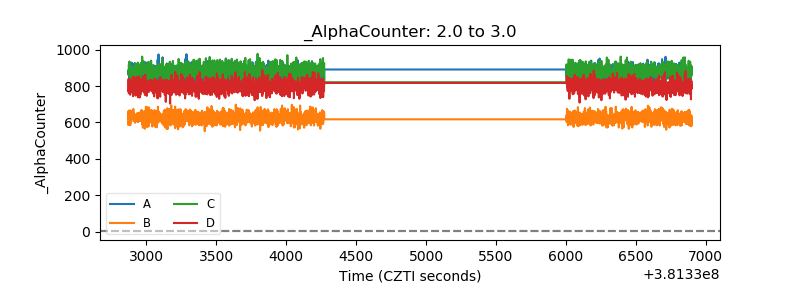 |
| _CPM_Rate | 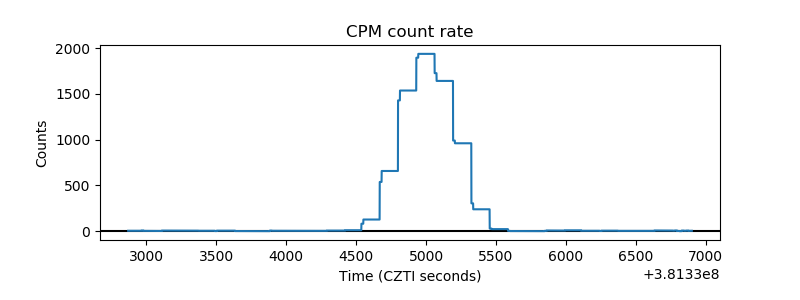 |
| CZT Counter | 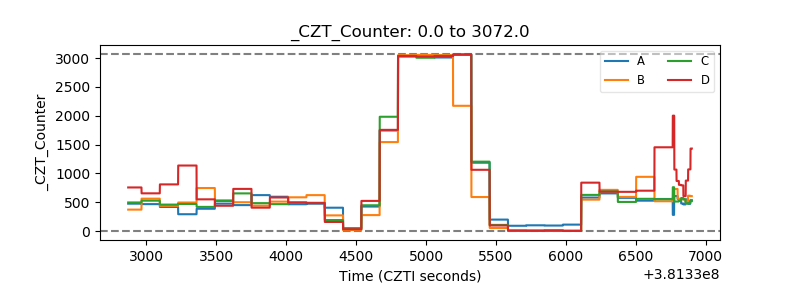 |
| +2.5 Volts monitor | 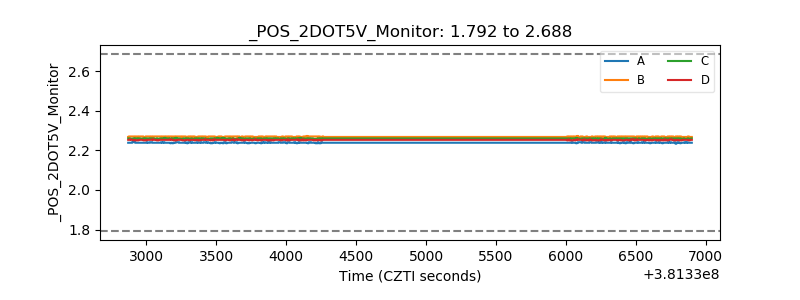 |
| +5 Volts monitor | 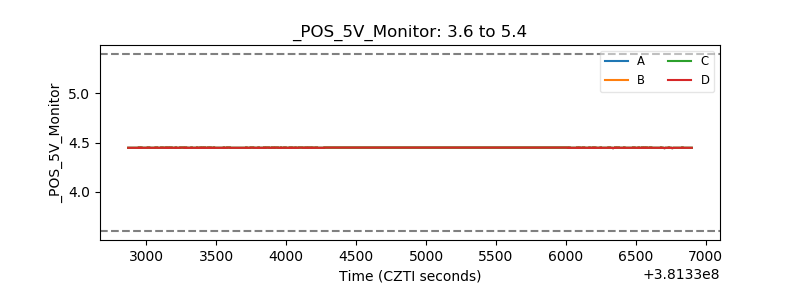 |
| _ROLL_ROT |  |
| _Roll_DEC | 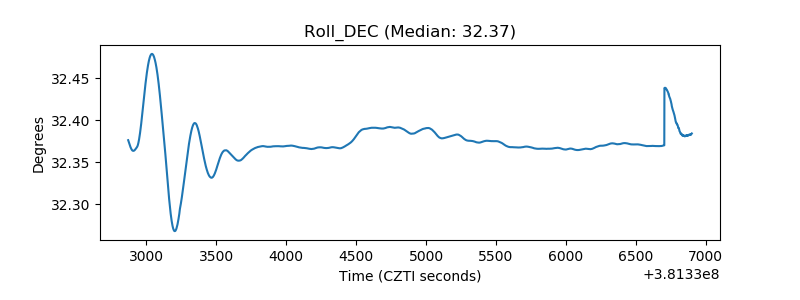 |
| _Roll_RA | 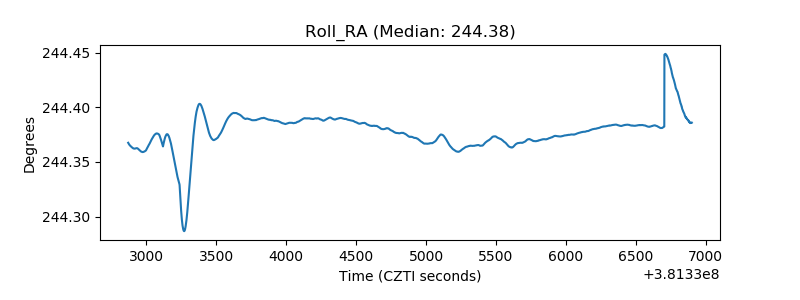 |
| Veto Counter | 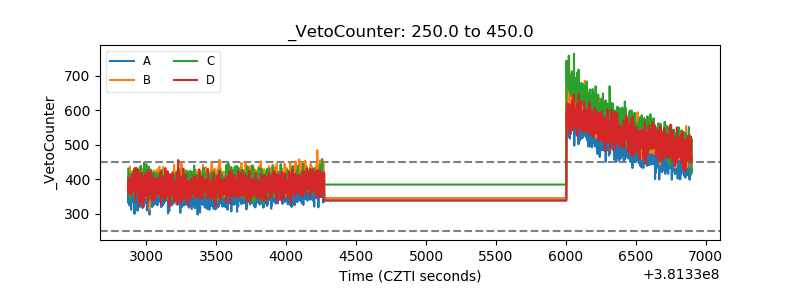 |