| Param | Original file | Final file |
|---|---|---|
| Filename | modeM0/AS1A11_047T07_9000004892cztM0_level2_bc.evt | modeM0/AS1A11_047T07_9000004892cztM0_level2_quad_clean.evt |
| Size (bytes) | 1,200,620,160 | 374,739,840 |
| Size | 1.1 GB | 357.4 MB |
| Events in quadrant A | 5,699,134 | 2,454,768 |
| Events in quadrant B | 9,223,281 | 2,436,270 |
| Events in quadrant C | 6,778,791 | 2,503,974 |
| Events in quadrant D | 13,059,490 | 2,339,938 |
| Mode M0 | |||
|---|---|---|---|
| Quadrant | BADHDUFLAG | Total packets | Discarded packets |
| A | 0 | 49864 | 0 |
| B | 0 | 64666 | 0 |
| C | 0 | 52010 | 0 |
| D | 0 | 75495 | 0 |
| Mode M9 | |||
|---|---|---|---|
| Quadrant | BADHDUFLAG | Total packets | Discarded packets |
| A | 0 | 119 | 0 |
| B | 0 | 119 | 0 |
| C | 0 | 119 | 0 |
| D | 0 | 119 | 0 |
| Mode SS | |||
|---|---|---|---|
| Quadrant | BADHDUFLAG | Total packets | Discarded packets |
| A | 0 | 484 | 0 |
| B | 0 | 484 | 0 |
| C | 0 | 484 | 0 |
| D | 0 | 484 | 0 |
| Quadrant | Total seconds | Saturated seconds | Saturation percentage |
|---|---|---|---|
| A | 23477 | 53 | 0.225753% |
| B | 23477 | 923 | 3.931507% |
| C | 23477 | 132 | 0.562252% |
| D | 23477 | 948 | 4.037995% |
Noise dominated data is calculated using 1-second bins in cleaned event files. If a bin has >2000 counts, and if more than 50% of those come from <1% of pixels, then it is considered to be noise-dominated and hence unusable.
| Quadrant | # 1 sec bins | Bins with >0 counts | Bins with >2000 counts | High rate bins dominated by noise | Noise dominated (total time) | Noise dominated (detector-on time) | Marked lightcurve |
|---|---|---|---|---|---|---|---|
| A | 35464 | 23481 | 2 | 2 | 0.01% | 0.01% | 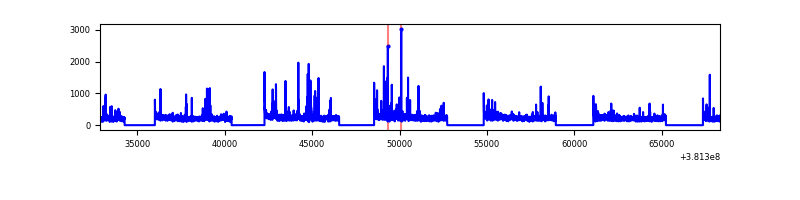 |
| B | 35464 | 23477 | 69 | 69 | 0.19% | 0.29% | 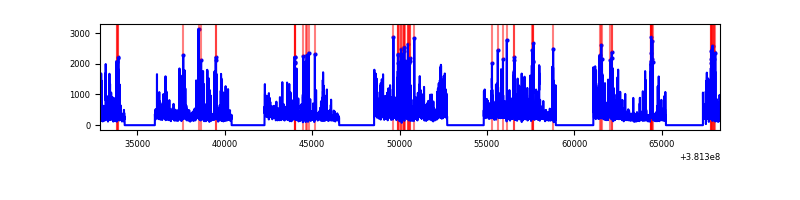 |
| C | 35464 | 23477 | 23 | 23 | 0.06% | 0.10% | 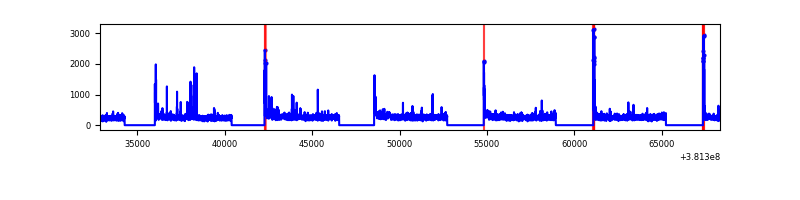 |
| D | 35464 | 23477 | 164 | 164 | 0.46% | 0.70% | 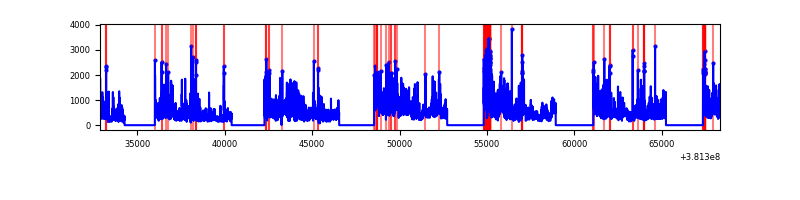 |
Top three noisy pixels from each quadrant. If the there are fewer than three noisy pixels in the level2.evt file, extra rows are filled as -1
| Pixel properties | Quadrant properties | ||||||
|---|---|---|---|---|---|---|---|
| Quadrant | DetID | PixID | Counts | Sigma | Mean | Median | Sigma |
| A | 7 | 16 | 179120 | 604.19 | 1357 | 1341 | 294.2 |
| A | 10 | 83 | 90184 | 301.94 | 1357 | 1341 | 294.2 |
| A | 9 | 143 | 73150 | 244.05 | 1357 | 1341 | 294.2 |
| B | 5 | 172 | 1456728 | 5552.71 | 1356 | 1333 | 262.1 |
| B | 5 | 31 | 965783 | 3679.63 | 1356 | 1333 | 262.1 |
| B | 4 | 251 | 355894 | 1352.74 | 1356 | 1333 | 262.1 |
| C | 15 | 214 | 940806 | 3092.45 | 1360 | 1358 | 303.8 |
| C | 0 | 10 | 266651 | 873.28 | 1360 | 1358 | 303.8 |
| C | 14 | 254 | 88315 | 286.24 | 1360 | 1358 | 303.8 |
| D | 8 | 195 | 2853630 | 8547.78 | 1324 | 1297 | 333.7 |
| D | 12 | 235 | 1674961 | 5015.58 | 1324 | 1297 | 333.7 |
| D | 7 | 223 | 1023896 | 3064.49 | 1324 | 1297 | 333.7 |
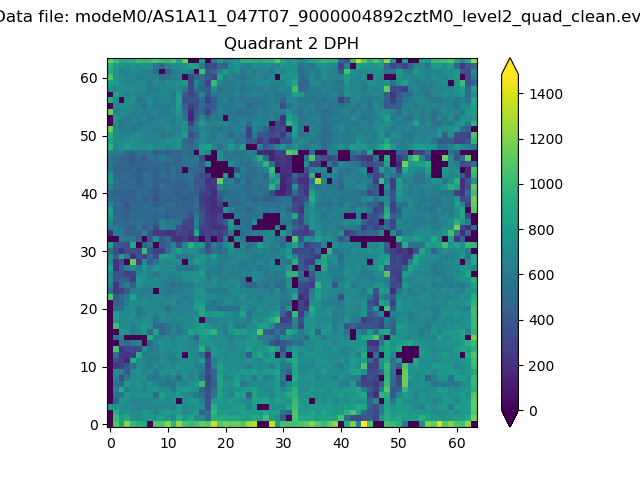
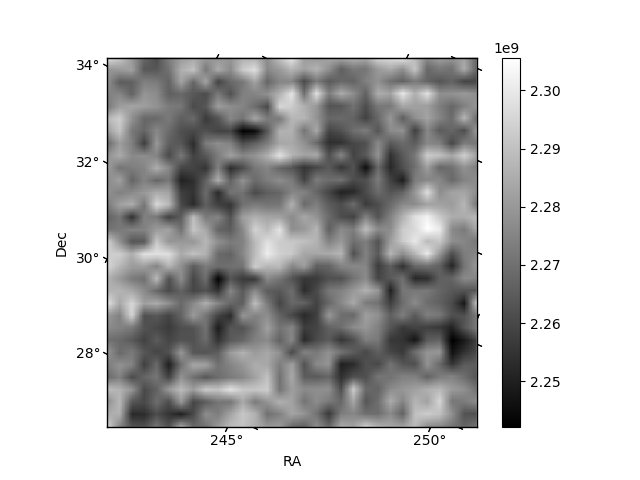
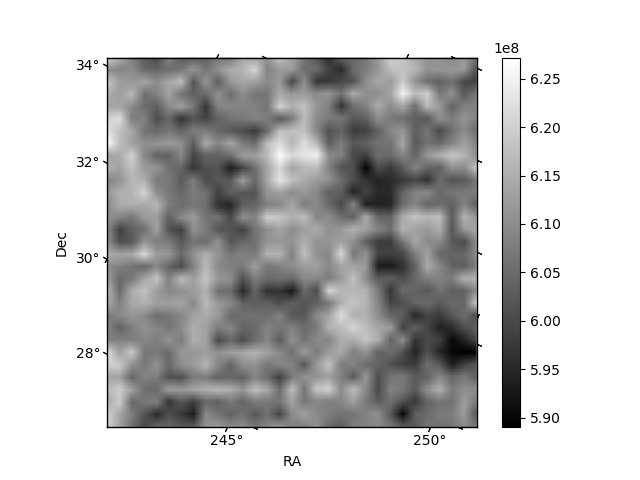
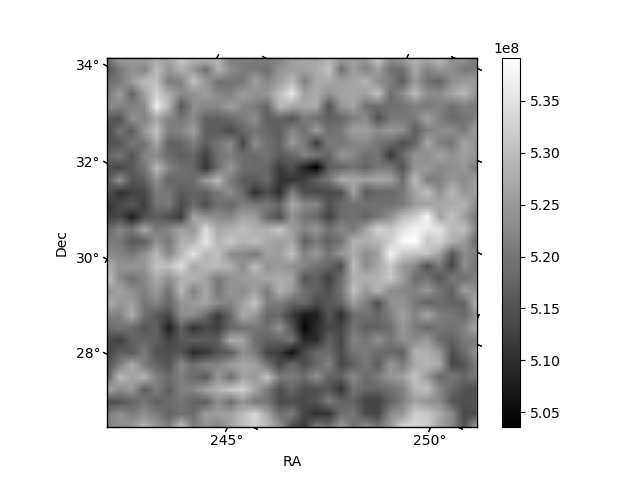
Histogram calculated using DETX and DETY for each event in the final _common_clean file
| Quadrant A | 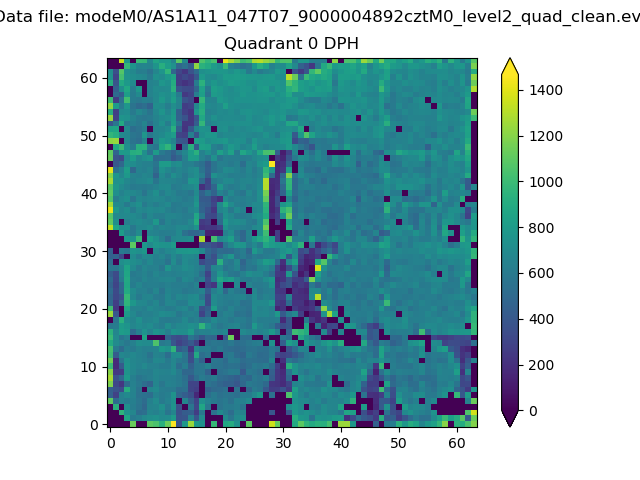 |
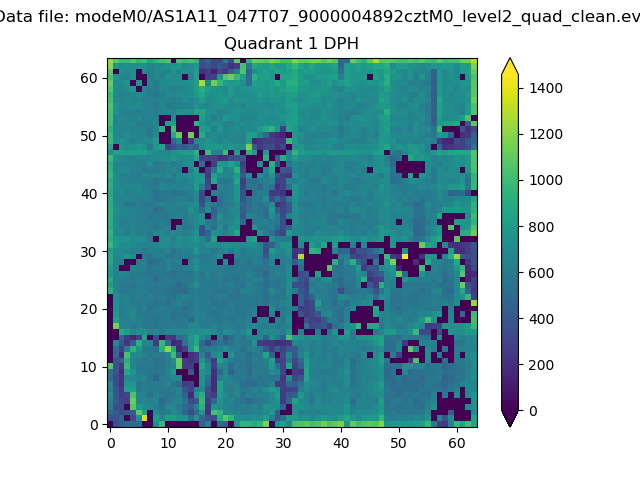 |
Quadrant B |
|---|---|---|---|
| Quadrant D | 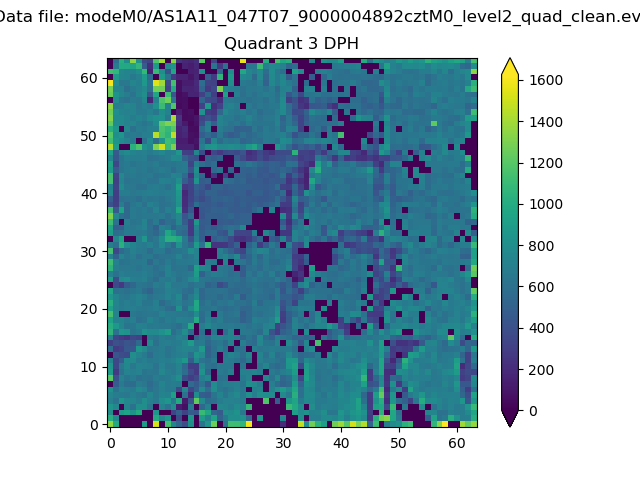 |
 |
Quadrant C |
| Plot type | Count rate plots | Images |
|---|---|---|
| Comparison with Poisson distribution Blue bars denote a histogram of data divided into 1 sec bins. Red curve is a Poisson curve with rate = median count rate of data. |
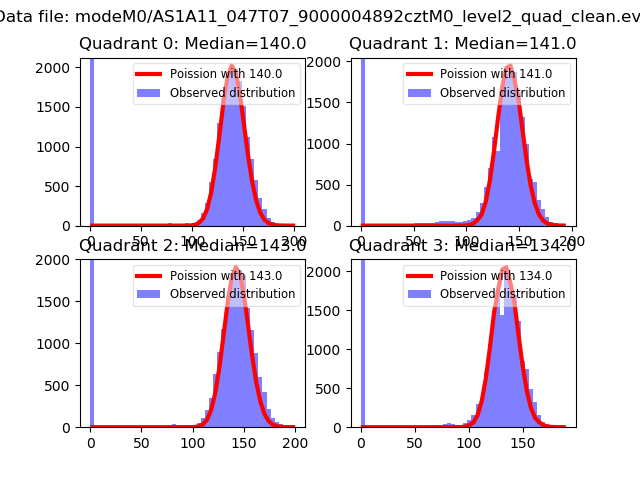 |
 |
| Quadrant-wise count rates Data is divided into 100 sec bins |
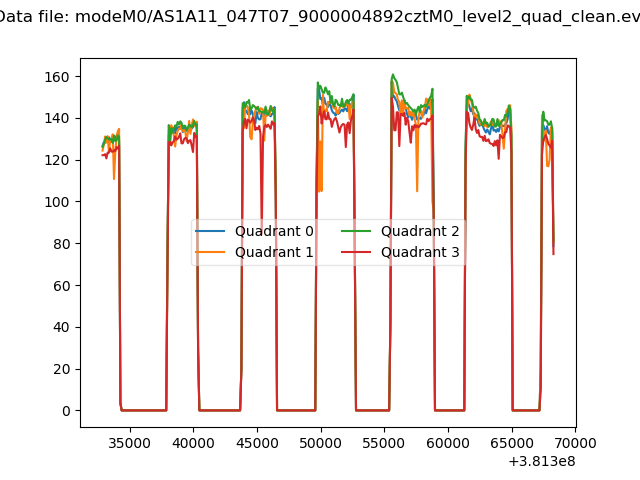 |
|
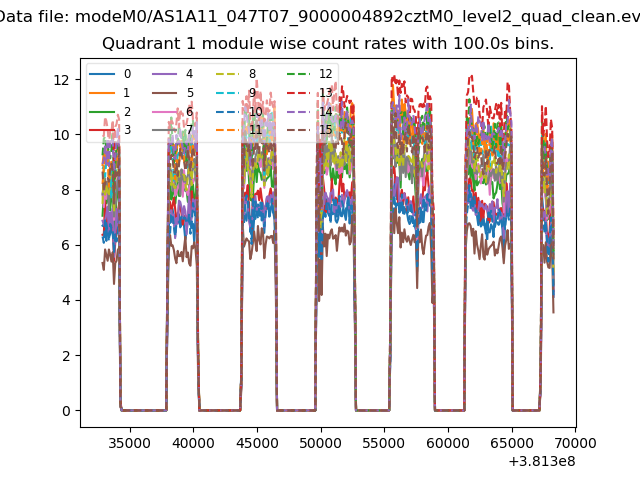
| Module-wise count rates for Quadrant A Data is divided into 100 sec bins |
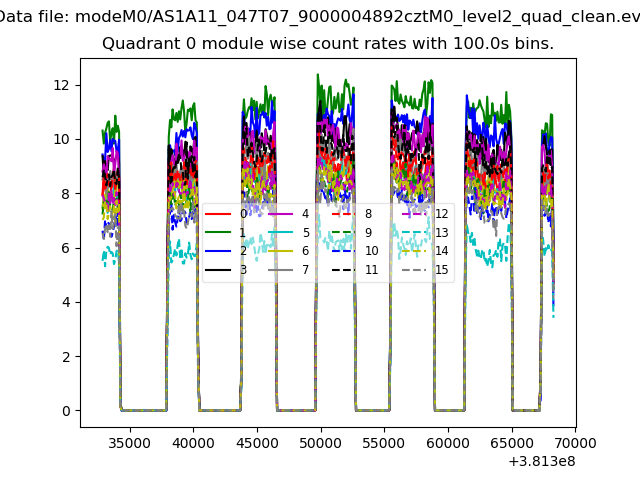 |
 |
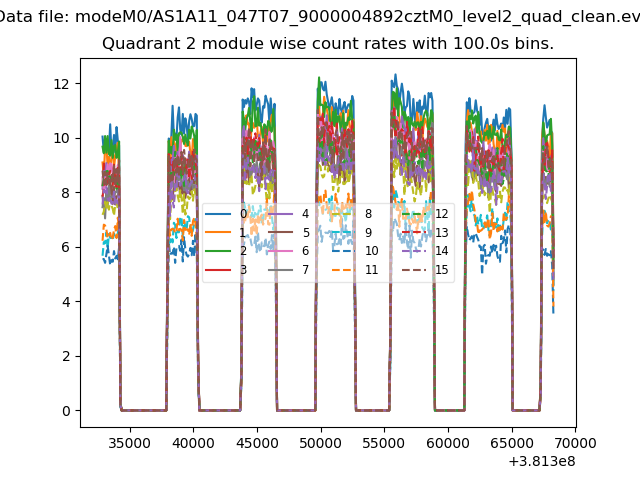
| Module-wise count rates for Quadrant B Data is divided into 100 sec bins |
 |
 |
| Module-wise count rates for Quadrant C Data is divided into 100 sec bins |
 |
 |
| Module-wise count rates for Quadrant D Data is divided into 100 sec bins |
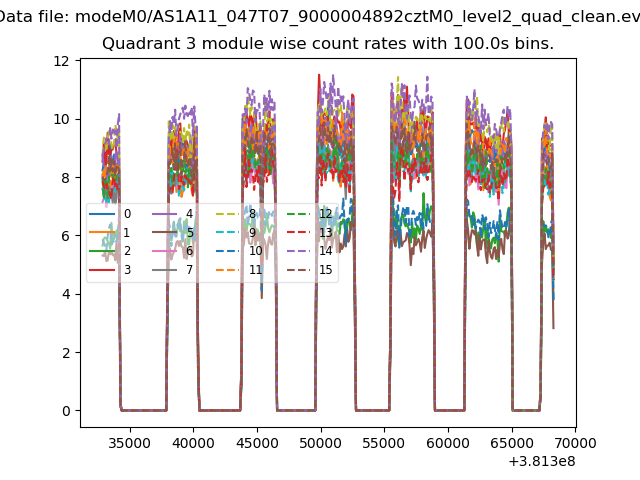 |
 |
| Parameter | Plot |
|---|---|
| CZT HV Monitor | 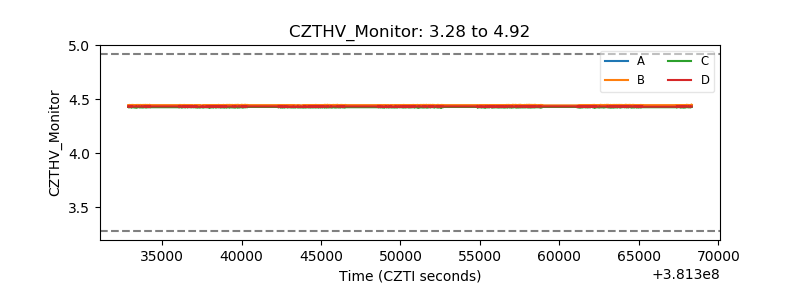 |
| D_VDD | 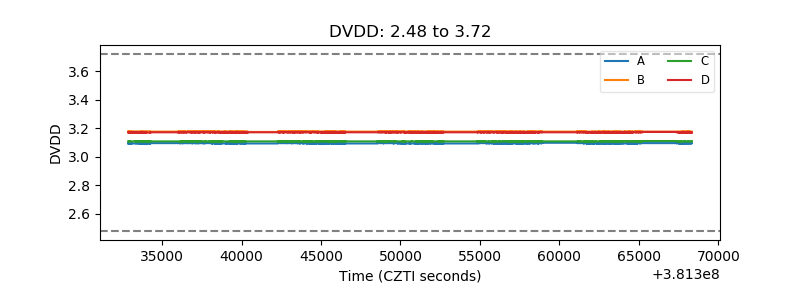 |
| Temperature 1 | 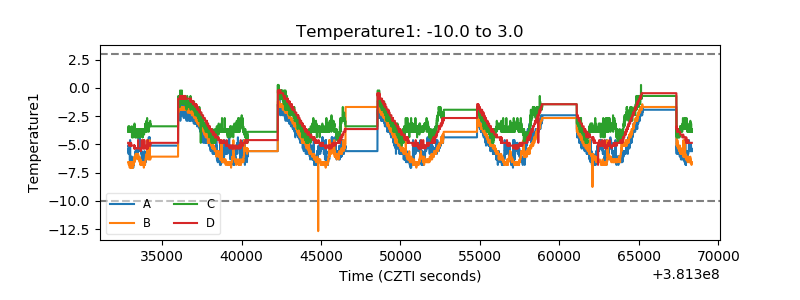 |
| Veto HV Monitor | 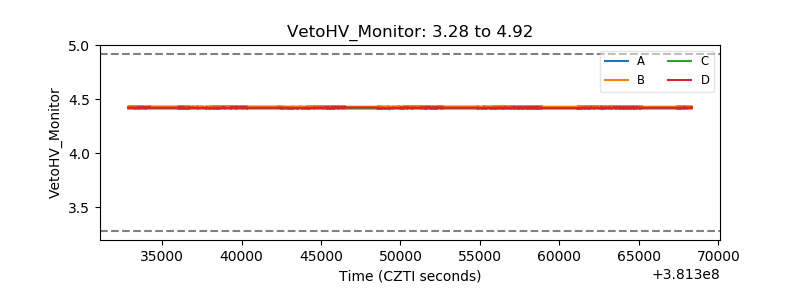 |
| Veto LLD | 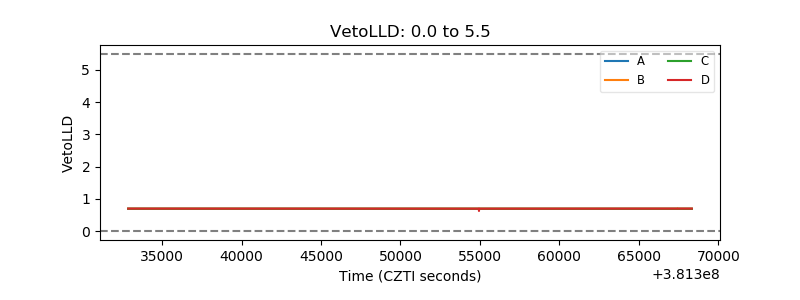 |
| Alpha Counter | 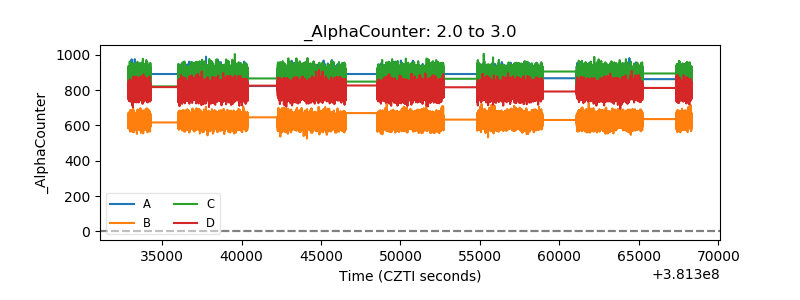 |
| _CPM_Rate | 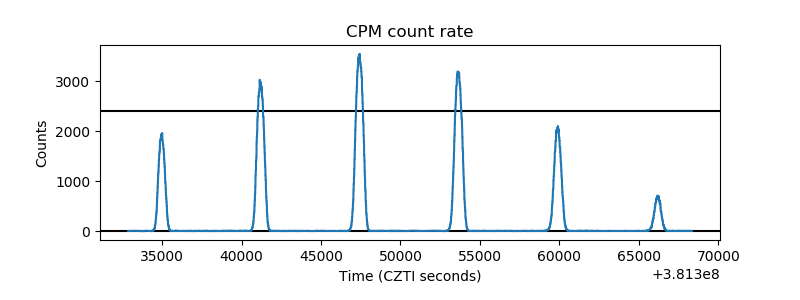 |
| CZT Counter | 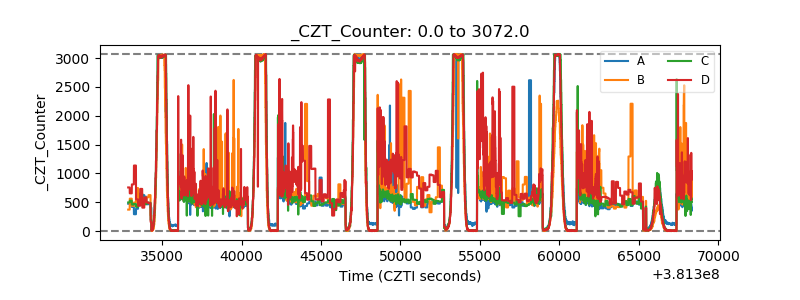 |
| +2.5 Volts monitor | 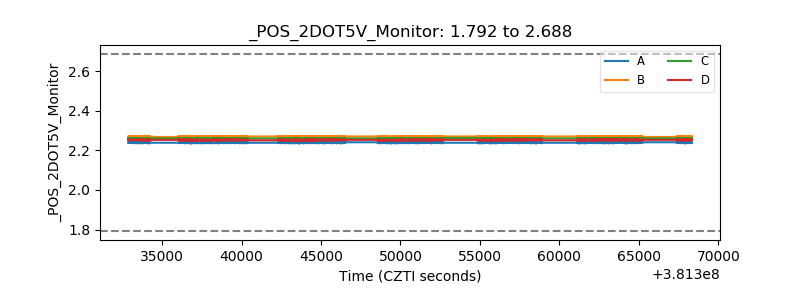 |
| +5 Volts monitor | 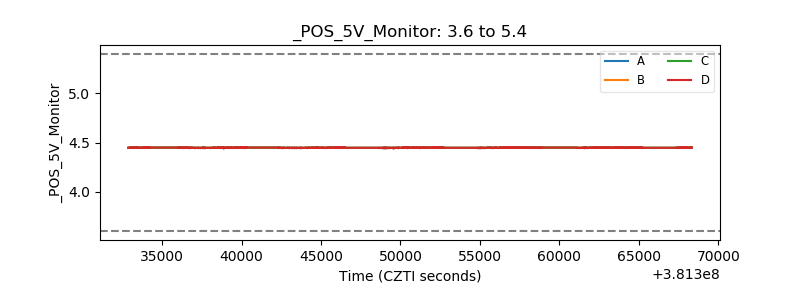 |
| _ROLL_ROT | 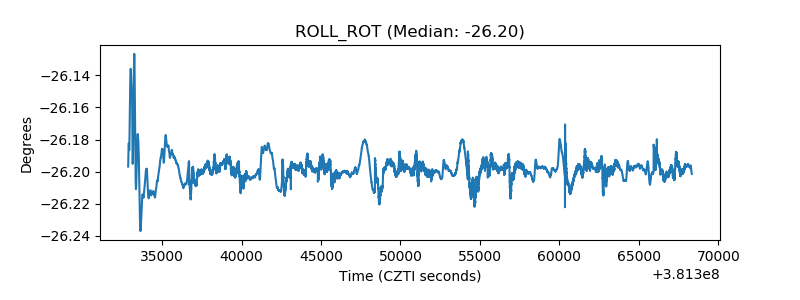 |
| _Roll_DEC | 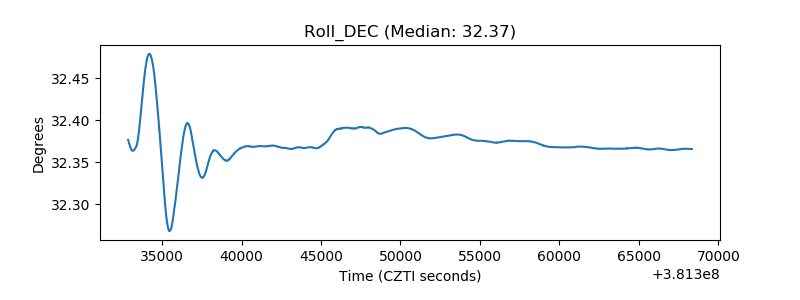 |
| _Roll_RA | 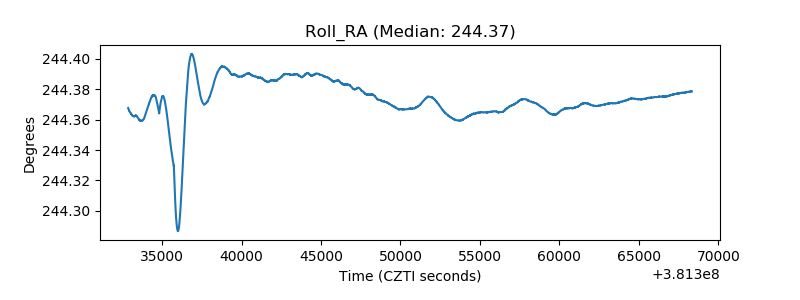 |
| Veto Counter | 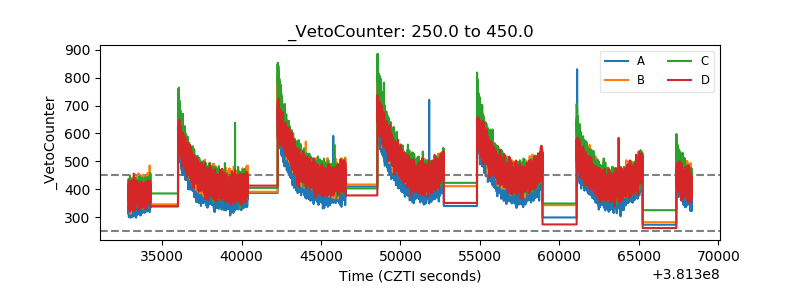 |