| Param | Original file | Final file |
|---|---|---|
| Filename | modeM0/AS1T04_086T01_9000004890_34303cztM0_level2.evt | modeM0/AS1T04_086T01_9000004890_34303cztM0_level2_quad_clean.evt |
| Size (bytes) | 154,990,080 | 37,405,440 |
| Size | 147.8 MB | 35.7 MB |
| Events in quadrant A | 891,070 | 250,045 |
| Events in quadrant B | 1,125,569 | 251,378 |
| Events in quadrant C | 953,083 | 249,503 |
| Events in quadrant D | 1,589,135 | 239,326 |
| Mode M0 | |||
|---|---|---|---|
| Quadrant | BADHDUFLAG | Total packets | Discarded packets |
| A | 0 | 3986 | 0 |
| B | 0 | 4665 | 0 |
| C | 0 | 4018 | 0 |
| D | 0 | 6090 | 0 |
| Mode SS | |||
|---|---|---|---|
| Quadrant | BADHDUFLAG | Total packets | Discarded packets |
| A | 0 | 40 | 0 |
| B | 0 | 40 | 0 |
| C | 0 | 40 | 0 |
| D | 0 | 40 | 0 |
| Quadrant | Total seconds | Saturated seconds | Saturation percentage |
|---|---|---|---|
| A | 1949 | 3 | 0.153925% |
| B | 1949 | 17 | 0.872242% |
| C | 1949 | 2 | 0.102617% |
| D | 1949 | 40 | 2.052335% |
Noise dominated data is calculated using 1-second bins in cleaned event files. If a bin has >2000 counts, and if more than 50% of those come from <1% of pixels, then it is considered to be noise-dominated and hence unusable.
| Quadrant | # 1 sec bins | Bins with >0 counts | Bins with >2000 counts | High rate bins dominated by noise | Noise dominated (total time) | Noise dominated (detector-on time) | Marked lightcurve |
|---|---|---|---|---|---|---|---|
| A | 1949 | 1949 | 2 | 2 | 0.10% | 0.10% | 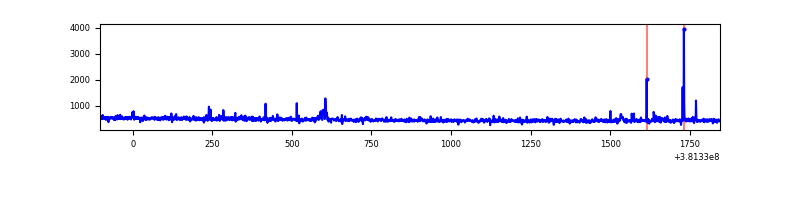 |
| B | 1949 | 1949 | 11 | 11 | 0.56% | 0.56% | 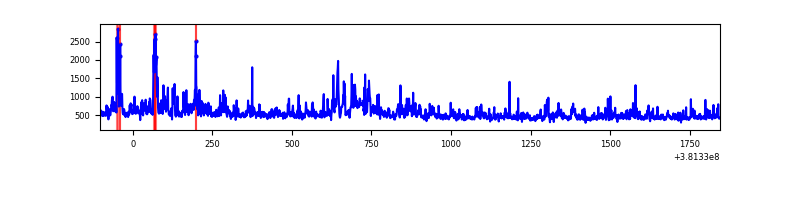 |
| C | 1949 | 1949 | 3 | 3 | 0.15% | 0.15% | 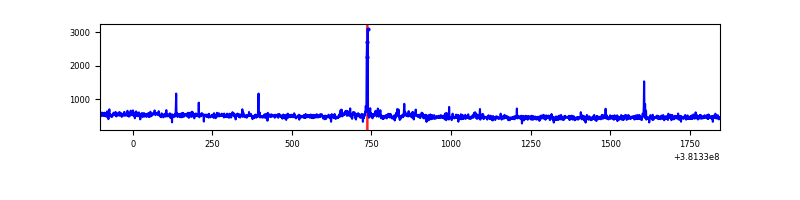 |
| D | 1949 | 1949 | 31 | 31 | 1.59% | 1.59% | 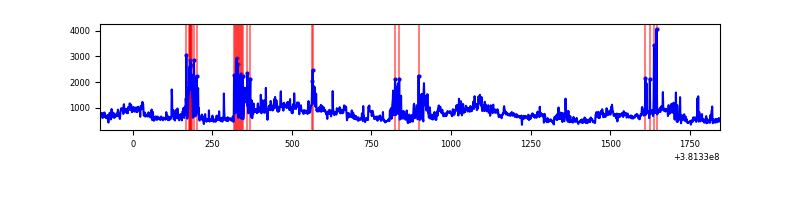 |
Top three noisy pixels from each quadrant. If the there are fewer than three noisy pixels in the level2.evt file, extra rows are filled as -1
| Pixel properties | Quadrant properties | ||||||
|---|---|---|---|---|---|---|---|
| Quadrant | DetID | PixID | Counts | Sigma | Mean | Median | Sigma |
| A | 7 | 16 | 26836 | 584.13 | 219 | 215 | 45.6 |
| A | 13 | 6 | 6485 | 137.58 | 219 | 215 | 45.6 |
| A | 10 | 83 | 4017 | 83.43 | 219 | 215 | 45.6 |
| B | 4 | 251 | 77715 | 1791.23 | 216 | 211 | 43.3 |
| B | 5 | 172 | 64647 | 1489.21 | 216 | 211 | 43.3 |
| B | 5 | 31 | 62206 | 1432.8 | 216 | 211 | 43.3 |
| C | 15 | 214 | 81853 | 1627.71 | 213 | 215 | 50.2 |
| C | 14 | 254 | 26571 | 525.49 | 213 | 215 | 50.2 |
| C | 9 | 187 | 8300 | 161.2 | 213 | 215 | 50.2 |
| D | 8 | 195 | 323636 | 5728.85 | 214 | 210 | 56.5 |
| D | 12 | 235 | 134010 | 2370.0 | 214 | 210 | 56.5 |
| D | 2 | 249 | 129609 | 2292.05 | 214 | 210 | 56.5 |
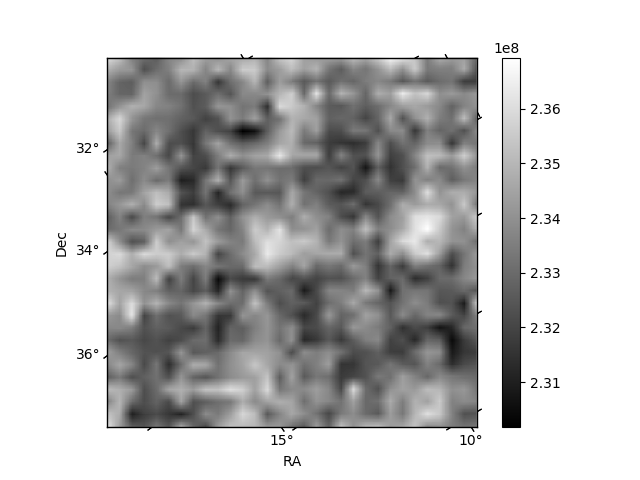
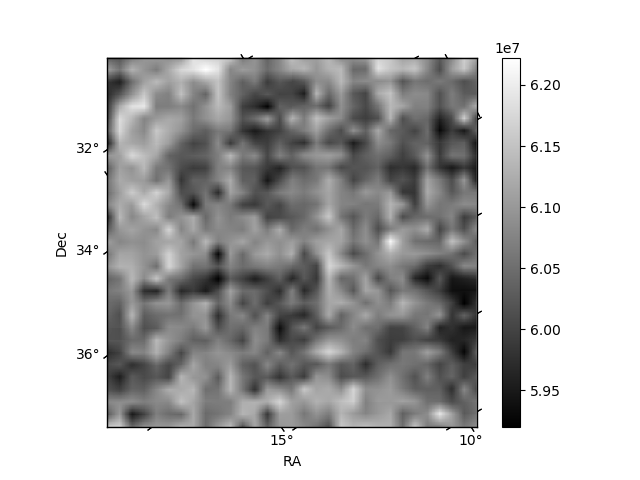
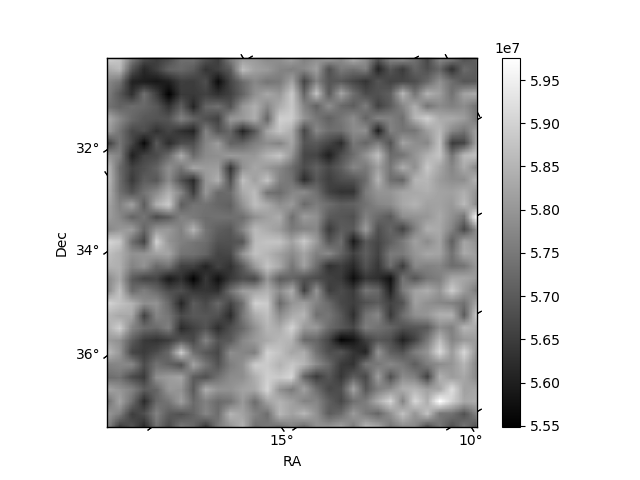
Histogram calculated using DETX and DETY for each event in the final _common_clean file
| Quadrant A | 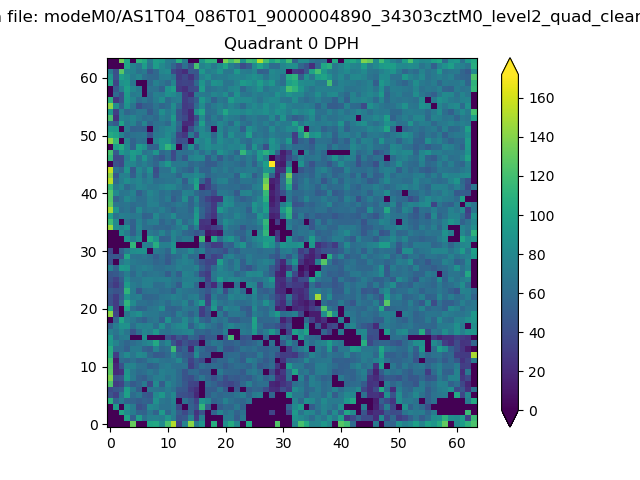 |
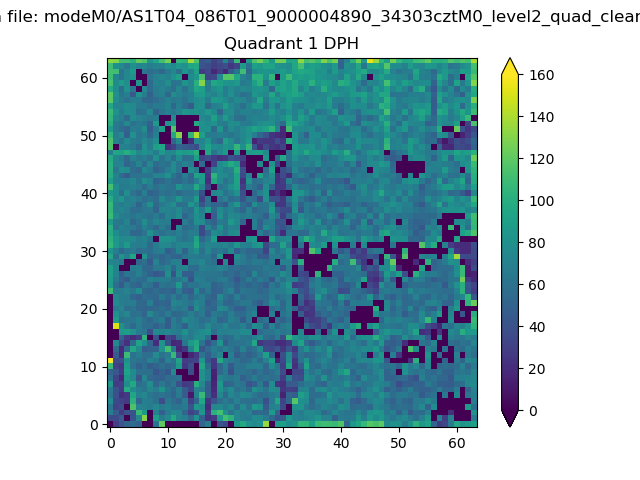 |
Quadrant B |
|---|---|---|---|
| Quadrant D |  |
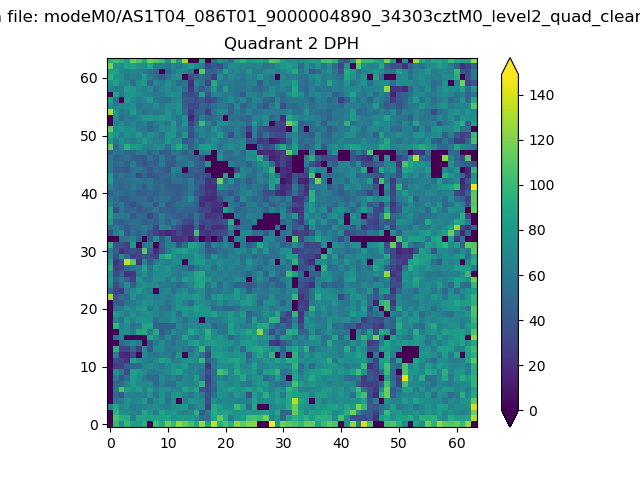 |
Quadrant C |
| Plot type | Count rate plots | Images |
|---|---|---|
| Comparison with Poisson distribution Blue bars denote a histogram of data divided into 1 sec bins. Red curve is a Poisson curve with rate = median count rate of data. |
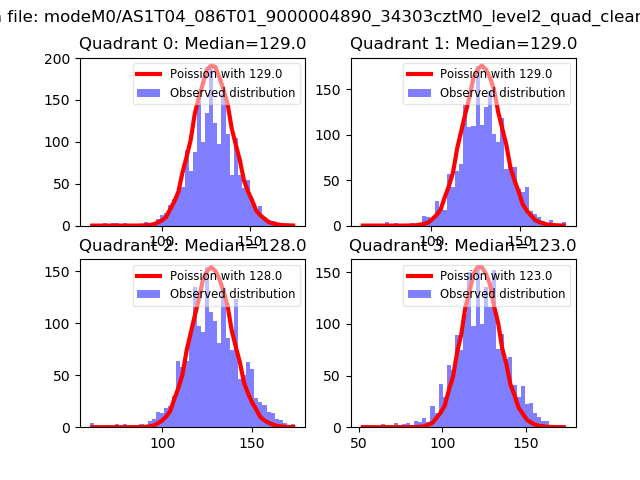 |
 |
| Quadrant-wise count rates Data is divided into 100 sec bins |
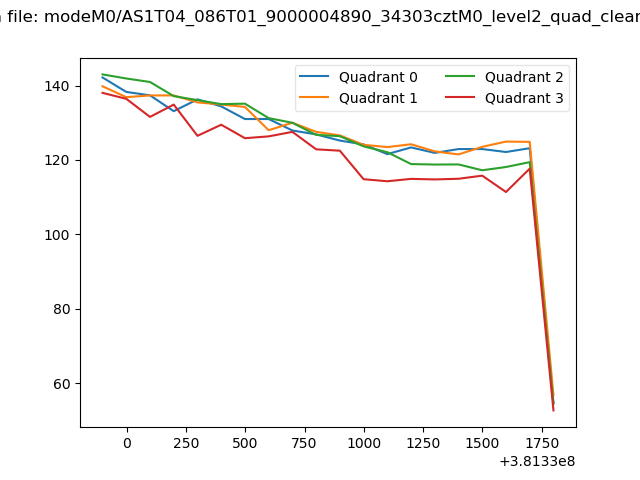 |
|
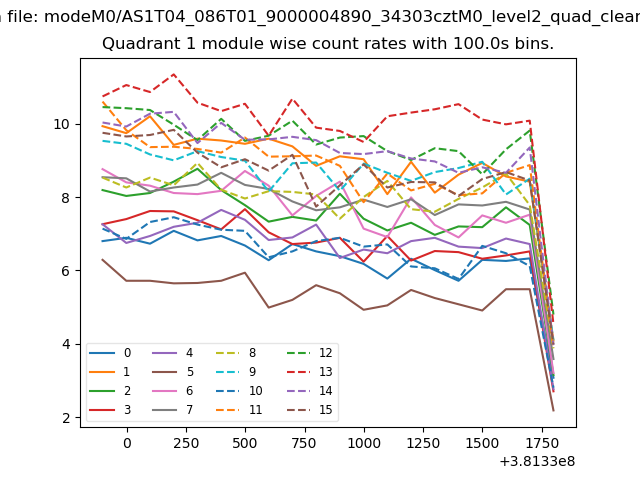
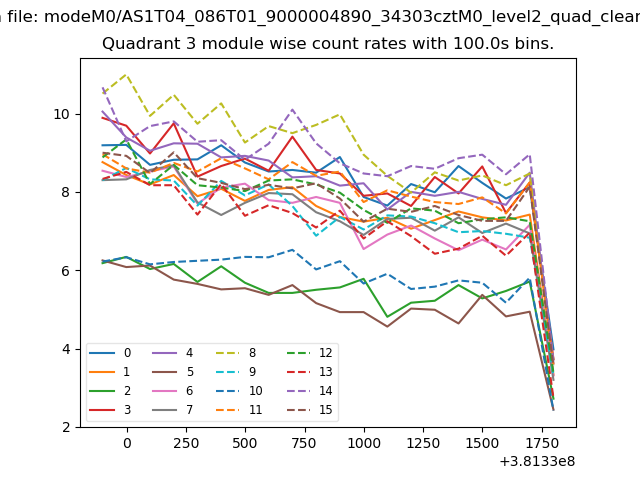
| Module-wise count rates for Quadrant A Data is divided into 100 sec bins |
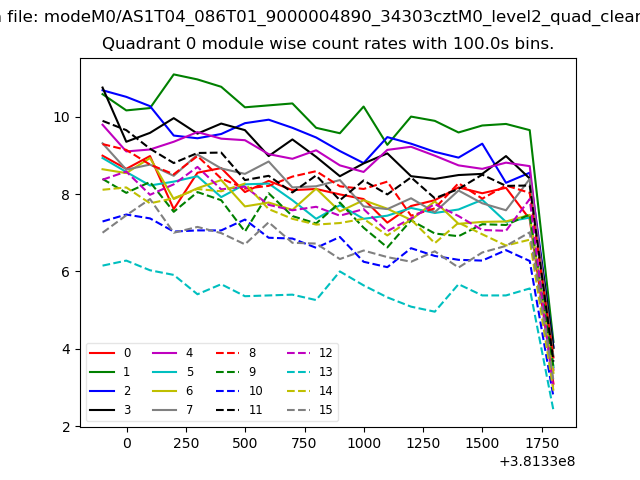 |
 |
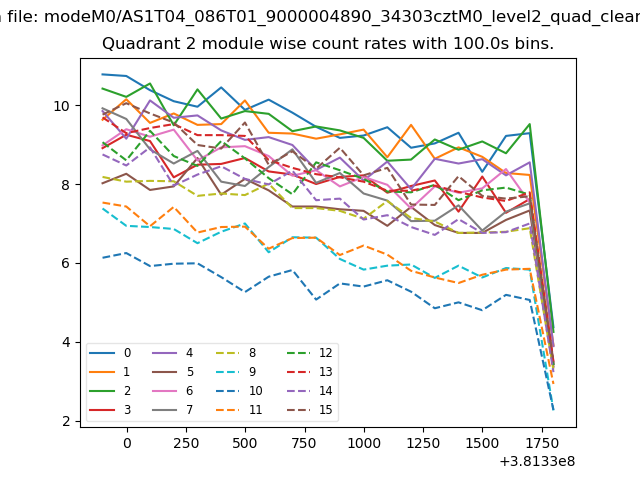
| Module-wise count rates for Quadrant B Data is divided into 100 sec bins |
 |
 |
| Module-wise count rates for Quadrant C Data is divided into 100 sec bins |
 |
 |
| Module-wise count rates for Quadrant D Data is divided into 100 sec bins |
 |
 |
| Parameter | Plot |
|---|---|
| CZT HV Monitor | 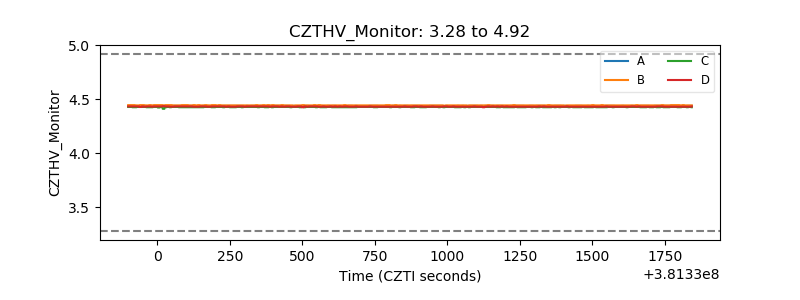 |
| D_VDD | 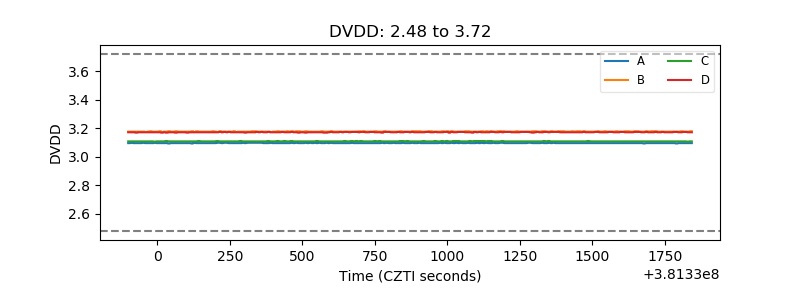 |
| Temperature 1 | 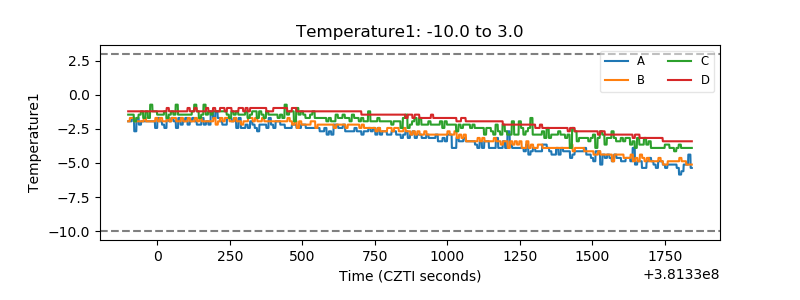 |
| Veto HV Monitor | 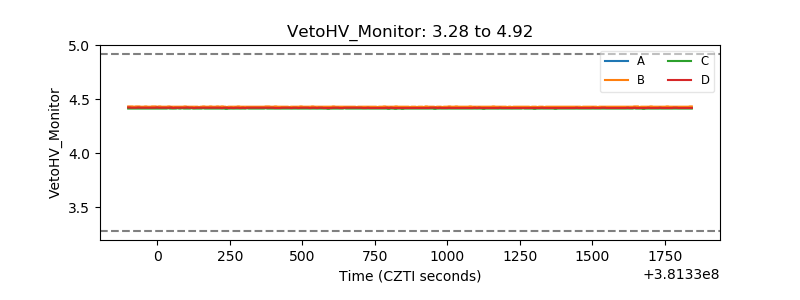 |
| Veto LLD | 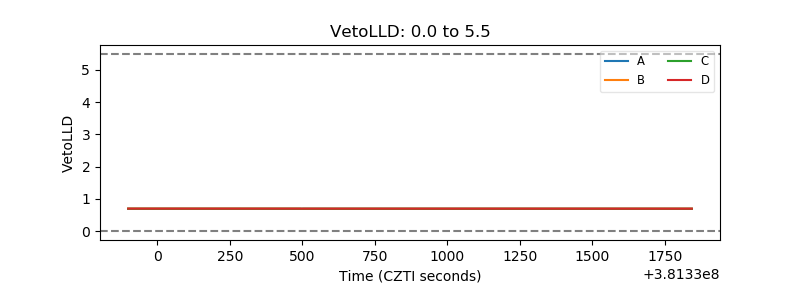 |
| Alpha Counter | 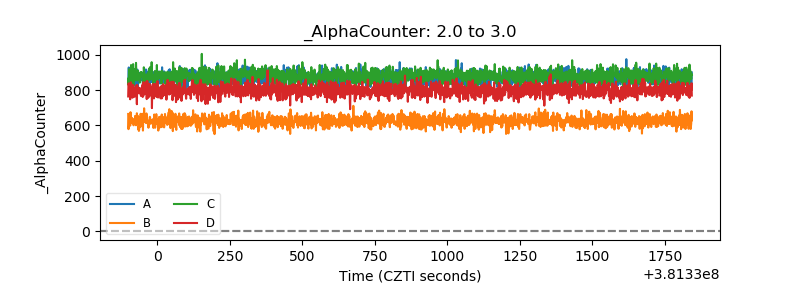 |
| _CPM_Rate | 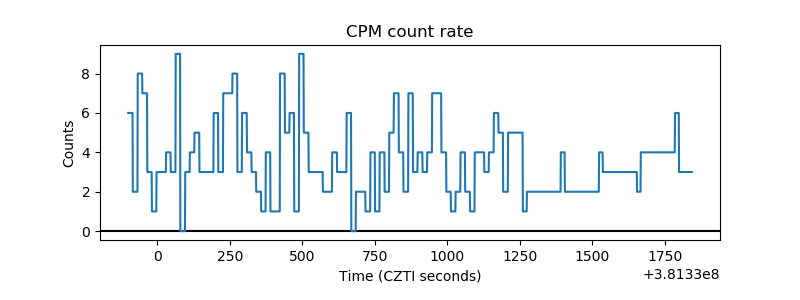 |
| CZT Counter | 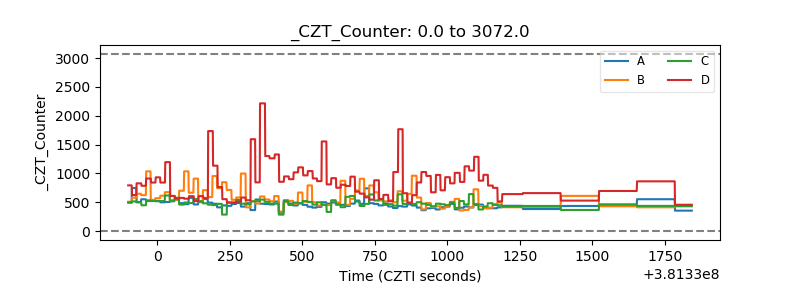 |
| +2.5 Volts monitor | 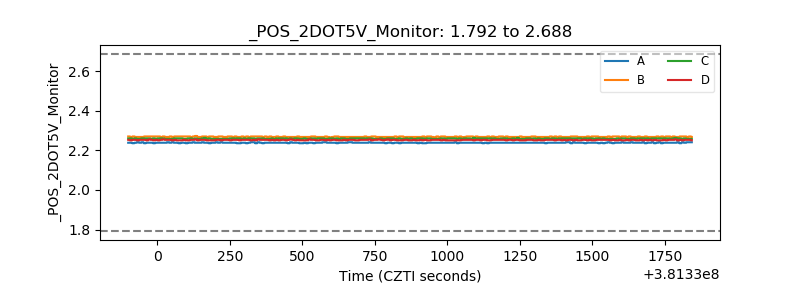 |
| +5 Volts monitor | 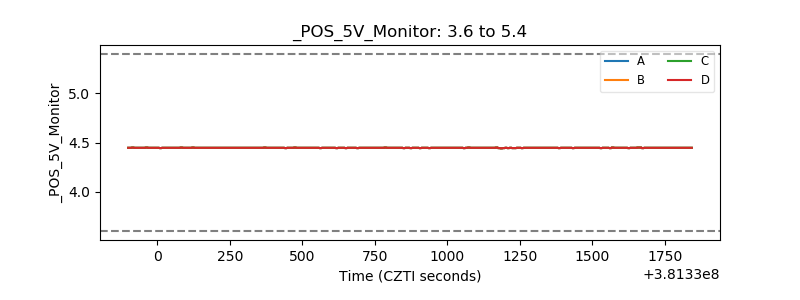 |
| _ROLL_ROT | 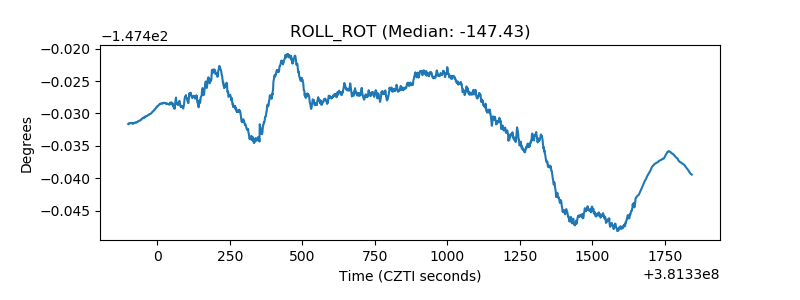 |
| _Roll_DEC | 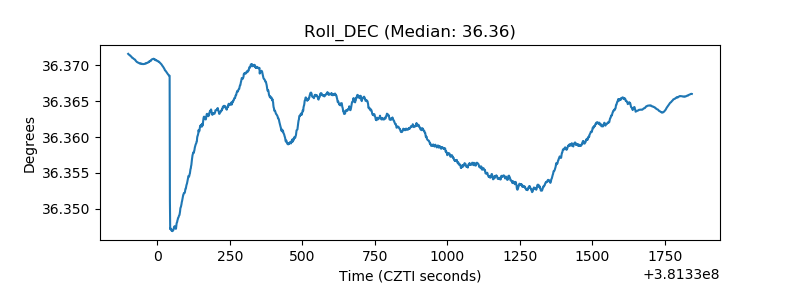 |
| _Roll_RA | 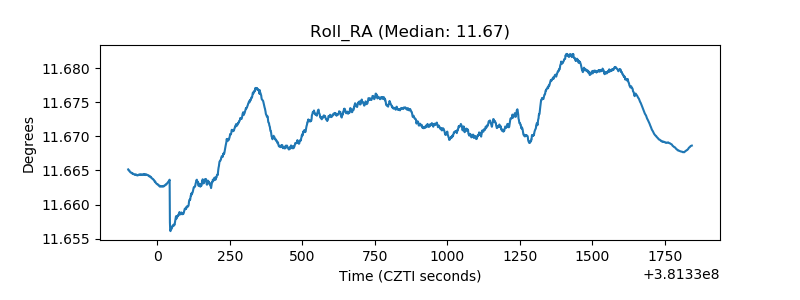 |
| Veto Counter | 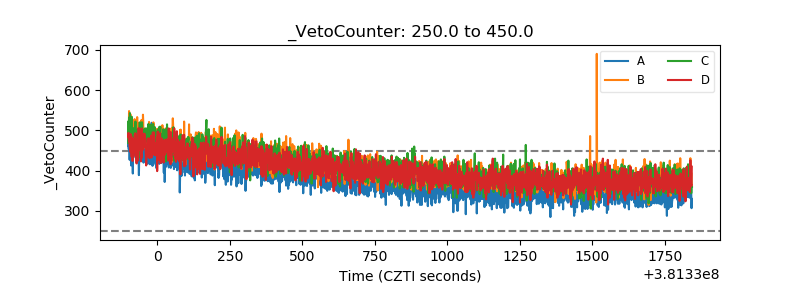 |