| Param | Original file | Final file |
|---|---|---|
| Filename | modeM0/AS1T04_086T01_9000004890_34301cztM0_level2.evt | modeM0/AS1T04_086T01_9000004890_34301cztM0_level2_quad_clean.evt |
| Size (bytes) | 2,073,360,960 | 358,928,640 |
| Size | 1.9 GB | 342.3 MB |
| Events in quadrant A | 11,616,637 | 2,302,188 |
| Events in quadrant B | 16,017,842 | 2,300,129 |
| Events in quadrant C | 13,021,228 | 2,352,888 |
| Events in quadrant D | 20,452,896 | 2,197,034 |
| Mode M0 | |||
|---|---|---|---|
| Quadrant | BADHDUFLAG | Total packets | Discarded packets |
| A | 0 | 51037 | 6 |
| B | 0 | 63582 | 5 |
| C | 0 | 53348 | 5 |
| D | 0 | 78144 | 5 |
| Mode SS | |||
|---|---|---|---|
| Quadrant | BADHDUFLAG | Total packets | Discarded packets |
| A | 0 | 508 | 0 |
| B | 0 | 508 | 0 |
| C | 0 | 508 | 0 |
| D | 0 | 508 | 0 |
| Mode M9 | |||
|---|---|---|---|
| Quadrant | BADHDUFLAG | Total packets | Discarded packets |
| A | 0 | 69 | 0 |
| B | 0 | 69 | 0 |
| C | 0 | 69 | 0 |
| D | 0 | 70 | 0 |
| Quadrant | Total seconds | Saturated seconds | Saturation percentage |
|---|---|---|---|
| A | 24998 | 48 | 0.192015% |
| B | 24998 | 1003 | 4.012321% |
| C | 24998 | 135 | 0.540043% |
| D | 24998 | 1064 | 4.256341% |
Noise dominated data is calculated using 1-second bins in cleaned event files. If a bin has >2000 counts, and if more than 50% of those come from <1% of pixels, then it is considered to be noise-dominated and hence unusable.
| Quadrant | # 1 sec bins | Bins with >0 counts | Bins with >2000 counts | High rate bins dominated by noise | Noise dominated (total time) | Noise dominated (detector-on time) | Marked lightcurve |
|---|---|---|---|---|---|---|---|
| A | 38527 | 25003 | 16 | 16 | 0.04% | 0.06% | 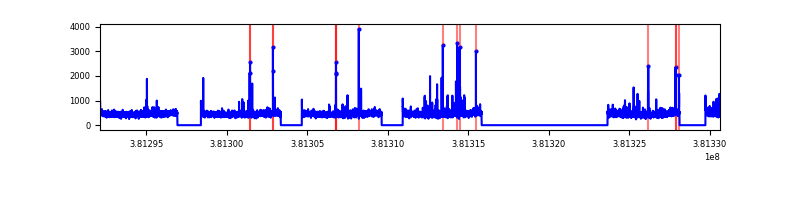 |
| B | 38527 | 25003 | 672 | 672 | 1.74% | 2.69% | 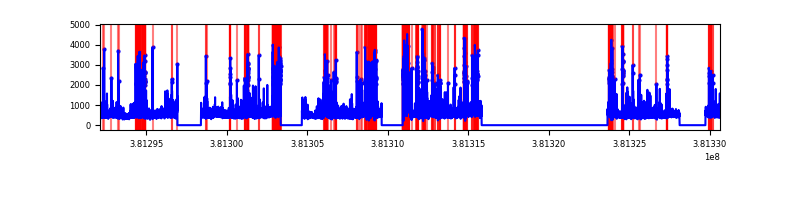 |
| C | 38527 | 25003 | 87 | 87 | 0.23% | 0.35% |  |
| D | 38527 | 25003 | 909 | 909 | 2.36% | 3.64% | 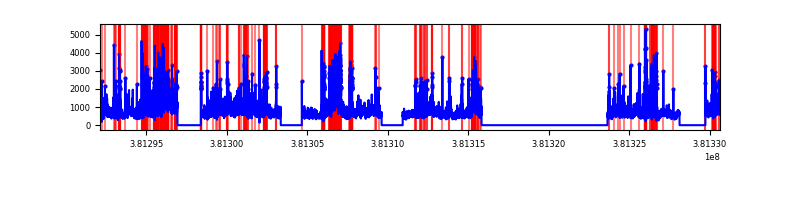 |
Top three noisy pixels from each quadrant. If the there are fewer than three noisy pixels in the level2.evt file, extra rows are filled as -1
| Pixel properties | Quadrant properties | ||||||
|---|---|---|---|---|---|---|---|
| Quadrant | DetID | PixID | Counts | Sigma | Mean | Median | Sigma |
| A | 7 | 16 | 165582 | 285.1 | 2880 | 2819 | 570.9 |
| A | 9 | 143 | 145994 | 250.79 | 2880 | 2819 | 570.9 |
| A | 10 | 83 | 85739 | 145.24 | 2880 | 2819 | 570.9 |
| B | 5 | 172 | 2926453 | 5522.77 | 2823 | 2748 | 529.4 |
| B | 4 | 251 | 631712 | 1188.09 | 2823 | 2748 | 529.4 |
| B | 0 | 189 | 335019 | 627.65 | 2823 | 2748 | 529.4 |
| C | 15 | 214 | 1056309 | 1628.0 | 2830 | 2857 | 647.1 |
| C | 14 | 254 | 297826 | 455.84 | 2830 | 2857 | 647.1 |
| C | 0 | 10 | 200427 | 305.32 | 2830 | 2857 | 647.1 |
| D | 12 | 235 | 3063517 | 4079.06 | 2786 | 2732 | 750.4 |
| D | 8 | 195 | 2975281 | 3961.47 | 2786 | 2732 | 750.4 |
| D | 7 | 223 | 1742448 | 2318.49 | 2786 | 2732 | 750.4 |
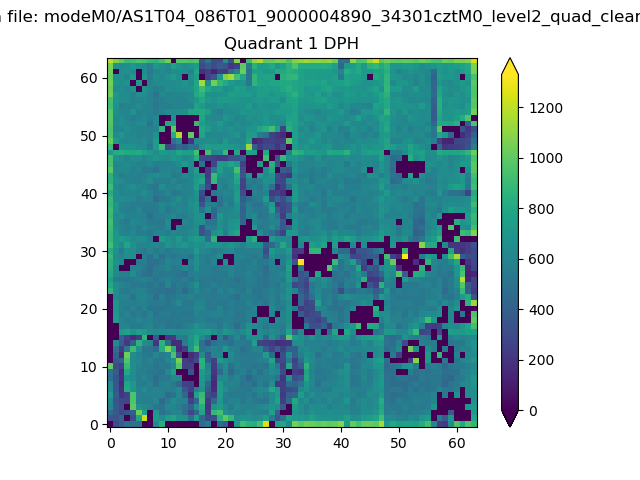
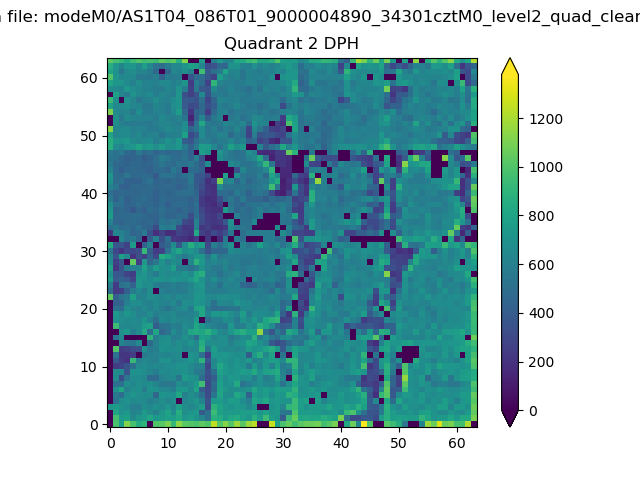
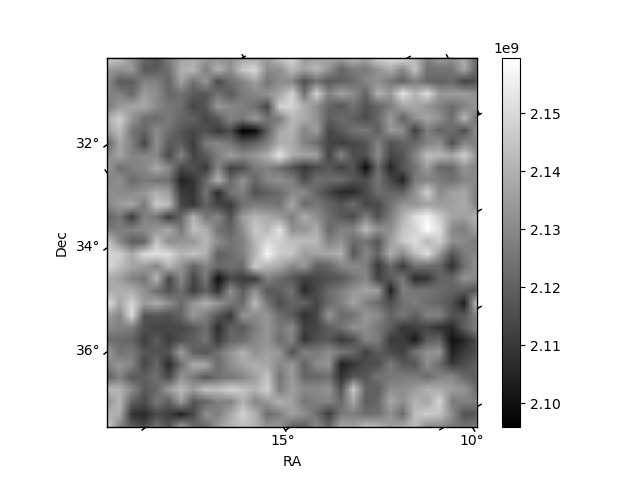
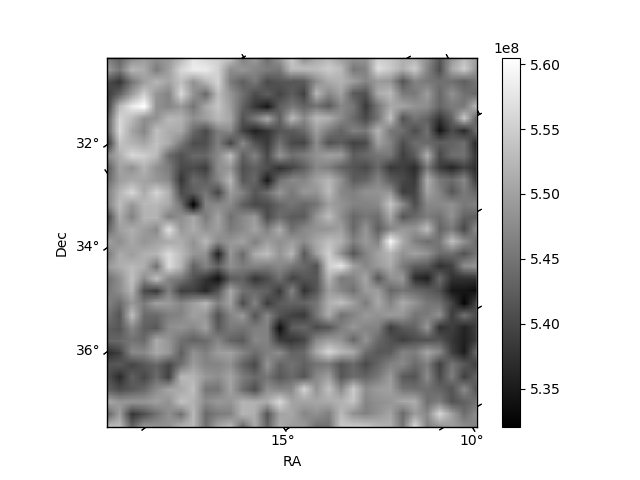
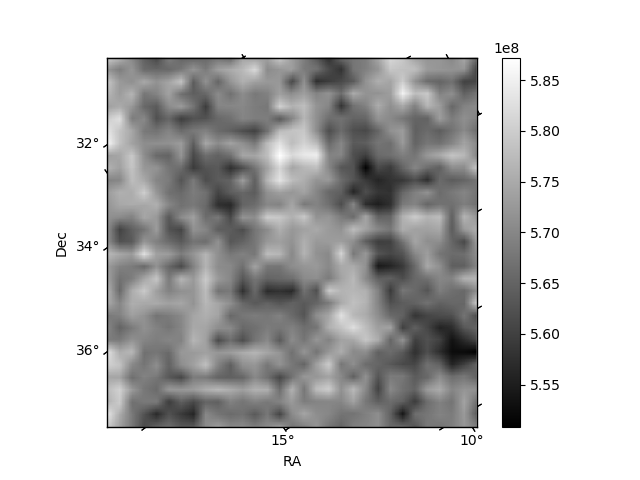
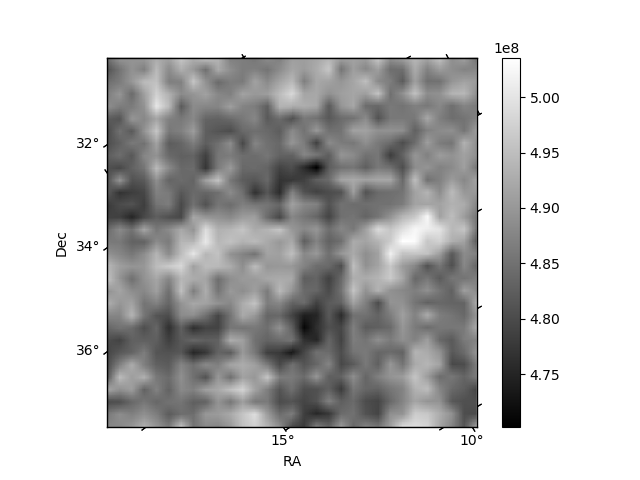
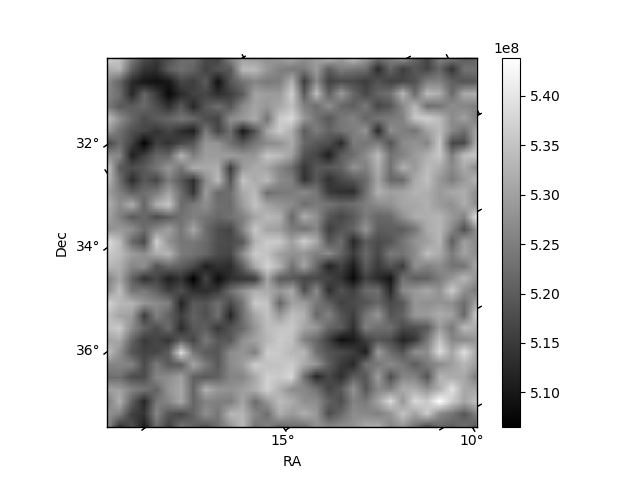
Histogram calculated using DETX and DETY for each event in the final _common_clean file
| Quadrant A | 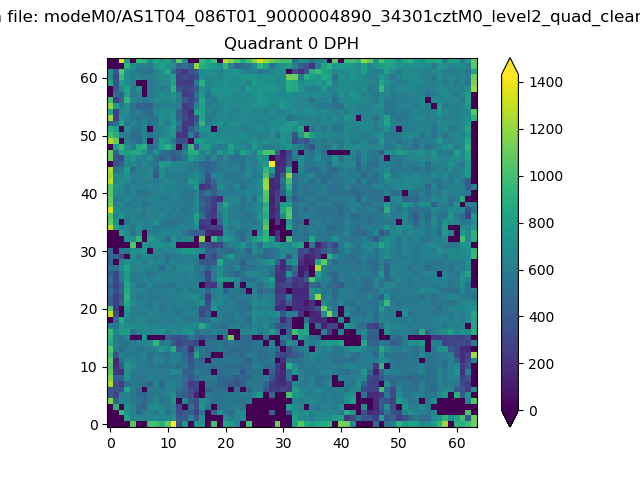 |
 |
Quadrant B |
|---|---|---|---|
| Quadrant D | 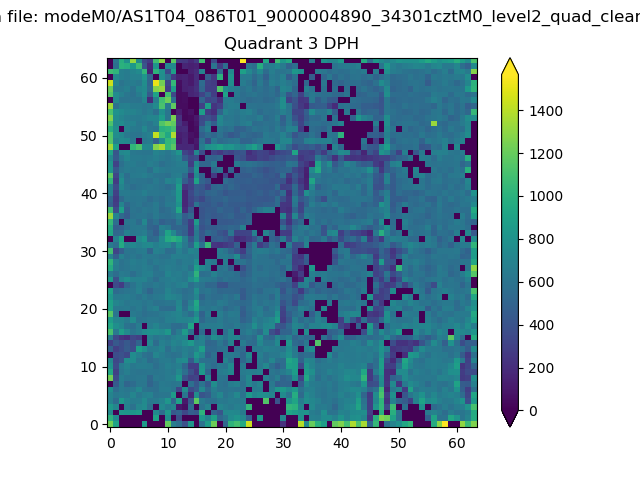 |
 |
Quadrant C |
| Plot type | Count rate plots | Images |
|---|---|---|
| Comparison with Poisson distribution Blue bars denote a histogram of data divided into 1 sec bins. Red curve is a Poisson curve with rate = median count rate of data. |
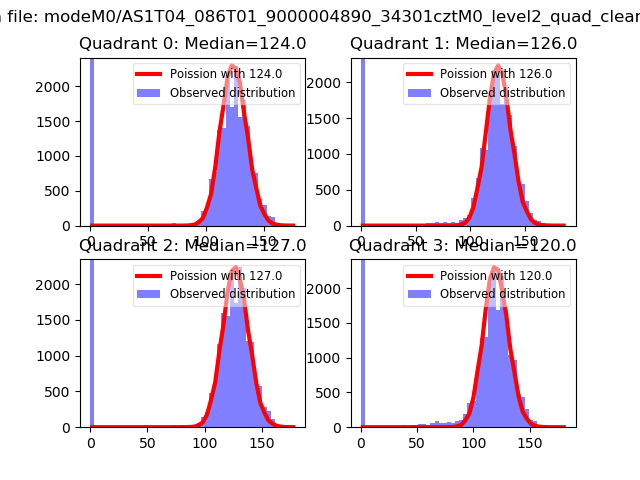 |
 |
| Quadrant-wise count rates Data is divided into 100 sec bins |
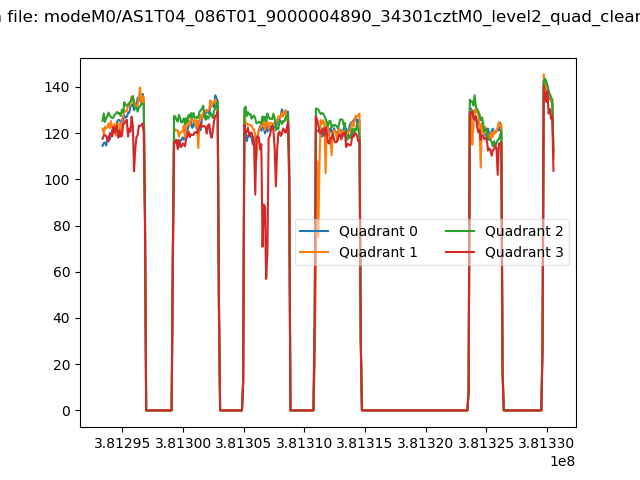 |
|
| Module-wise count rates for Quadrant A Data is divided into 100 sec bins |
 |
 |
| Module-wise count rates for Quadrant B Data is divided into 100 sec bins |
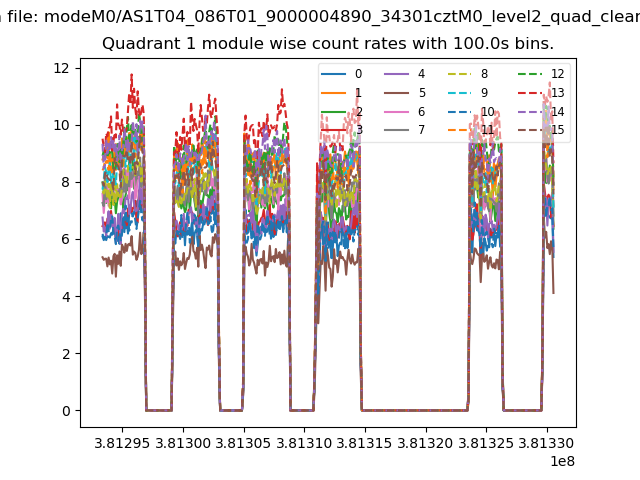 |
 |
| Module-wise count rates for Quadrant C Data is divided into 100 sec bins |
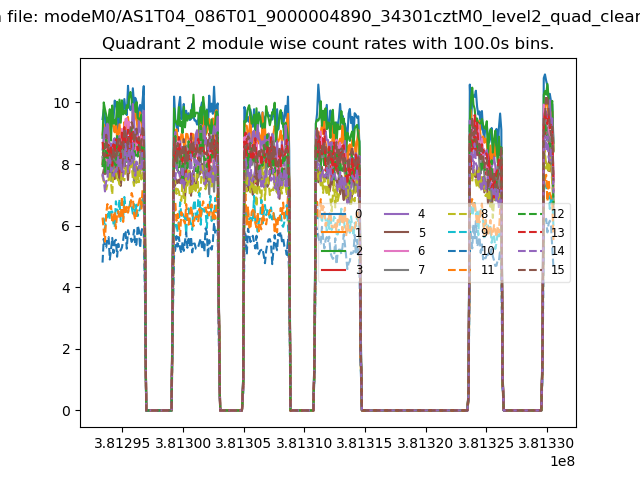 |
 |
| Module-wise count rates for Quadrant D Data is divided into 100 sec bins |
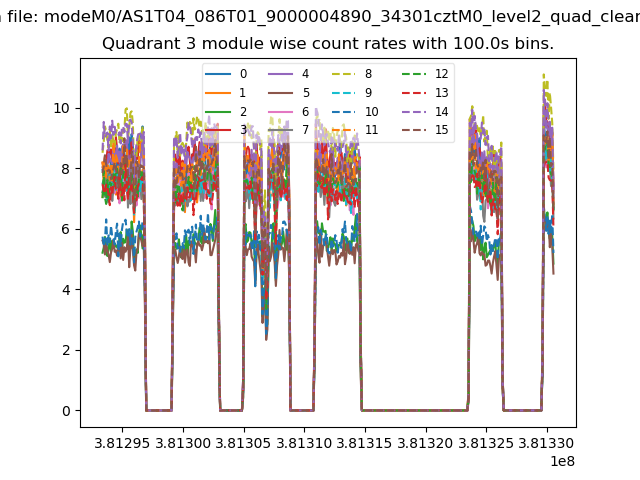 |
 |
| Parameter | Plot |
|---|---|
| CZT HV Monitor | 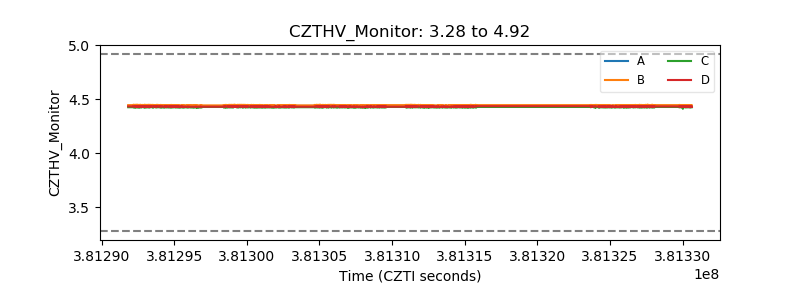 |
| D_VDD | 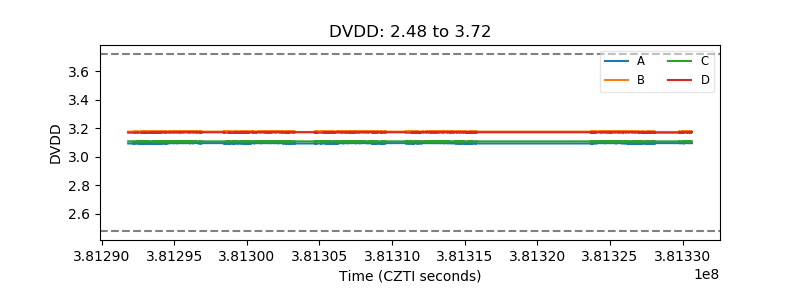 |
| Temperature 1 | 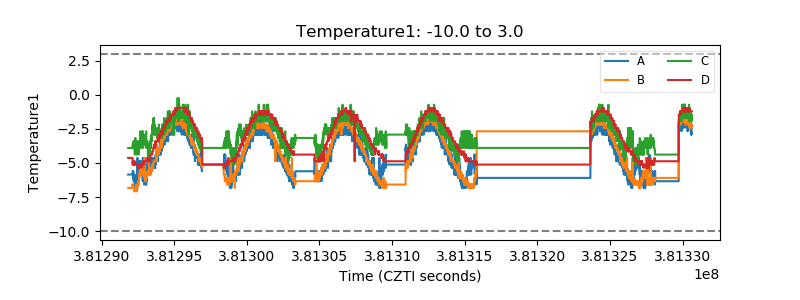 |
| Veto HV Monitor | 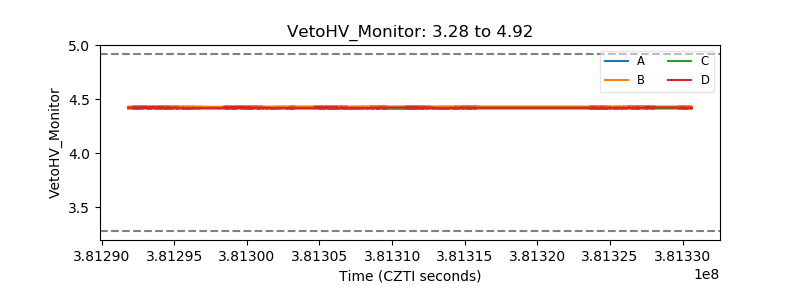 |
| Veto LLD | 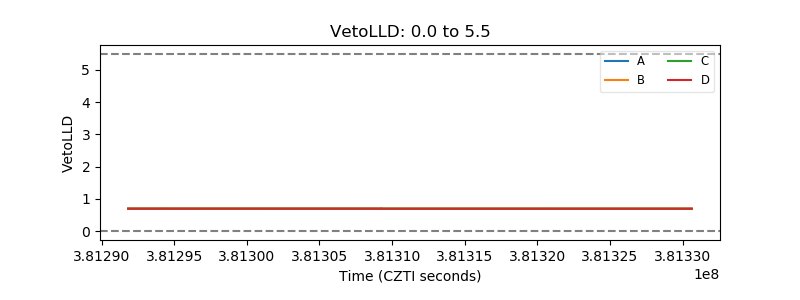 |
| Alpha Counter | 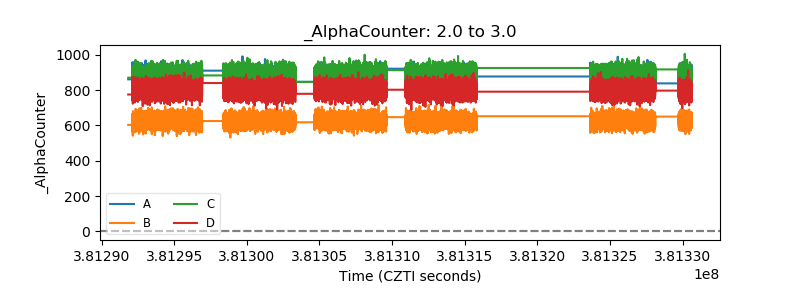 |
| _CPM_Rate | 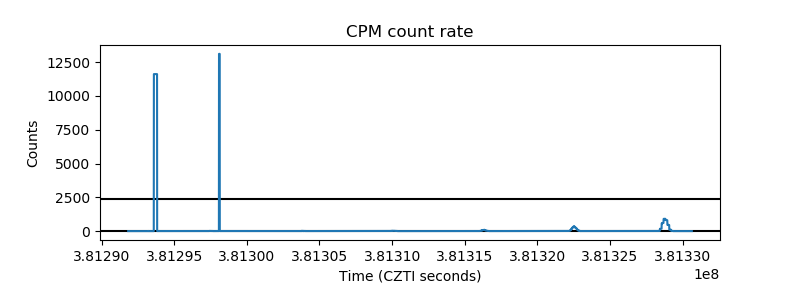 |
| CZT Counter | 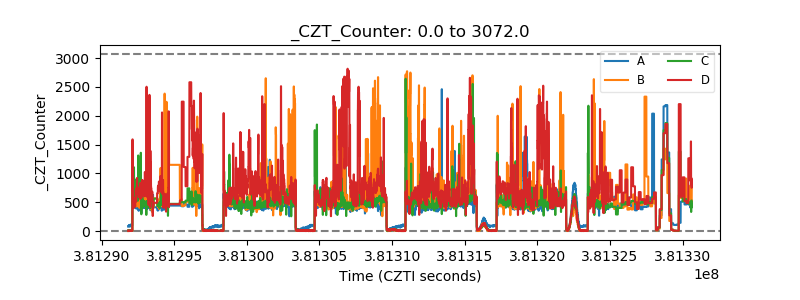 |
| +2.5 Volts monitor | 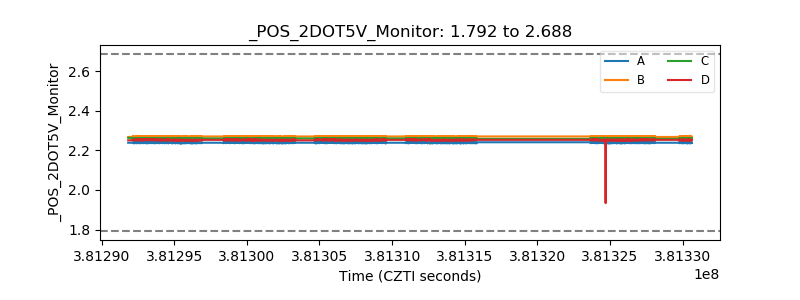 |
| +5 Volts monitor | 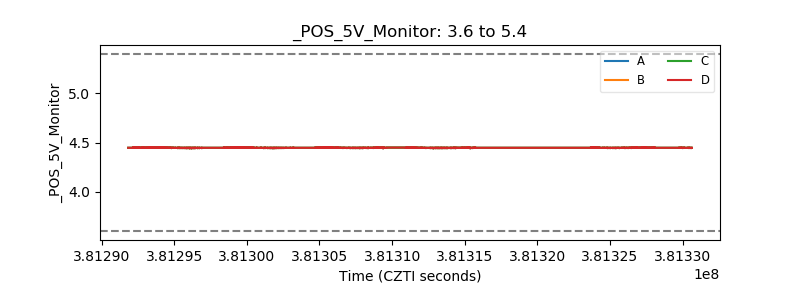 |
| _ROLL_ROT | 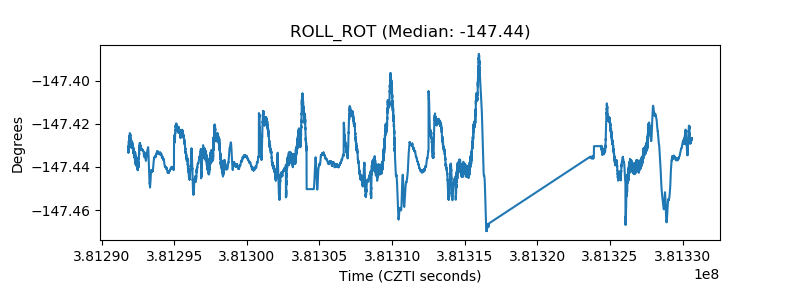 |
| _Roll_DEC | 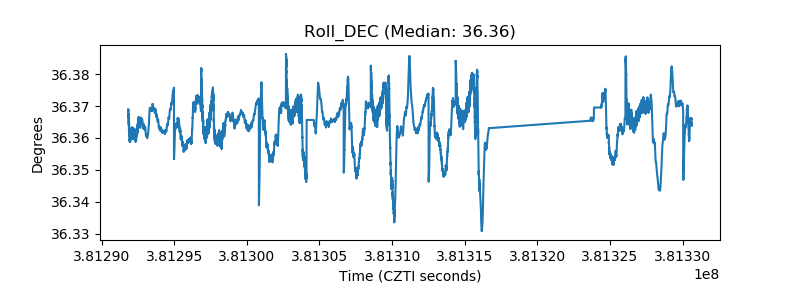 |
| _Roll_RA | 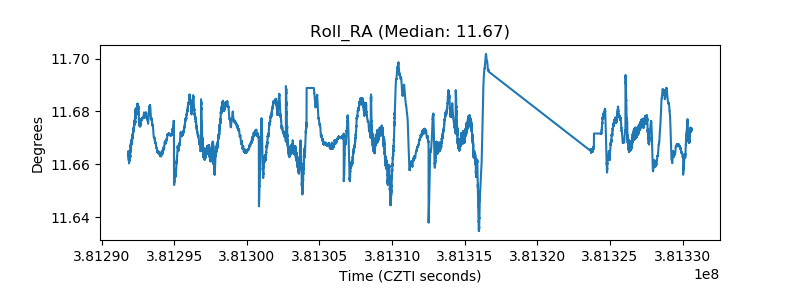 |
| Veto Counter | 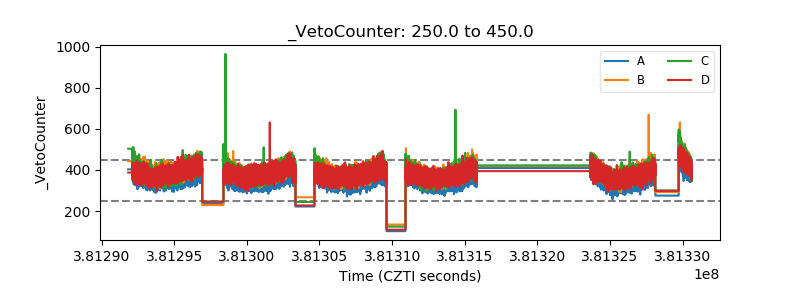 |