| Param | Original file | Final file |
|---|---|---|
| Filename | modeM0/AS1T04_086T01_9000004890_34300cztM0_level2.evt | modeM0/AS1T04_086T01_9000004890_34300cztM0_level2_quad_clean.evt |
| Size (bytes) | 1,328,040,000 | 227,194,560 |
| Size | 1.2 GB | 216.7 MB |
| Events in quadrant A | 7,615,558 | 1,460,075 |
| Events in quadrant B | 10,455,545 | 1,452,631 |
| Events in quadrant C | 8,347,316 | 1,494,273 |
| Events in quadrant D | 12,744,804 | 1,393,248 |
| Mode M0 | |||
|---|---|---|---|
| Quadrant | BADHDUFLAG | Total packets | Discarded packets |
| A | 0 | 32903 | 5 |
| B | 0 | 41169 | 4 |
| C | 0 | 34054 | 4 |
| D | 0 | 48573 | 4 |
| Mode SS | |||
|---|---|---|---|
| Quadrant | BADHDUFLAG | Total packets | Discarded packets |
| A | 0 | 318 | 0 |
| B | 0 | 318 | 0 |
| C | 0 | 318 | 0 |
| D | 0 | 318 | 0 |
| Mode M9 | |||
|---|---|---|---|
| Quadrant | BADHDUFLAG | Total packets | Discarded packets |
| A | 0 | 45 | 0 |
| B | 0 | 45 | 0 |
| C | 0 | 45 | 0 |
| D | 0 | 46 | 0 |
| Quadrant | Total seconds | Saturated seconds | Saturation percentage |
|---|---|---|---|
| A | 15669 | 33 | 0.210607% |
| B | 15669 | 788 | 5.029038% |
| C | 15669 | 134 | 0.855192% |
| D | 15669 | 1044 | 6.662837% |
Noise dominated data is calculated using 1-second bins in cleaned event files. If a bin has >2000 counts, and if more than 50% of those come from <1% of pixels, then it is considered to be noise-dominated and hence unusable.
| Quadrant | # 1 sec bins | Bins with >0 counts | Bins with >2000 counts | High rate bins dominated by noise | Noise dominated (total time) | Noise dominated (detector-on time) | Marked lightcurve |
|---|---|---|---|---|---|---|---|
| A | 19846 | 15672 | 11 | 11 | 0.06% | 0.07% |  |
| B | 19846 | 15672 | 518 | 518 | 2.61% | 3.31% | 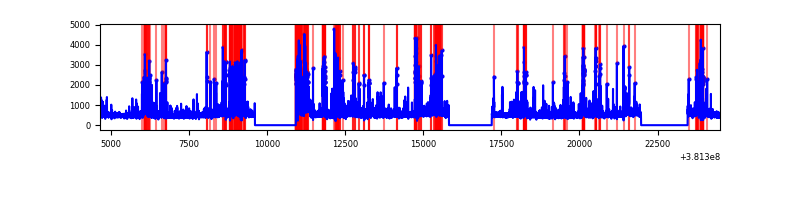 |
| C | 19846 | 15672 | 96 | 96 | 0.48% | 0.61% | 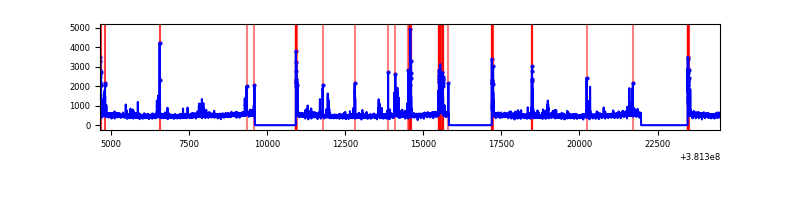 |
| D | 19846 | 15672 | 863 | 863 | 4.35% | 5.51% | 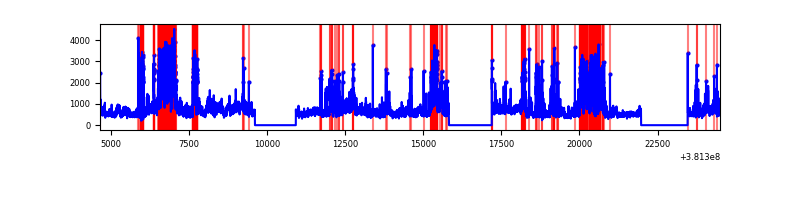 |
Top three noisy pixels from each quadrant. If the there are fewer than three noisy pixels in the level2.evt file, extra rows are filled as -1
| Pixel properties | Quadrant properties | ||||||
|---|---|---|---|---|---|---|---|
| Quadrant | DetID | PixID | Counts | Sigma | Mean | Median | Sigma |
| A | 15 | 47 | 303201 | 840.21 | 1805 | 1771 | 358.8 |
| A | 7 | 16 | 169935 | 468.74 | 1805 | 1771 | 358.8 |
| A | 10 | 83 | 62229 | 168.52 | 1805 | 1771 | 358.8 |
| B | 5 | 172 | 2262439 | 6810.85 | 1762 | 1717 | 331.9 |
| B | 4 | 251 | 406699 | 1220.08 | 1762 | 1717 | 331.9 |
| B | 4 | 171 | 261957 | 784.02 | 1762 | 1717 | 331.9 |
| C | 15 | 214 | 661872 | 1629.19 | 1769 | 1787 | 405.2 |
| C | 14 | 254 | 333185 | 817.94 | 1769 | 1787 | 405.2 |
| C | 0 | 10 | 181255 | 442.96 | 1769 | 1787 | 405.2 |
| D | 8 | 195 | 1816341 | 3939.72 | 1735 | 1698 | 460.6 |
| D | 7 | 223 | 1460840 | 3167.9 | 1735 | 1698 | 460.6 |
| D | 10 | 118 | 1436038 | 3114.05 | 1735 | 1698 | 460.6 |
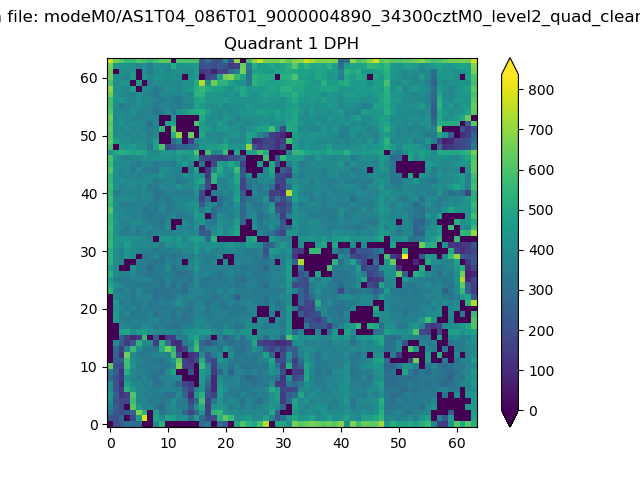
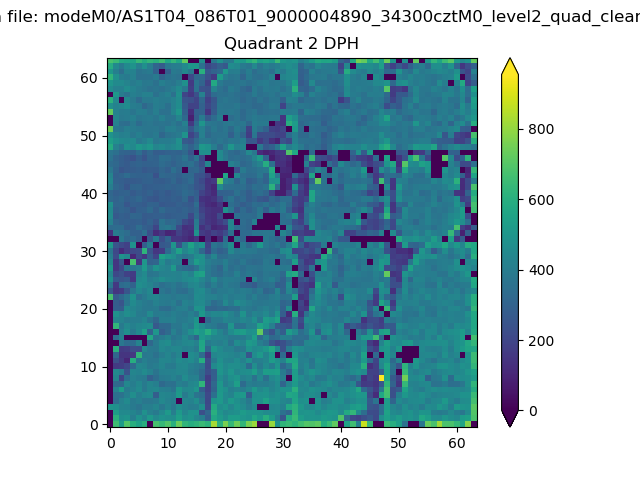
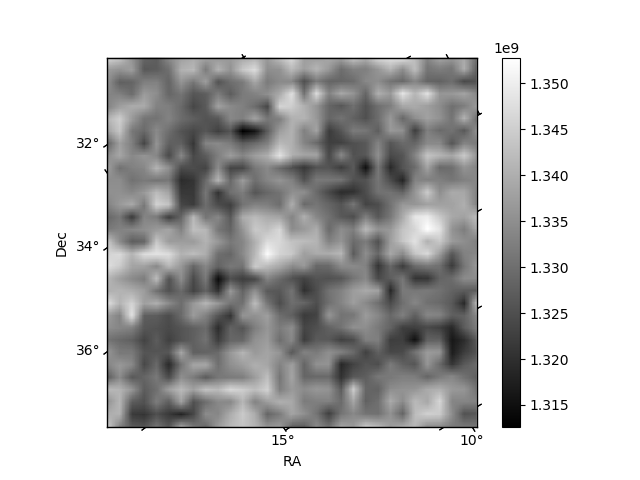
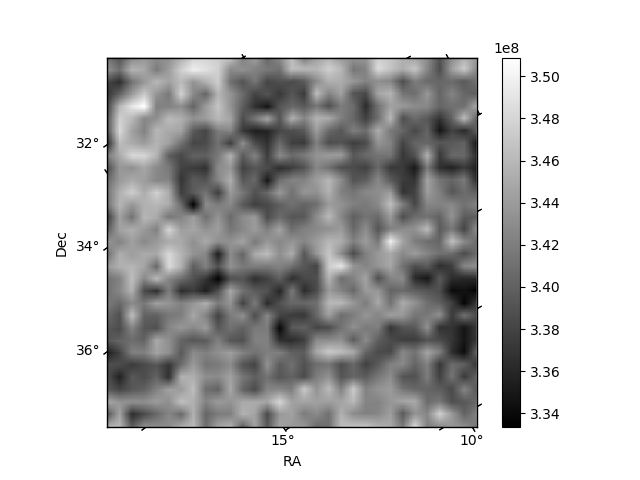
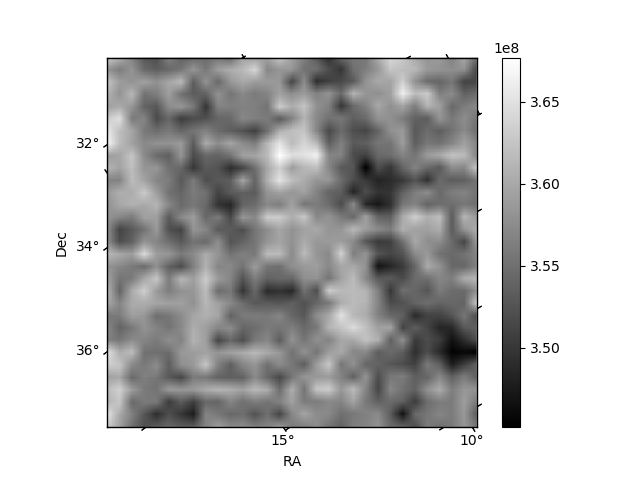
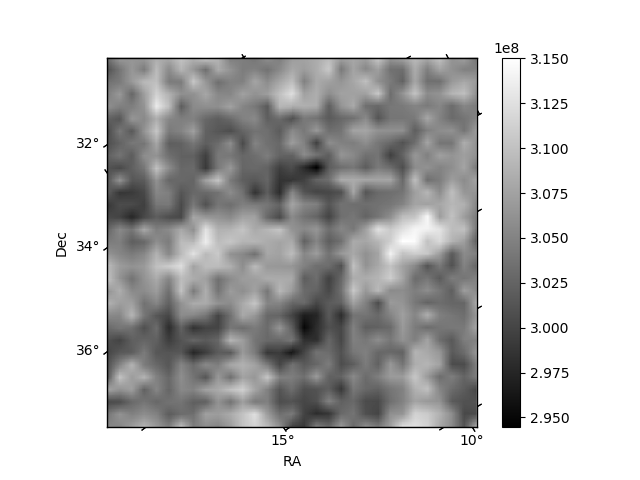
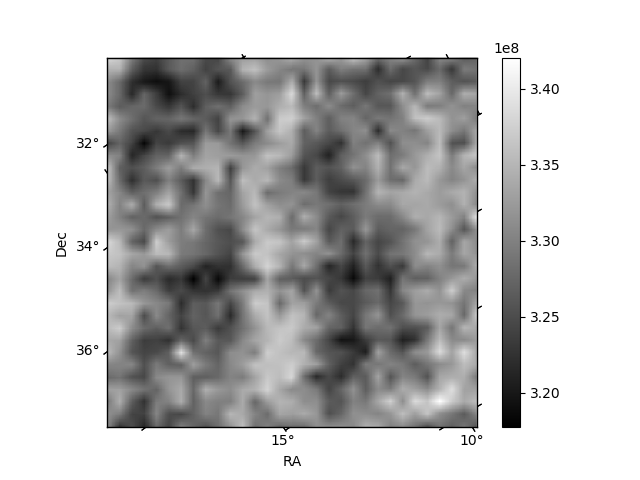
Histogram calculated using DETX and DETY for each event in the final _common_clean file
| Quadrant A | 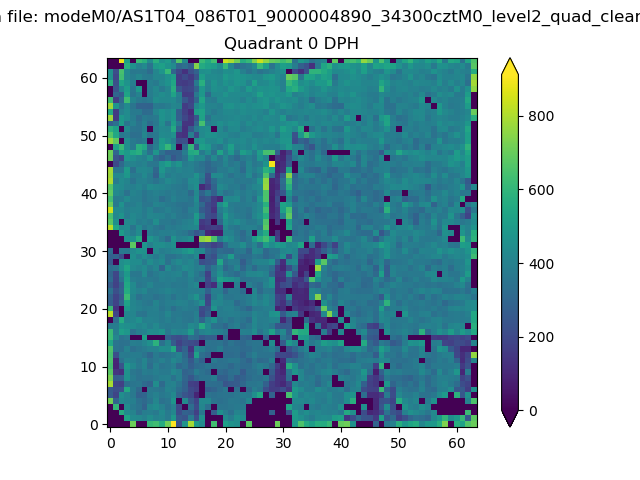 |
 |
Quadrant B |
|---|---|---|---|
| Quadrant D | 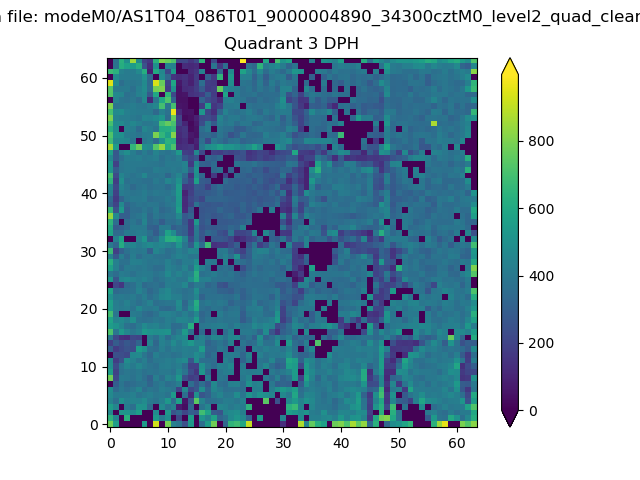 |
 |
Quadrant C |
| Plot type | Count rate plots | Images |
|---|---|---|
| Comparison with Poisson distribution Blue bars denote a histogram of data divided into 1 sec bins. Red curve is a Poisson curve with rate = median count rate of data. |
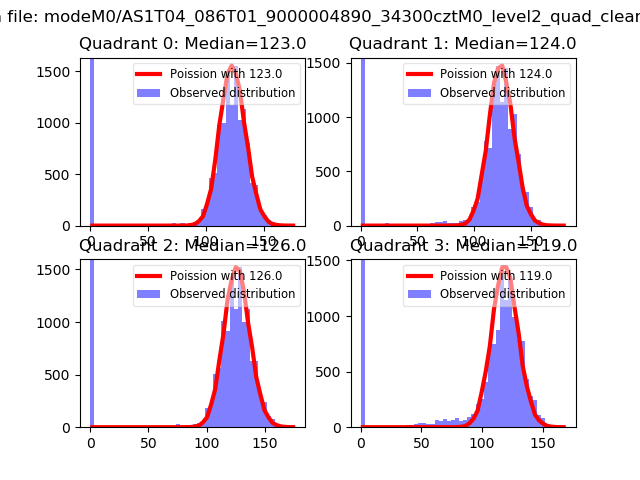 |
 |
| Quadrant-wise count rates Data is divided into 100 sec bins |
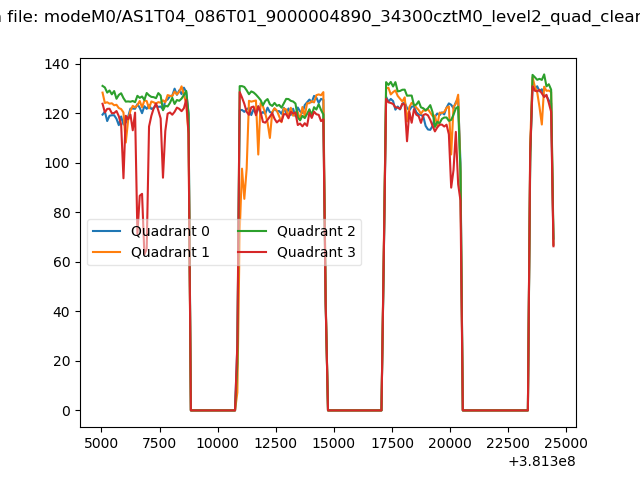 |
|
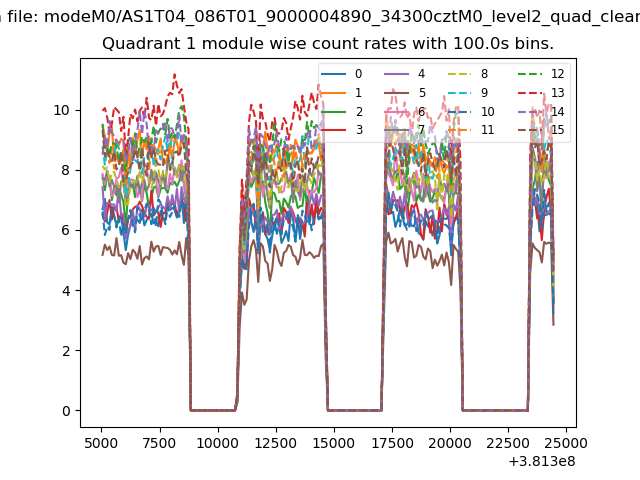
| Module-wise count rates for Quadrant A Data is divided into 100 sec bins |
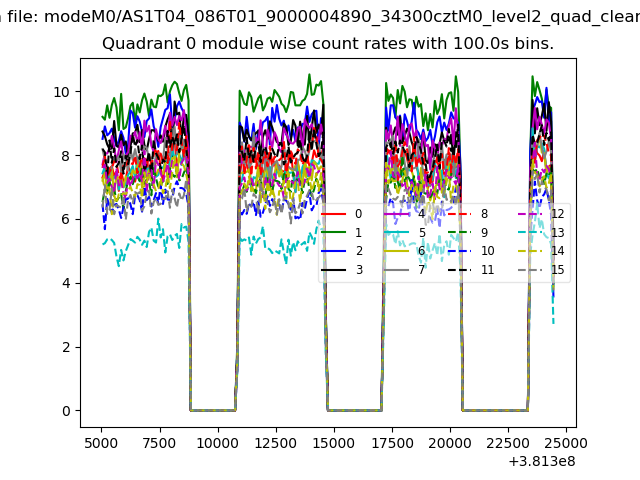 |
 |
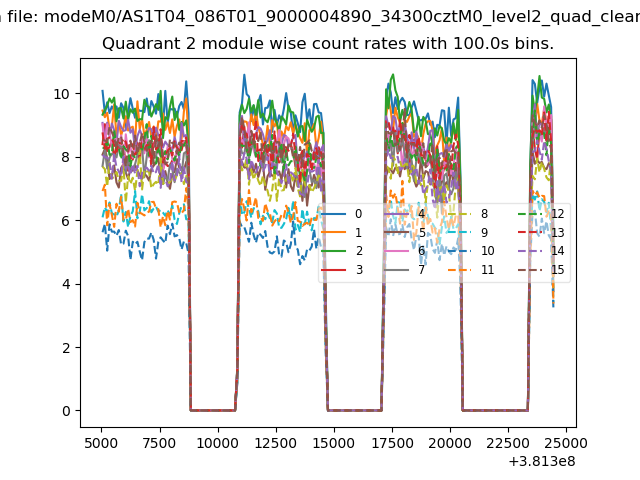
| Module-wise count rates for Quadrant B Data is divided into 100 sec bins |
 |
 |
| Module-wise count rates for Quadrant C Data is divided into 100 sec bins |
 |
 |
| Module-wise count rates for Quadrant D Data is divided into 100 sec bins |
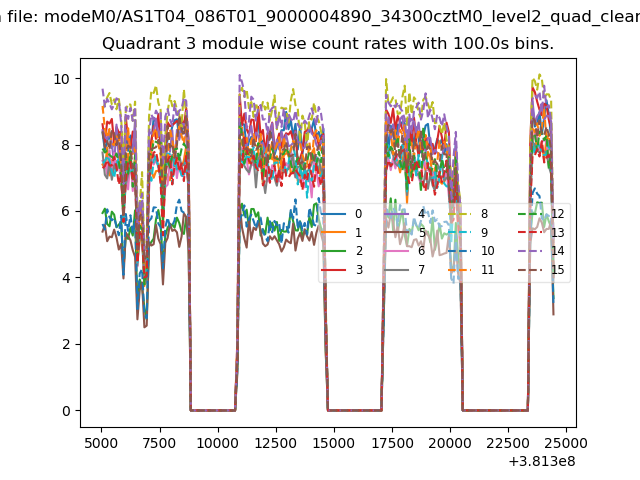 |
 |
| Parameter | Plot |
|---|---|
| CZT HV Monitor | 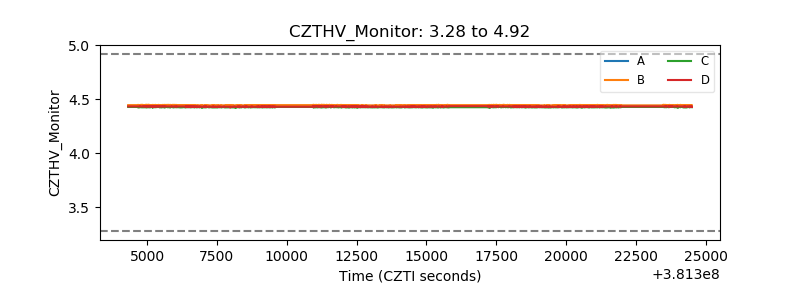 |
| D_VDD | 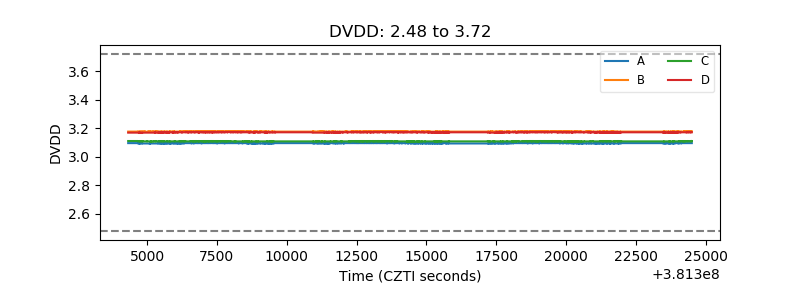 |
| Temperature 1 | 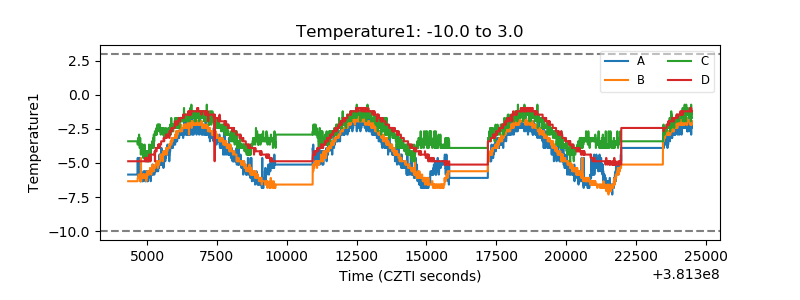 |
| Veto HV Monitor | 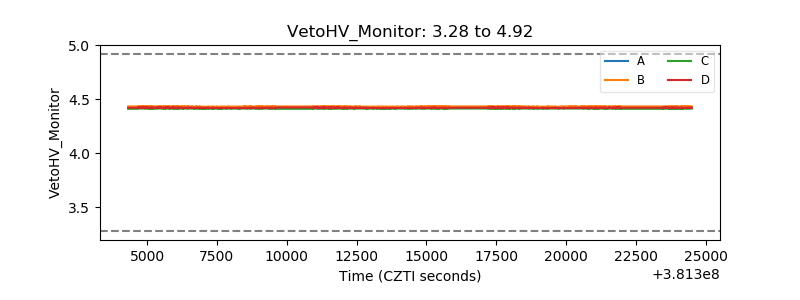 |
| Veto LLD | 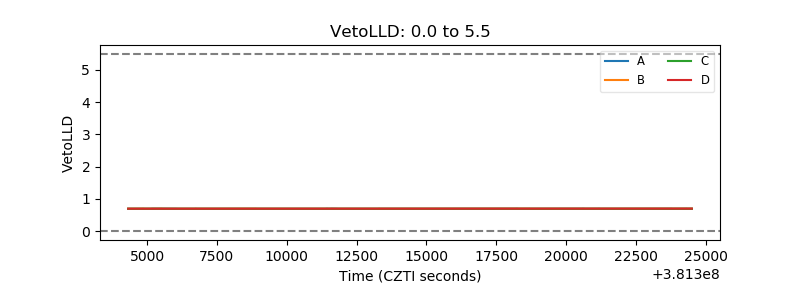 |
| Alpha Counter | 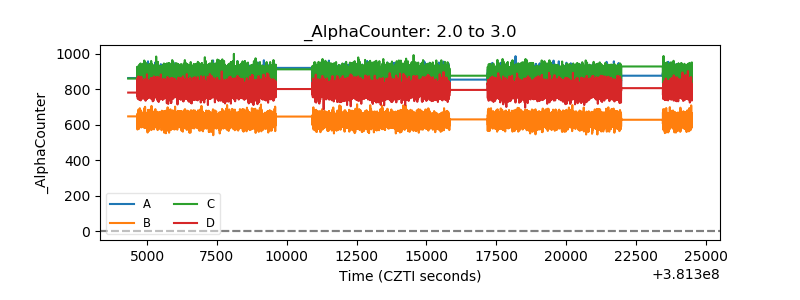 |
| _CPM_Rate | 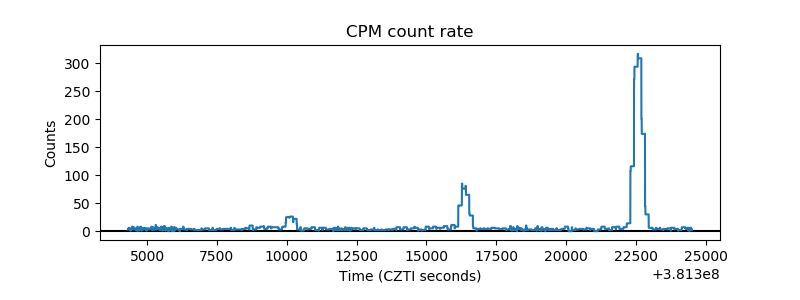 |
| CZT Counter | 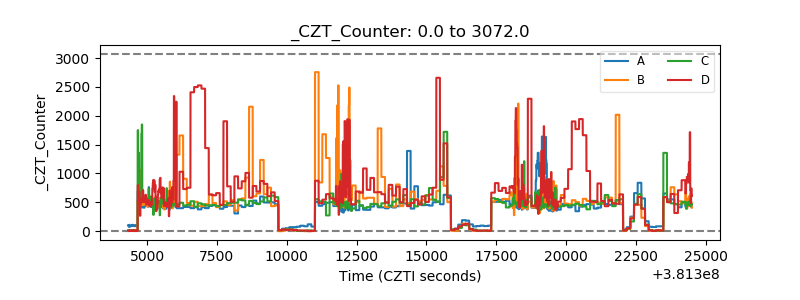 |
| +2.5 Volts monitor | 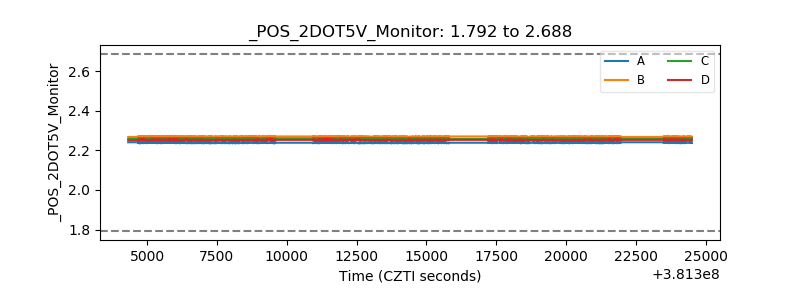 |
| +5 Volts monitor | 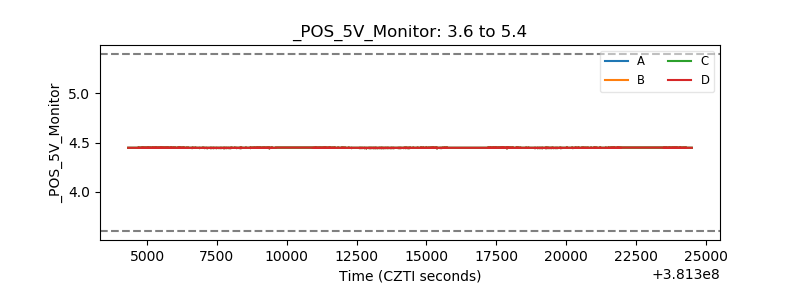 |
| _ROLL_ROT | 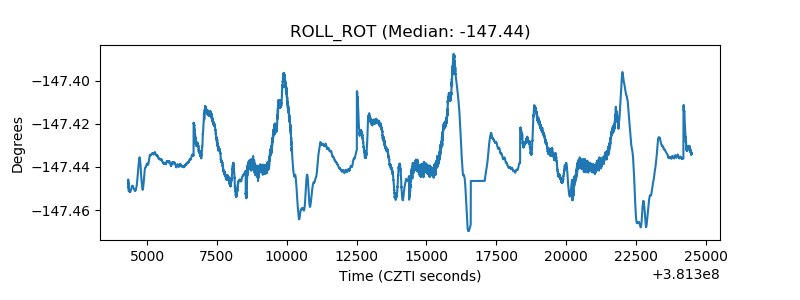 |
| _Roll_DEC | 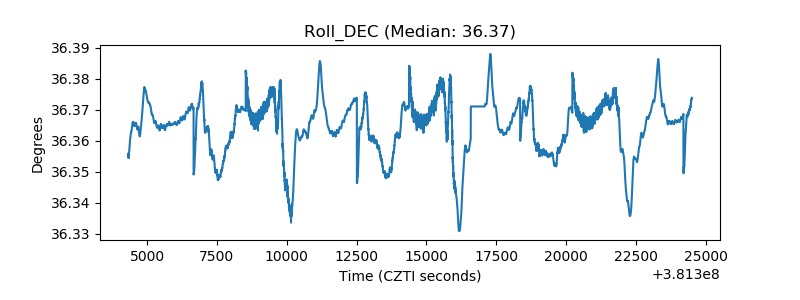 |
| _Roll_RA | 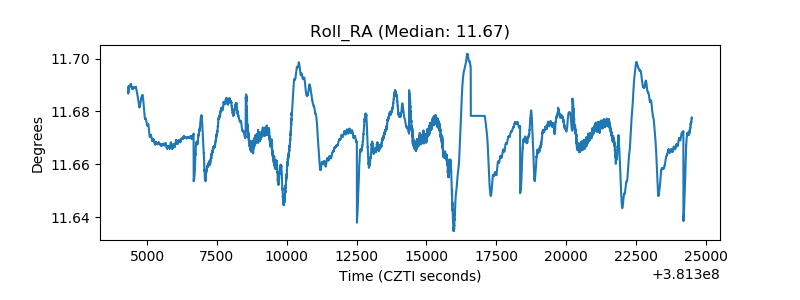 |
| Veto Counter | 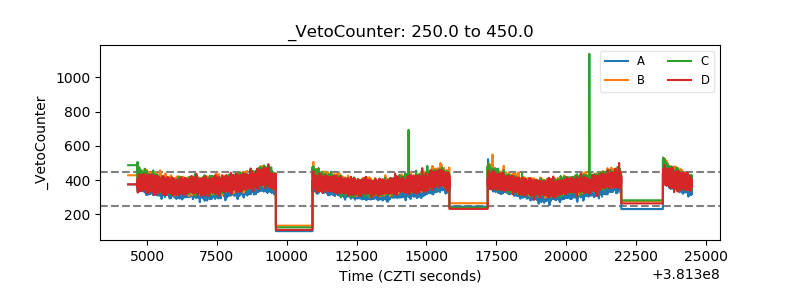 |