| Param | Original file | Final file |
|---|---|---|
| Filename | modeM0/AS1T04_086T01_9000004890_34296cztM0_level2.evt | modeM0/AS1T04_086T01_9000004890_34296cztM0_level2_quad_clean.evt |
| Size (bytes) | 72,820,800 | 14,273,280 |
| Size | 69.4 MB | 13.6 MB |
| Events in quadrant A | 348,868 | 96,157 |
| Events in quadrant B | 449,248 | 96,438 |
| Events in quadrant C | 388,672 | 93,940 |
| Events in quadrant D | 967,068 | 87,673 |
| Mode M0 | |||
|---|---|---|---|
| Quadrant | BADHDUFLAG | Total packets | Discarded packets |
| A | 0 | 1442 | 0 |
| B | 0 | 1773 | 4 |
| C | 0 | 1513 | 3 |
| D | 0 | 3382 | 4 |
| Mode SS | |||
|---|---|---|---|
| Quadrant | BADHDUFLAG | Total packets | Discarded packets |
| A | 0 | 16 | 0 |
| B | 0 | 16 | 0 |
| C | 0 | 16 | 0 |
| D | 0 | 16 | 0 |
| Mode M9 | |||
|---|---|---|---|
| Quadrant | BADHDUFLAG | Total packets | Discarded packets |
| A | 0 | 11 | 0 |
| B | 0 | 10 | 1 |
| C | 0 | 10 | 1 |
| D | 0 | 10 | 1 |
| Quadrant | Total seconds | Saturated seconds | Saturation percentage |
|---|---|---|---|
| A | 717 | 0 | 0.000000% |
| B | 715 | 9 | 1.258741% |
| C | 715 | 3 | 0.419580% |
| D | 716 | 42 | 5.865922% |
Noise dominated data is calculated using 1-second bins in cleaned event files. If a bin has >2000 counts, and if more than 50% of those come from <1% of pixels, then it is considered to be noise-dominated and hence unusable.
| Quadrant | # 1 sec bins | Bins with >0 counts | Bins with >2000 counts | High rate bins dominated by noise | Noise dominated (total time) | Noise dominated (detector-on time) | Marked lightcurve |
|---|---|---|---|---|---|---|---|
| A | 717 | 717 | 0 | 0 | 0.00% | 0.00% | 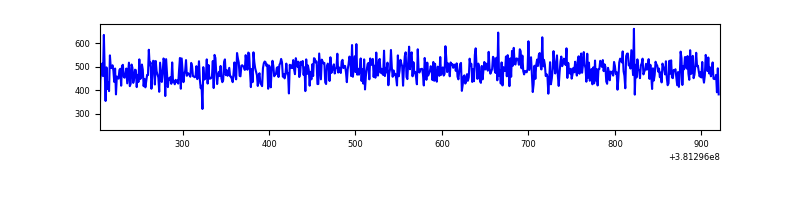 |
| B | 715 | 715 | 3 | 3 | 0.42% | 0.42% | 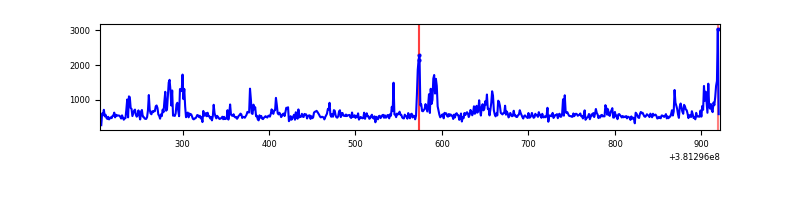 |
| C | 717 | 716 | 0 | 0 | 0.00% | 0.00% | 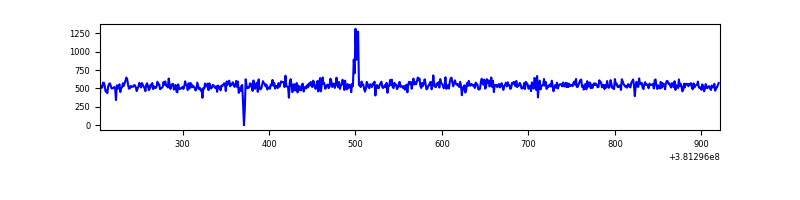 |
| D | 716 | 716 | 37 | 37 | 5.17% | 5.17% | 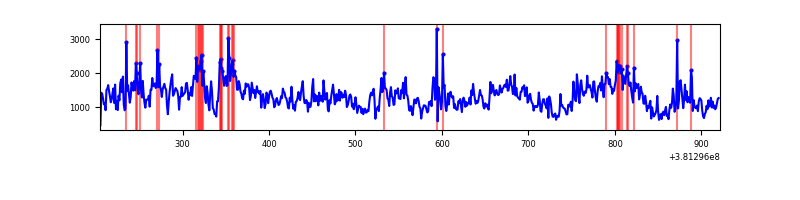 |
Top three noisy pixels from each quadrant. If the there are fewer than three noisy pixels in the level2.evt file, extra rows are filled as -1
| Pixel properties | Quadrant properties | ||||||
|---|---|---|---|---|---|---|---|
| Quadrant | DetID | PixID | Counts | Sigma | Mean | Median | Sigma |
| A | 13 | 254 | 1307 | 59.12 | 89 | 87 | 20.6 |
| A | 10 | 83 | 987 | 43.61 | 89 | 87 | 20.6 |
| A | 13 | 6 | 956 | 42.11 | 89 | 87 | 20.6 |
| B | 5 | 172 | 40667 | 2090.87 | 89 | 87 | 19.4 |
| B | 4 | 251 | 22587 | 1159.3 | 89 | 87 | 19.4 |
| B | 15 | 85 | 14263 | 730.41 | 89 | 87 | 19.4 |
| C | 15 | 214 | 29748 | 1302.94 | 89 | 90 | 22.8 |
| C | 9 | 187 | 3332 | 142.43 | 89 | 90 | 22.8 |
| C | 3 | 233 | 1756 | 73.19 | 89 | 90 | 22.8 |
| D | 12 | 235 | 495649 | 21744.69 | 87 | 85 | 22.8 |
| D | 8 | 195 | 93793 | 4111.78 | 87 | 85 | 22.8 |
| D | 7 | 38 | 15939 | 695.65 | 87 | 85 | 22.8 |
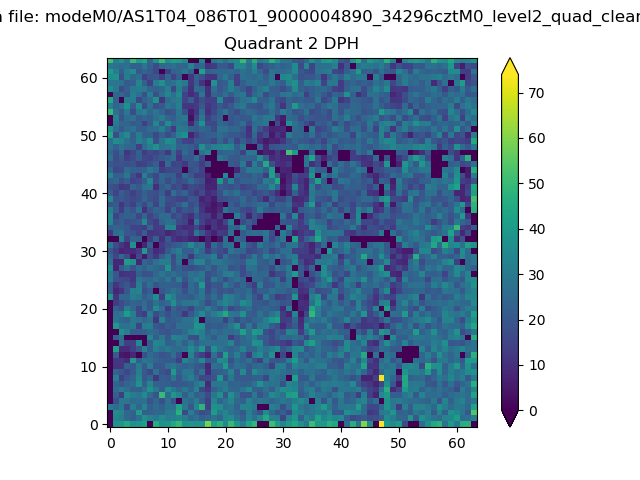
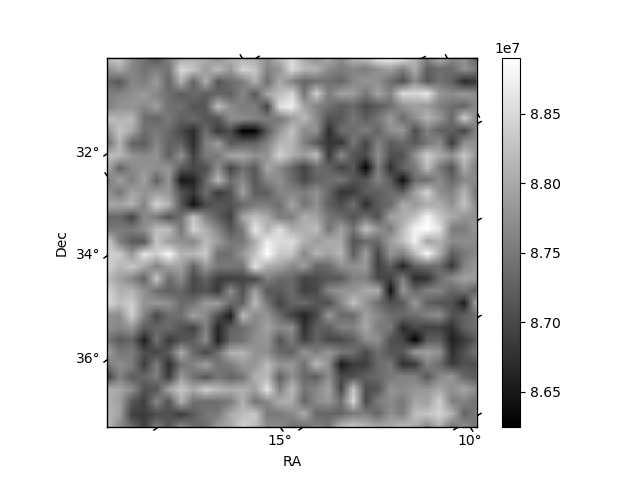
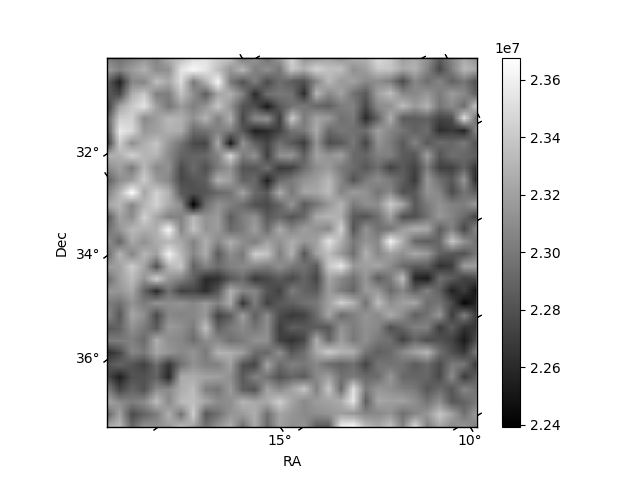
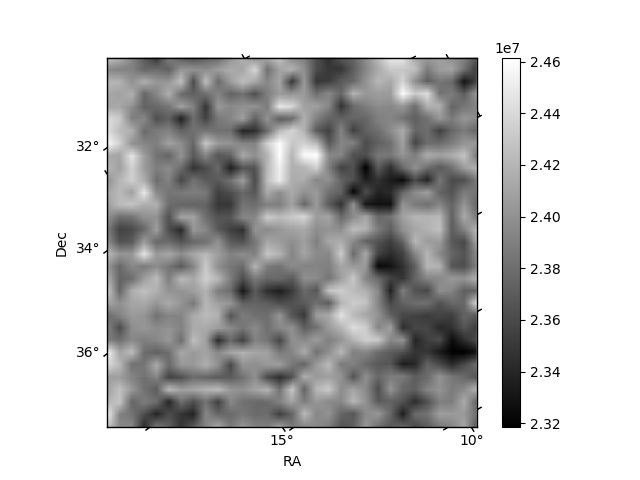
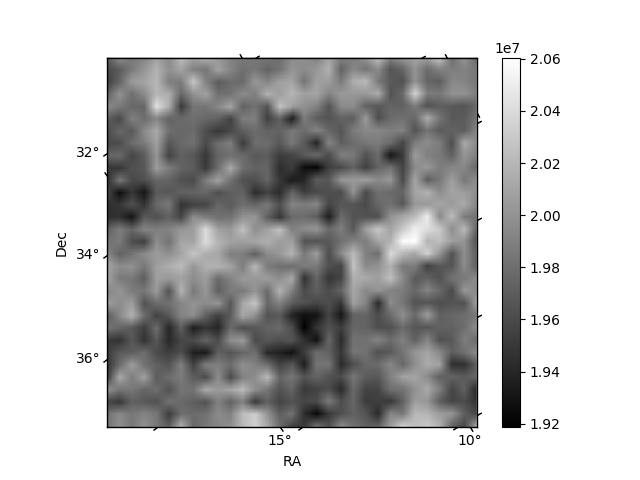
Histogram calculated using DETX and DETY for each event in the final _common_clean file
| Quadrant A | 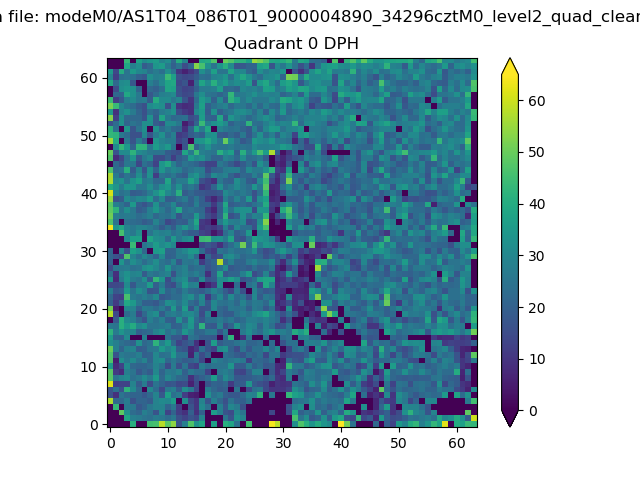 |
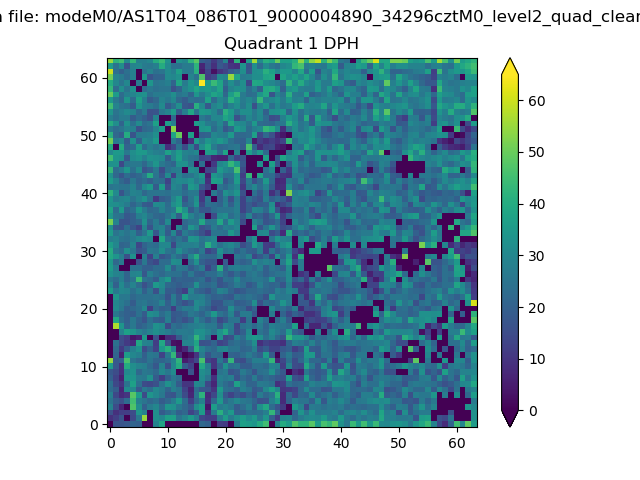 |
Quadrant B |
|---|---|---|---|
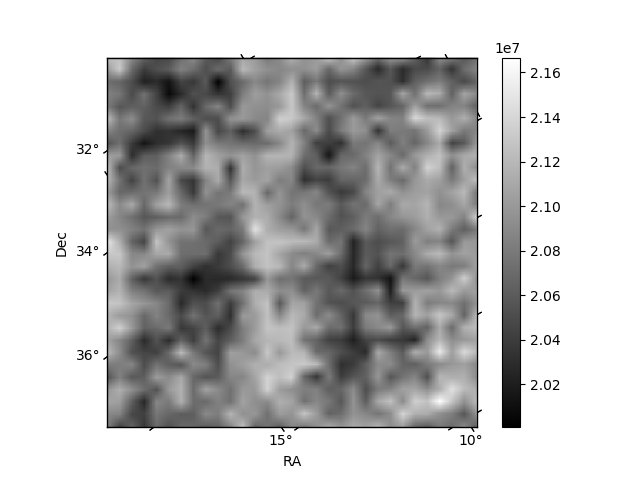
| Quadrant D | 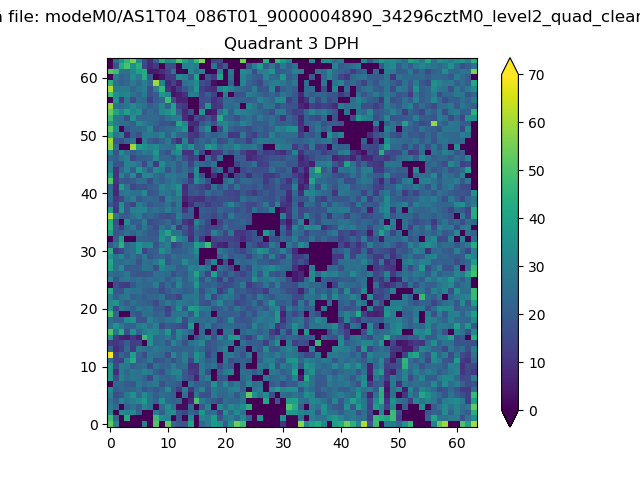 |
 |
Quadrant C |
| Plot type | Count rate plots | Images |
|---|---|---|
| Comparison with Poisson distribution Blue bars denote a histogram of data divided into 1 sec bins. Red curve is a Poisson curve with rate = median count rate of data. |
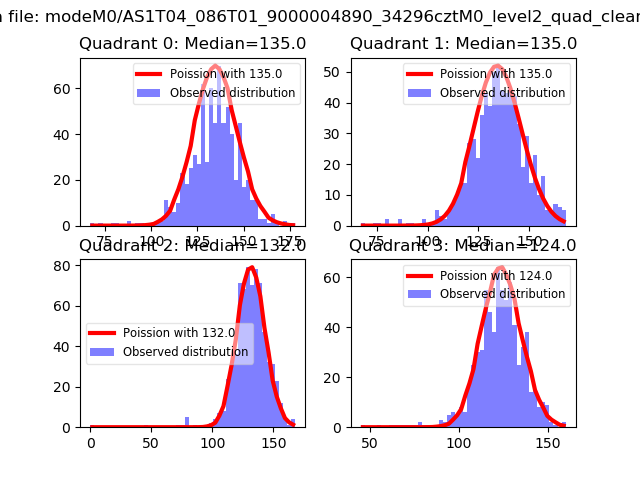 |
 |
| Quadrant-wise count rates Data is divided into 100 sec bins |
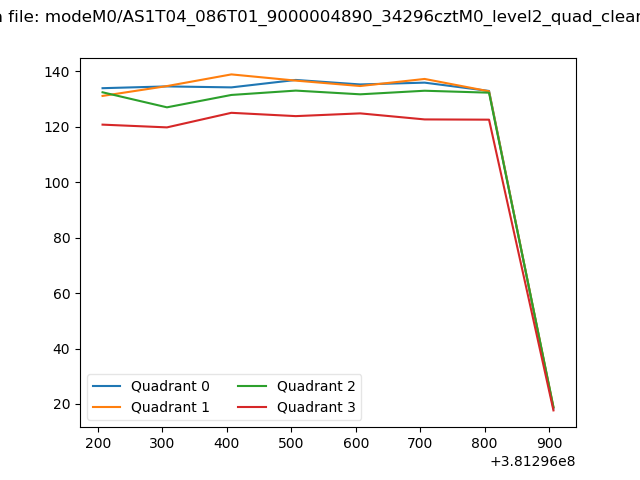 |
|
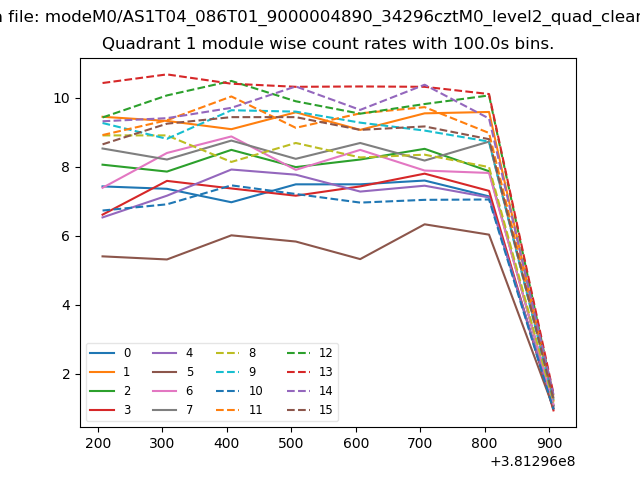
| Module-wise count rates for Quadrant A Data is divided into 100 sec bins |
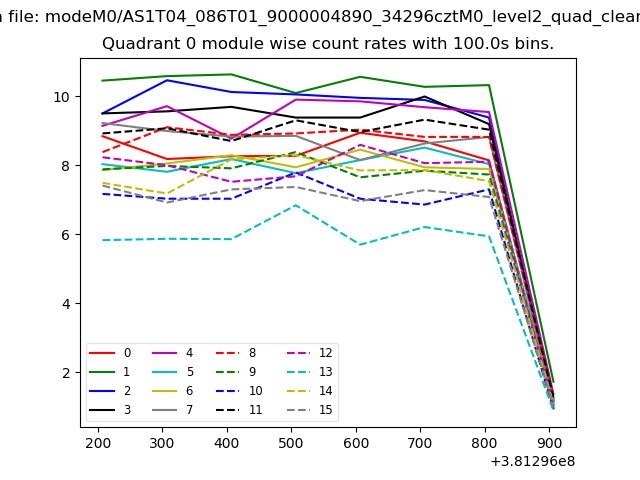 |
 |
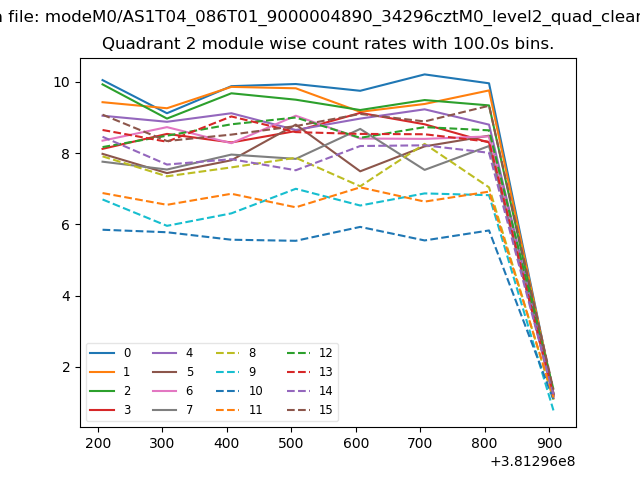
| Module-wise count rates for Quadrant B Data is divided into 100 sec bins |
 |
 |
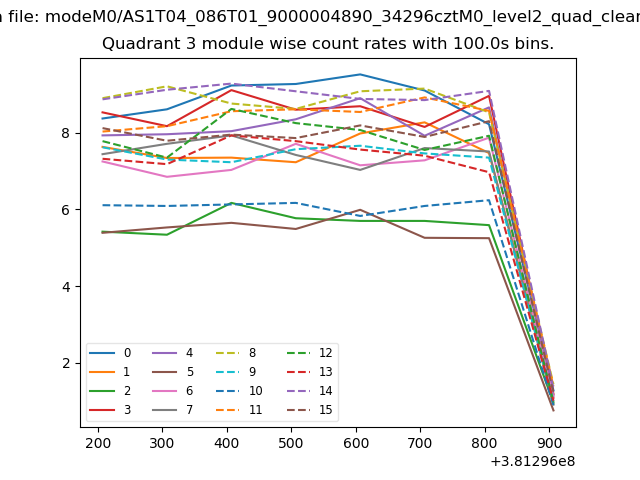
| Module-wise count rates for Quadrant C Data is divided into 100 sec bins |
 |
 |
| Module-wise count rates for Quadrant D Data is divided into 100 sec bins |
 |
 |
| Parameter | Plot |
|---|---|
| CZT HV Monitor | 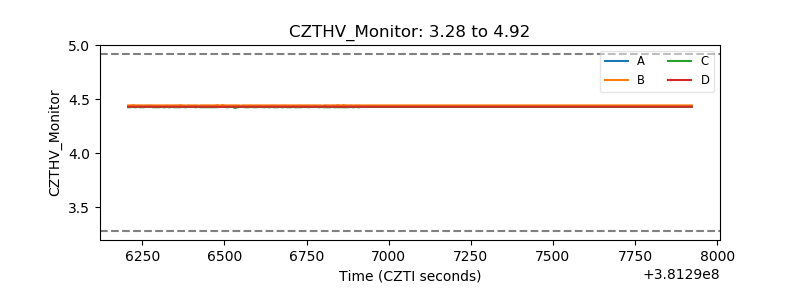 |
| D_VDD | 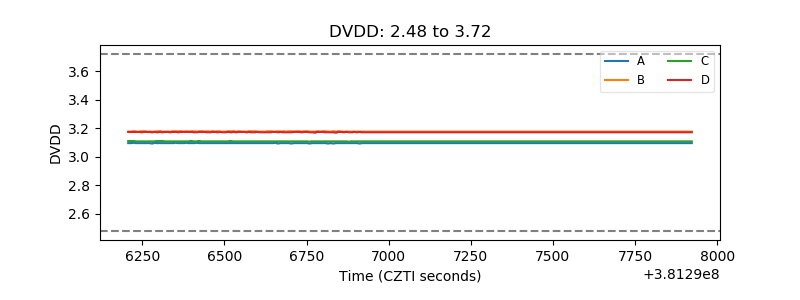 |
| Temperature 1 | 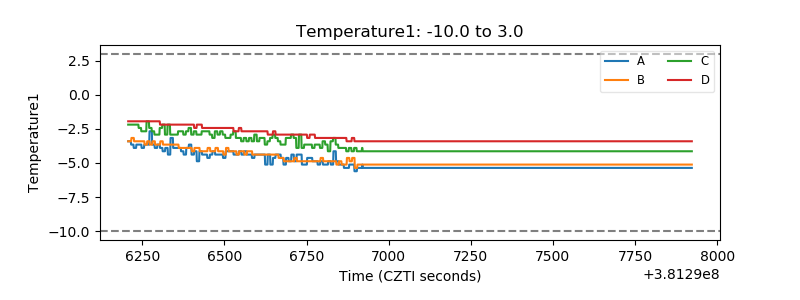 |
| Veto HV Monitor | 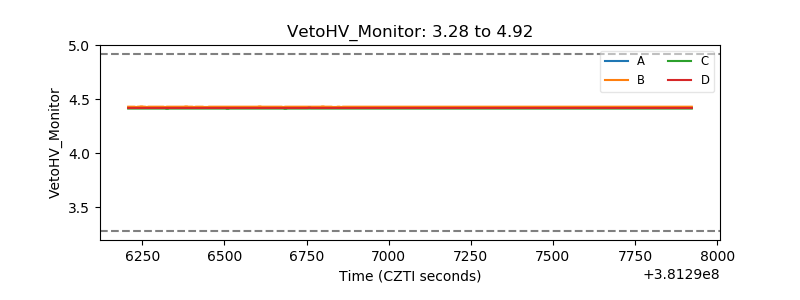 |
| Veto LLD |  |
| Alpha Counter | 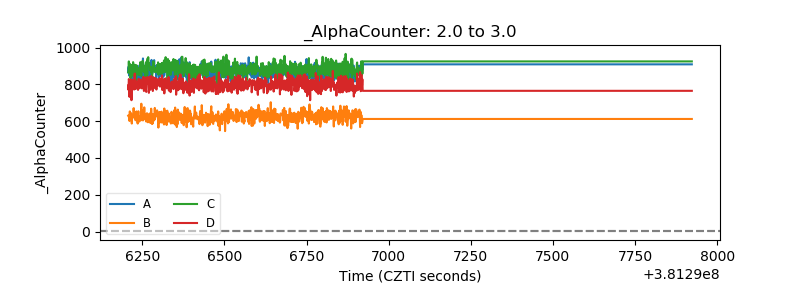 |
| _CPM_Rate | 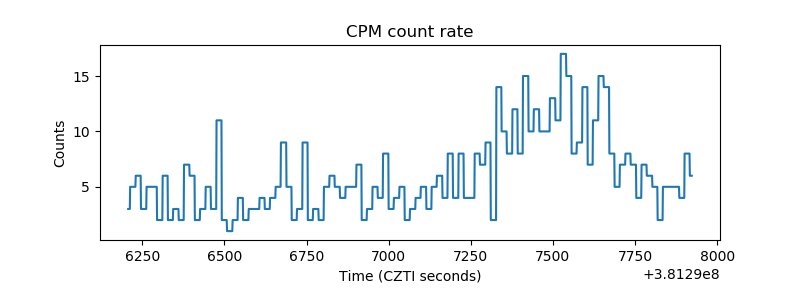 |
| CZT Counter | 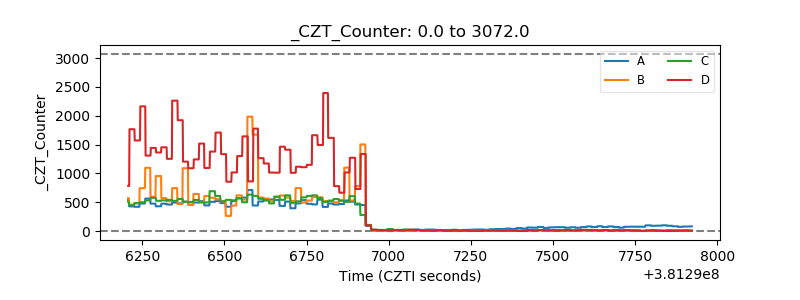 |
| +2.5 Volts monitor | 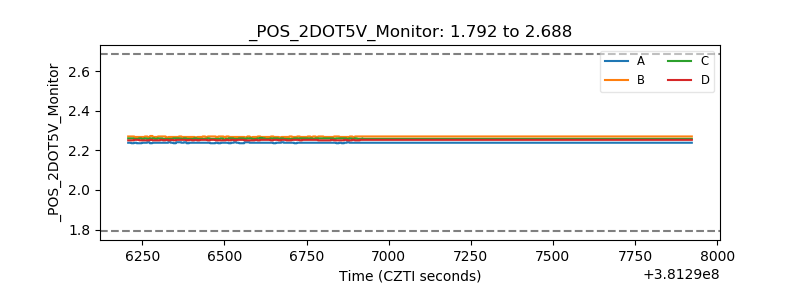 |
| +5 Volts monitor | 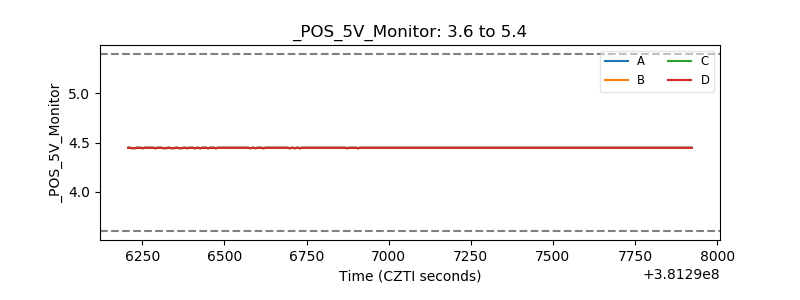 |
| _ROLL_ROT | 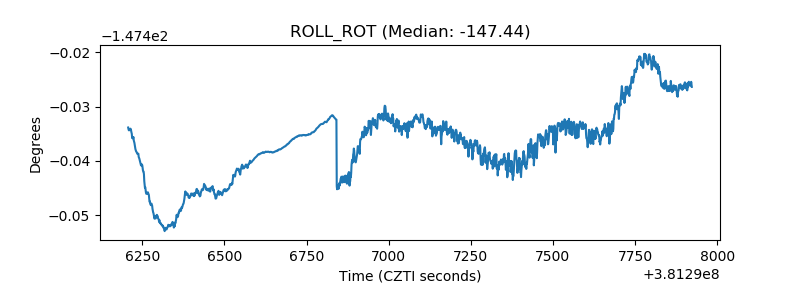 |
| _Roll_DEC | 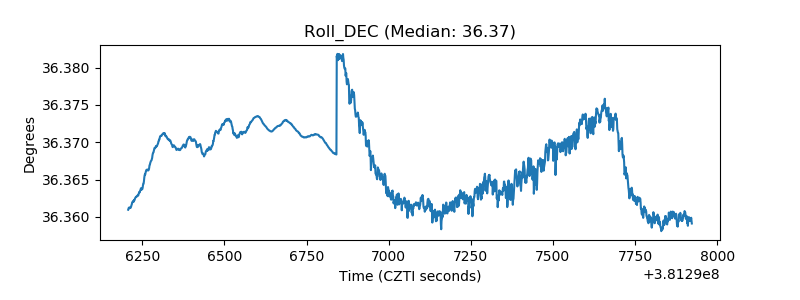 |
| _Roll_RA | 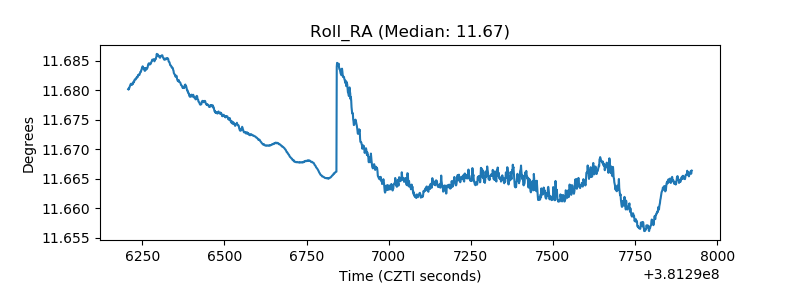 |
| Veto Counter | 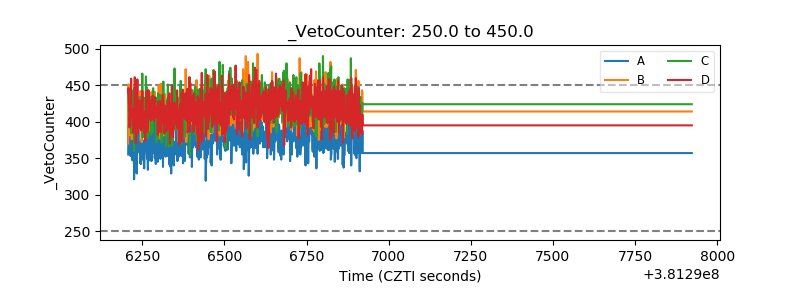 |