| Param | Original file | Final file |
|---|---|---|
| Filename | modeM0/AS1T04_086T01_9000004890_34295cztM0_level2.evt | modeM0/AS1T04_086T01_9000004890_34295cztM0_level2_quad_clean.evt |
| Size (bytes) | 440,164,800 | 60,580,800 |
| Size | 419.8 MB | 57.8 MB |
| Events in quadrant A | 2,488,575 | 362,437 |
| Events in quadrant B | 3,341,844 | 367,298 |
| Events in quadrant C | 3,086,672 | 376,061 |
| Events in quadrant D | 4,048,413 | 352,015 |
| Mode M0 | |||
|---|---|---|---|
| Quadrant | BADHDUFLAG | Total packets | Discarded packets |
| A | 0 | 10947 | 3 |
| B | 0 | 13327 | 2 |
| C | 0 | 12340 | 2 |
| D | 0 | 15712 | 2 |
| Mode SS | |||
|---|---|---|---|
| Quadrant | BADHDUFLAG | Total packets | Discarded packets |
| A | 0 | 108 | 0 |
| B | 0 | 108 | 0 |
| C | 0 | 108 | 0 |
| D | 0 | 108 | 0 |
| Mode M9 | |||
|---|---|---|---|
| Quadrant | BADHDUFLAG | Total packets | Discarded packets |
| A | 0 | 26 | 0 |
| B | 0 | 26 | 0 |
| C | 0 | 26 | 0 |
| D | 0 | 27 | 0 |
| Quadrant | Total seconds | Saturated seconds | Saturation percentage |
|---|---|---|---|
| A | 5381 | 14 | 0.260175% |
| B | 5381 | 137 | 2.545995% |
| C | 5381 | 84 | 1.561048% |
| D | 5381 | 101 | 1.876975% |
Noise dominated data is calculated using 1-second bins in cleaned event files. If a bin has >2000 counts, and if more than 50% of those come from <1% of pixels, then it is considered to be noise-dominated and hence unusable.
| Quadrant | # 1 sec bins | Bins with >0 counts | Bins with >2000 counts | High rate bins dominated by noise | Noise dominated (total time) | Noise dominated (detector-on time) | Marked lightcurve |
|---|---|---|---|---|---|---|---|
| A | 7174 | 5382 | 6 | 6 | 0.08% | 0.11% | 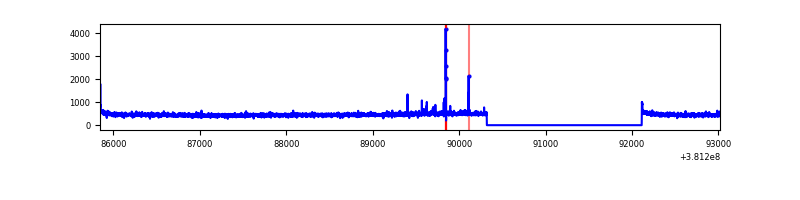 |
| B | 7174 | 5382 | 91 | 91 | 1.27% | 1.69% |  |
| C | 7174 | 5382 | 60 | 60 | 0.84% | 1.11% | 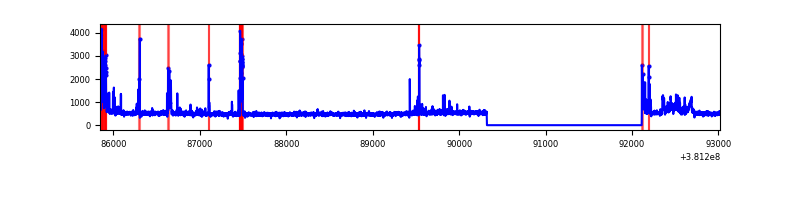 |
| D | 7174 | 5382 | 91 | 91 | 1.27% | 1.69% | 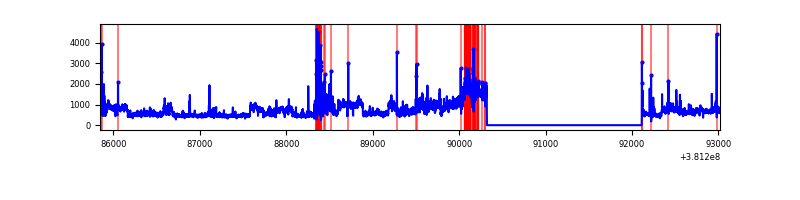 |
Top three noisy pixels from each quadrant. If the there are fewer than three noisy pixels in the level2.evt file, extra rows are filled as -1
| Pixel properties | Quadrant properties | ||||||
|---|---|---|---|---|---|---|---|
| Quadrant | DetID | PixID | Counts | Sigma | Mean | Median | Sigma |
| A | 10 | 83 | 26898 | 211.26 | 621 | 609 | 124.4 |
| A | 9 | 143 | 24192 | 189.52 | 621 | 609 | 124.4 |
| A | 13 | 6 | 18572 | 144.35 | 621 | 609 | 124.4 |
| B | 5 | 172 | 580504 | 4876.56 | 621 | 605 | 118.9 |
| B | 4 | 251 | 133107 | 1114.25 | 621 | 605 | 118.9 |
| B | 0 | 189 | 62397 | 519.63 | 621 | 605 | 118.9 |
| C | 15 | 214 | 232643 | 1625.15 | 613 | 617 | 142.8 |
| C | 14 | 254 | 217473 | 1518.9 | 613 | 617 | 142.8 |
| C | 9 | 187 | 117836 | 821.02 | 613 | 617 | 142.8 |
| D | 8 | 195 | 897162 | 5682.28 | 608 | 596 | 157.8 |
| D | 12 | 235 | 284705 | 1800.63 | 608 | 596 | 157.8 |
| D | 7 | 223 | 198767 | 1255.97 | 608 | 596 | 157.8 |
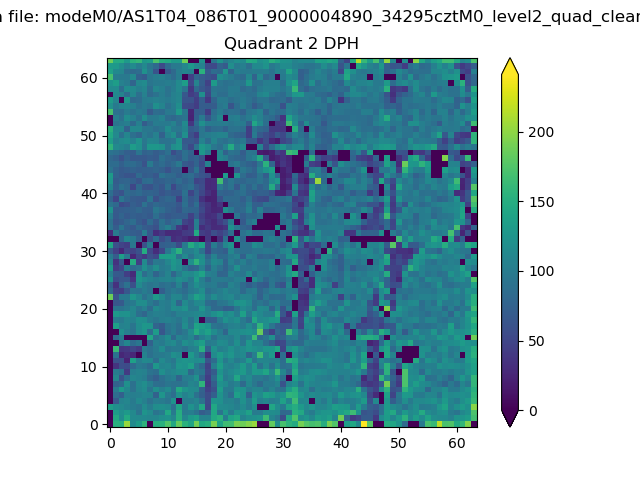
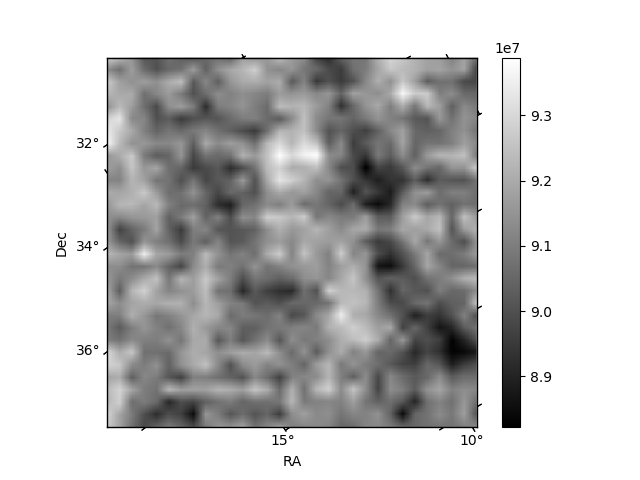
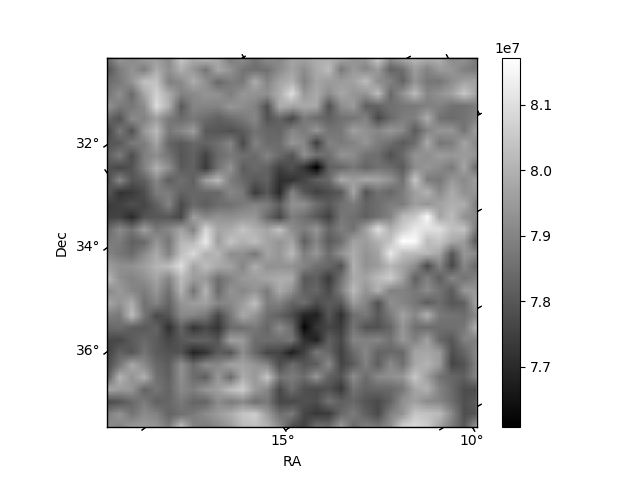
Histogram calculated using DETX and DETY for each event in the final _common_clean file
| Quadrant A | 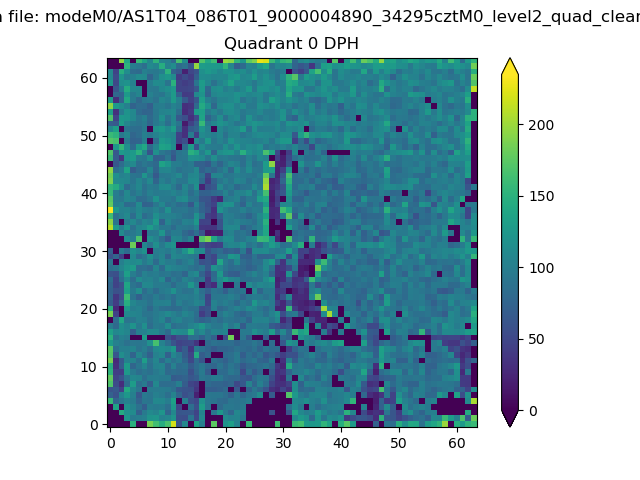 |
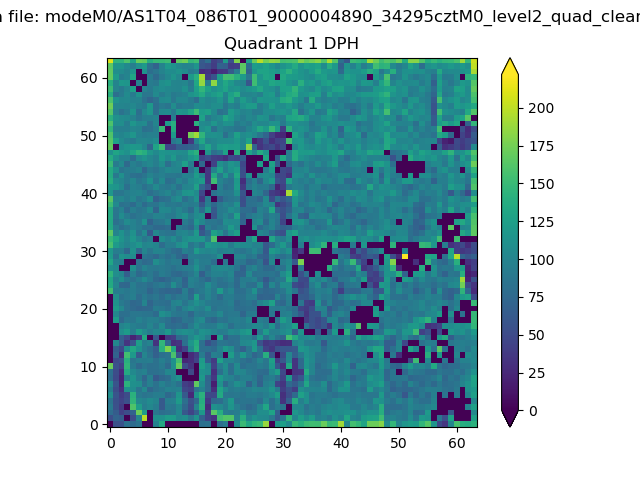 |
Quadrant B |
|---|---|---|---|
| Quadrant D | 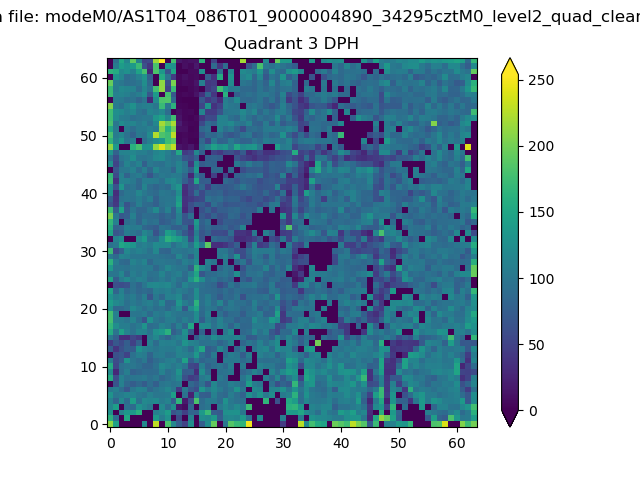 |
 |
Quadrant C |
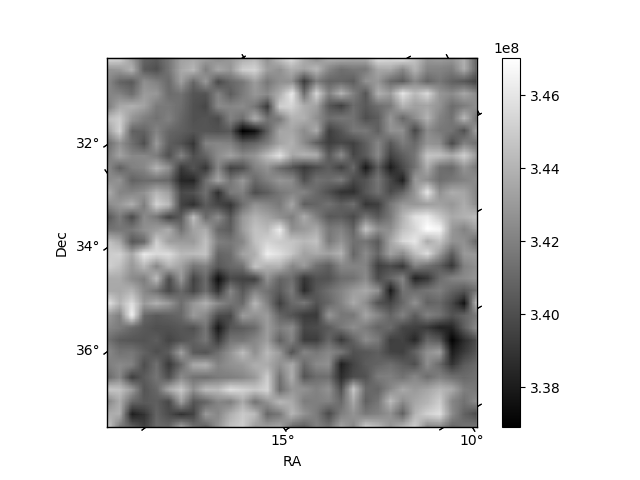
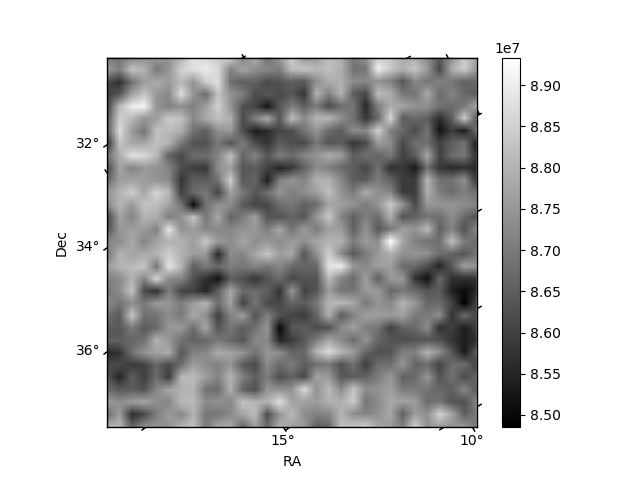
| Plot type | Count rate plots | Images |
|---|---|---|
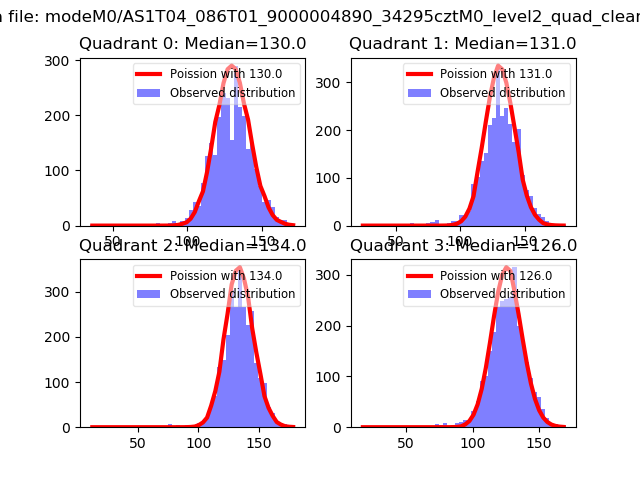
| Comparison with Poisson distribution Blue bars denote a histogram of data divided into 1 sec bins. Red curve is a Poisson curve with rate = median count rate of data. |
 |
 |
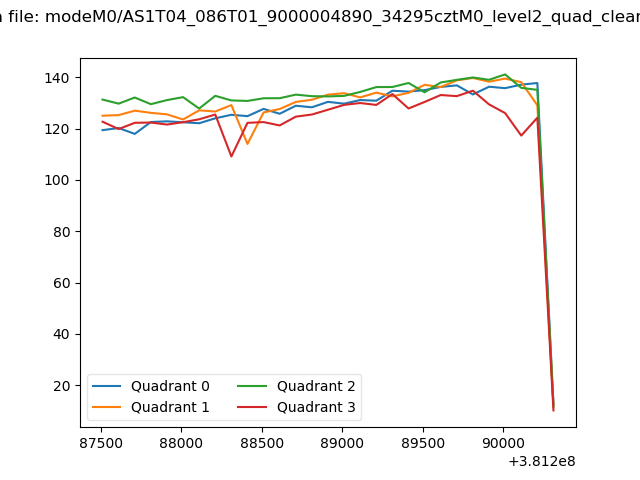
| Quadrant-wise count rates Data is divided into 100 sec bins |
 |
|
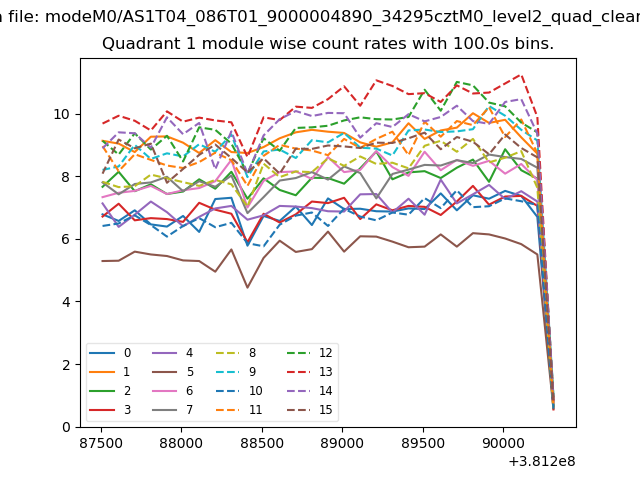
| Module-wise count rates for Quadrant A Data is divided into 100 sec bins |
 |
 |
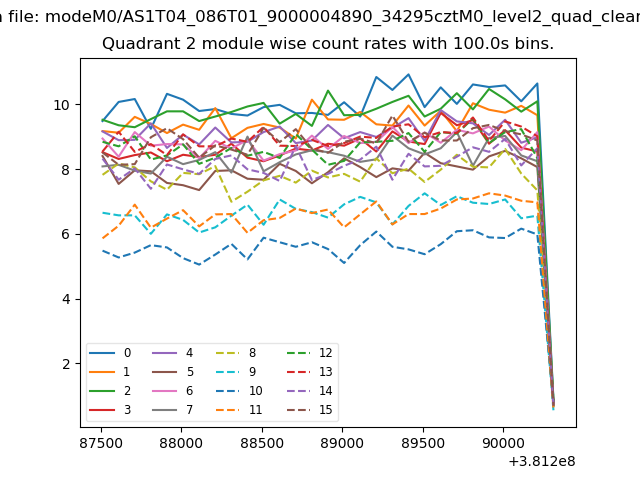
| Module-wise count rates for Quadrant B Data is divided into 100 sec bins |
 |
 |
| Module-wise count rates for Quadrant C Data is divided into 100 sec bins |
 |
 |
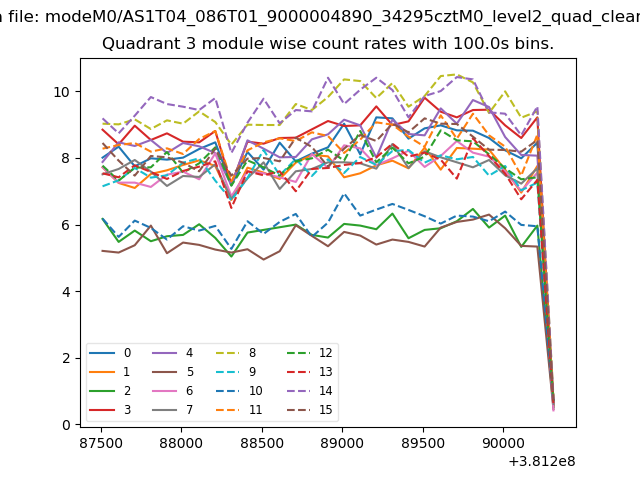
| Module-wise count rates for Quadrant D Data is divided into 100 sec bins |
 |
 |
| Parameter | Plot |
|---|---|
| CZT HV Monitor | 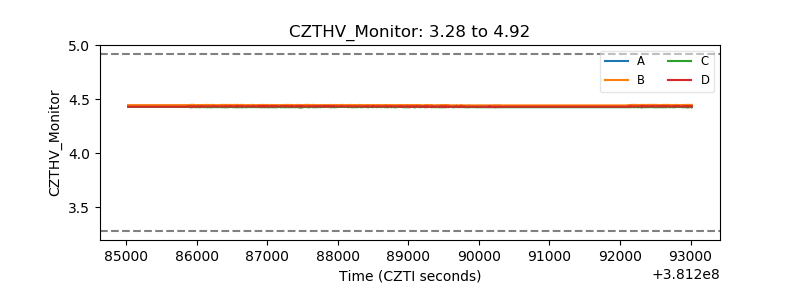 |
| D_VDD | 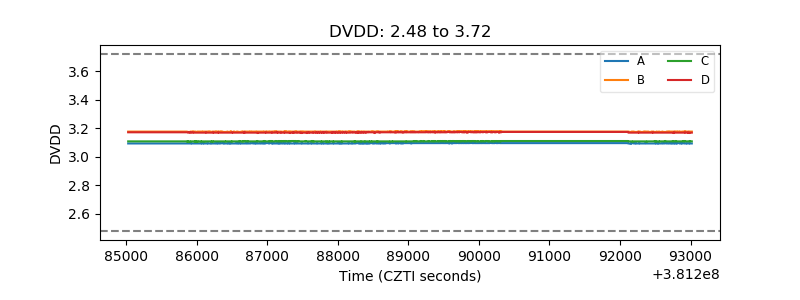 |
| Temperature 1 | 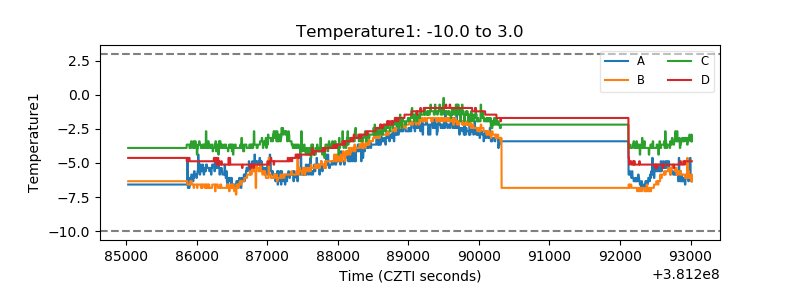 |
| Veto HV Monitor | 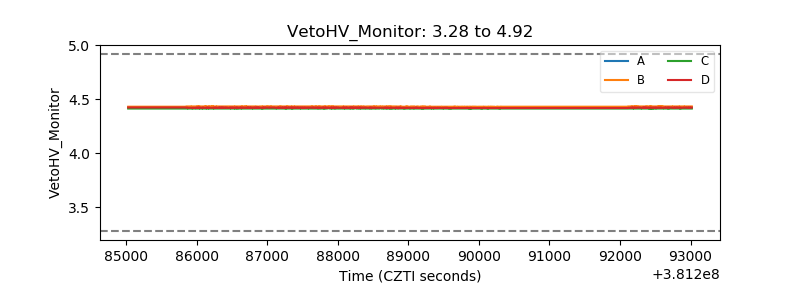 |
| Veto LLD | 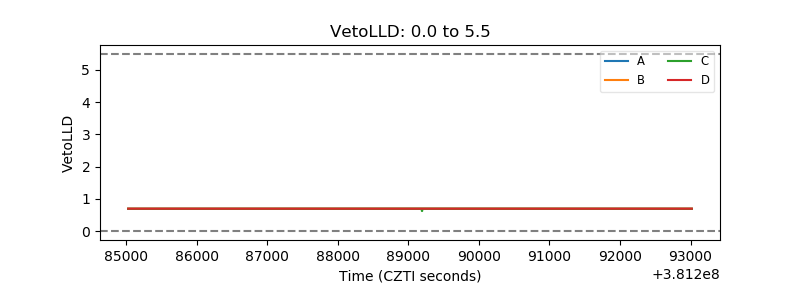 |
| Alpha Counter | 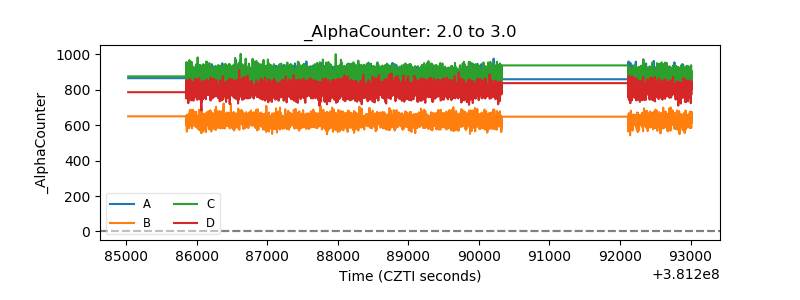 |
| _CPM_Rate | 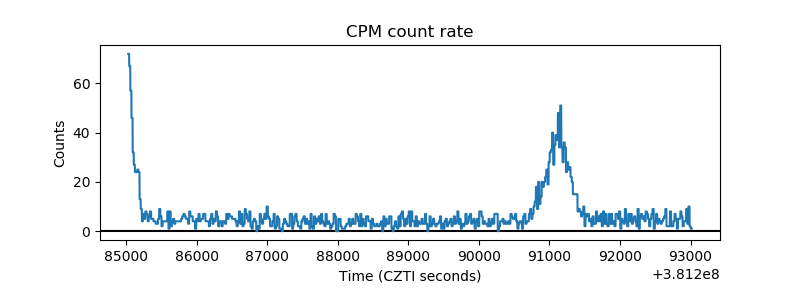 |
| CZT Counter | 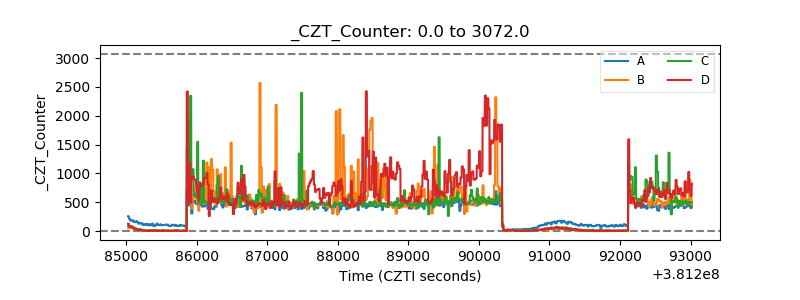 |
| +2.5 Volts monitor | 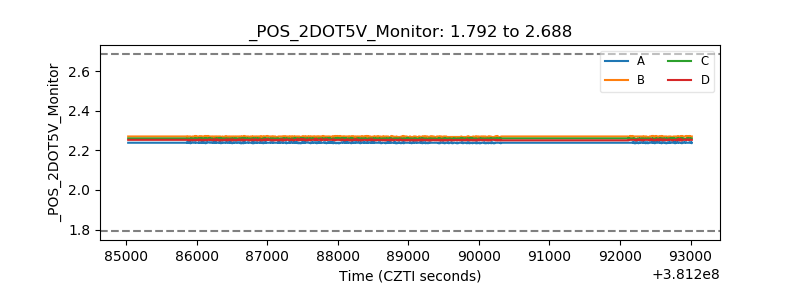 |
| +5 Volts monitor | 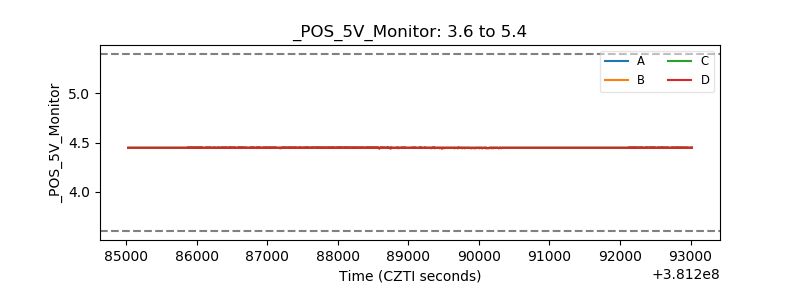 |
| _ROLL_ROT | 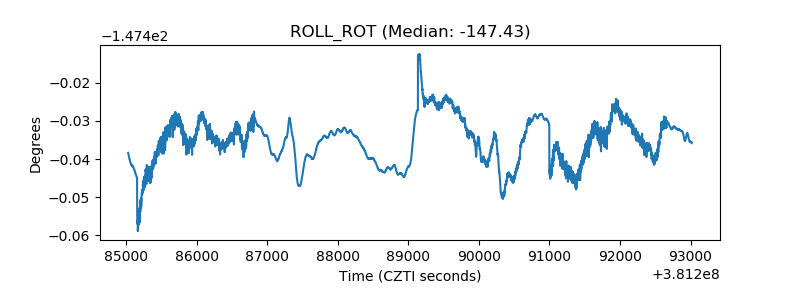 |
| _Roll_DEC | 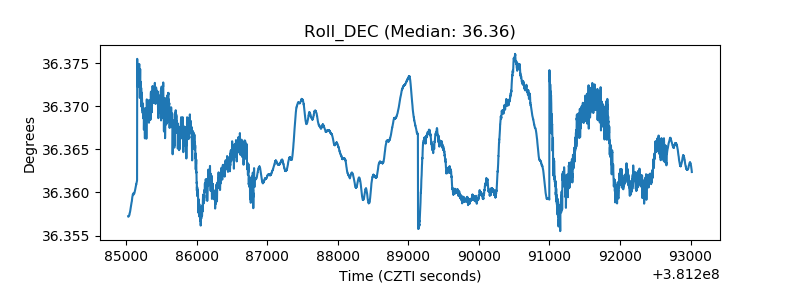 |
| _Roll_RA | 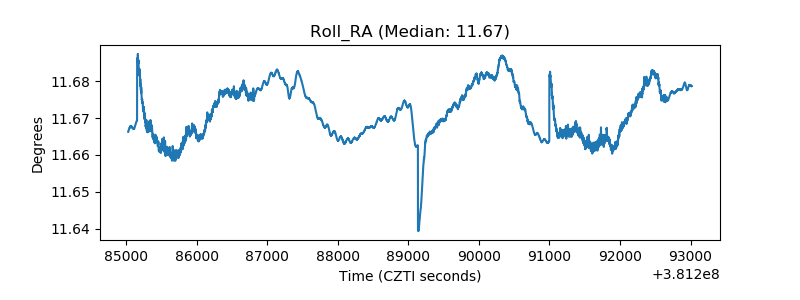 |
| Veto Counter | 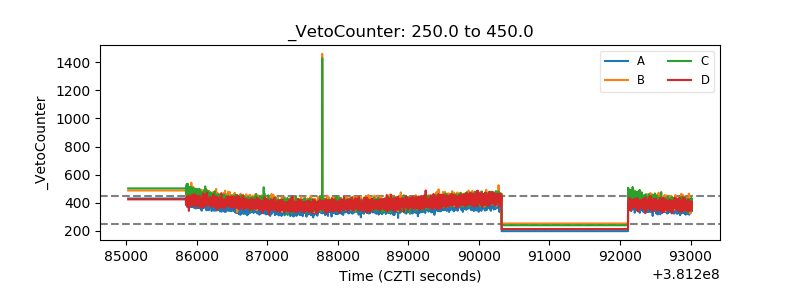 |