| Param | Original file | Final file |
|---|---|---|
| Filename | modeM0/AS1T04_086T01_9000004890_34294cztM0_level2.evt | modeM0/AS1T04_086T01_9000004890_34294cztM0_level2_quad_clean.evt |
| Size (bytes) | 437,397,120 | 49,890,240 |
| Size | 417.1 MB | 47.6 MB |
| Events in quadrant A | 2,455,691 | 284,594 |
| Events in quadrant B | 3,371,802 | 285,874 |
| Events in quadrant C | 3,085,462 | 293,681 |
| Events in quadrant D | 3,977,466 | 278,578 |
| Mode M0 | |||
|---|---|---|---|
| Quadrant | BADHDUFLAG | Total packets | Discarded packets |
| A | 0 | 10716 | 3 |
| B | 0 | 13357 | 2 |
| C | 0 | 12071 | 2 |
| D | 0 | 15295 | 2 |
| Mode SS | |||
|---|---|---|---|
| Quadrant | BADHDUFLAG | Total packets | Discarded packets |
| A | 0 | 106 | 0 |
| B | 0 | 106 | 0 |
| C | 0 | 106 | 0 |
| D | 0 | 106 | 0 |
| Mode M9 | |||
|---|---|---|---|
| Quadrant | BADHDUFLAG | Total packets | Discarded packets |
| A | 0 | 31 | 0 |
| B | 0 | 31 | 0 |
| C | 0 | 31 | 0 |
| D | 0 | 32 | 0 |
| Quadrant | Total seconds | Saturated seconds | Saturation percentage |
|---|---|---|---|
| A | 5249 | 8 | 0.152410% |
| B | 5249 | 199 | 3.791198% |
| C | 5249 | 110 | 2.095637% |
| D | 5249 | 47 | 0.895409% |
Noise dominated data is calculated using 1-second bins in cleaned event files. If a bin has >2000 counts, and if more than 50% of those come from <1% of pixels, then it is considered to be noise-dominated and hence unusable.
| Quadrant | # 1 sec bins | Bins with >0 counts | Bins with >2000 counts | High rate bins dominated by noise | Noise dominated (total time) | Noise dominated (detector-on time) | Marked lightcurve |
|---|---|---|---|---|---|---|---|
| A | 7312 | 5250 | 3 | 3 | 0.04% | 0.06% | 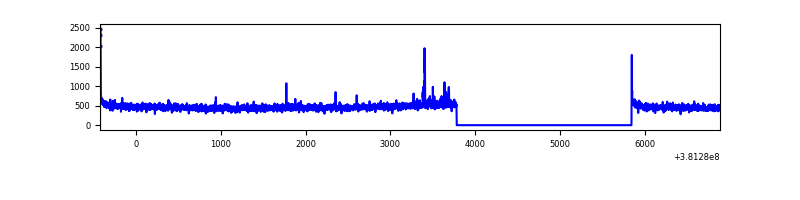 |
| B | 7312 | 5250 | 132 | 132 | 1.81% | 2.51% |  |
| C | 7312 | 5250 | 84 | 84 | 1.15% | 1.60% | 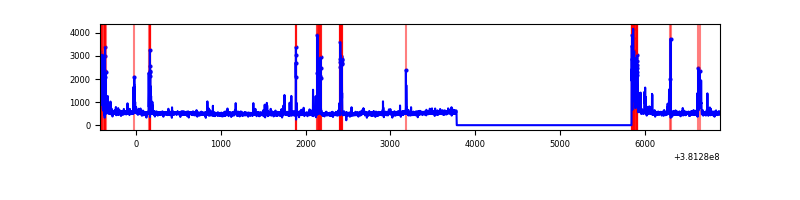 |
| D | 7312 | 5250 | 38 | 38 | 0.52% | 0.72% | 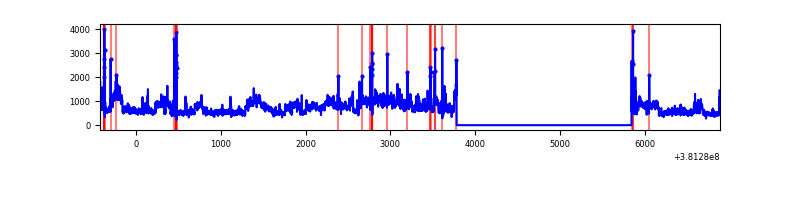 |
Top three noisy pixels from each quadrant. If the there are fewer than three noisy pixels in the level2.evt file, extra rows are filled as -1
| Pixel properties | Quadrant properties | ||||||
|---|---|---|---|---|---|---|---|
| Quadrant | DetID | PixID | Counts | Sigma | Mean | Median | Sigma |
| A | 9 | 143 | 33529 | 267.46 | 616 | 604 | 123.1 |
| A | 10 | 83 | 26244 | 208.28 | 616 | 604 | 123.1 |
| A | 13 | 6 | 11100 | 85.26 | 616 | 604 | 123.1 |
| B | 5 | 172 | 522408 | 4497.4 | 612 | 596 | 116.0 |
| B | 4 | 251 | 133055 | 1141.64 | 612 | 596 | 116.0 |
| B | 0 | 189 | 80854 | 691.73 | 612 | 596 | 116.0 |
| C | 14 | 254 | 337769 | 2411.48 | 608 | 614 | 139.8 |
| C | 15 | 214 | 227709 | 1624.28 | 608 | 614 | 139.8 |
| C | 0 | 10 | 103222 | 733.9 | 608 | 614 | 139.8 |
| D | 8 | 195 | 1042572 | 6745.38 | 603 | 590 | 154.5 |
| D | 12 | 235 | 322843 | 2086.14 | 603 | 590 | 154.5 |
| D | 7 | 223 | 117429 | 756.37 | 603 | 590 | 154.5 |
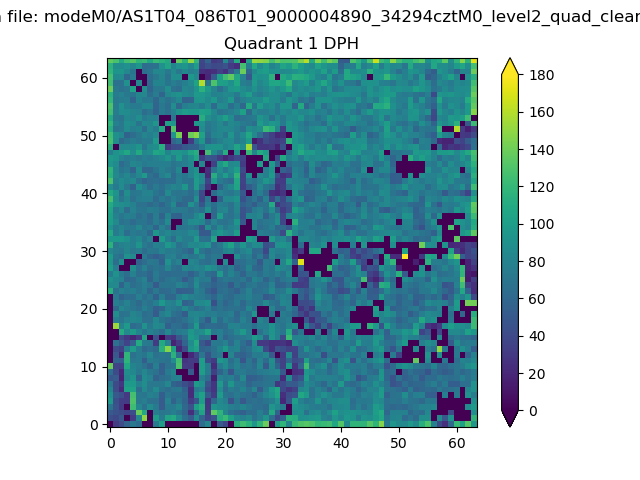
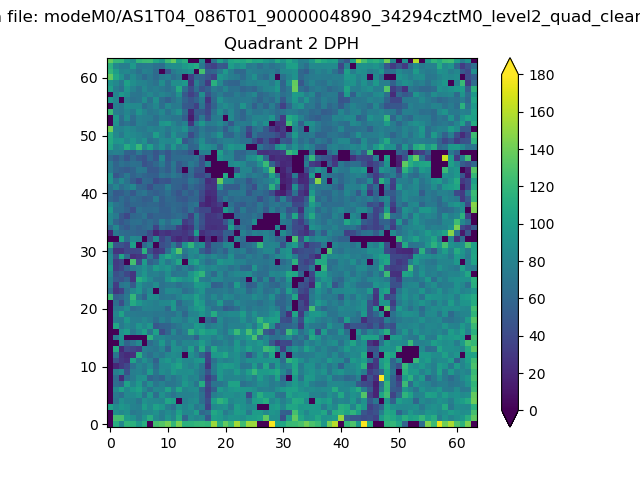
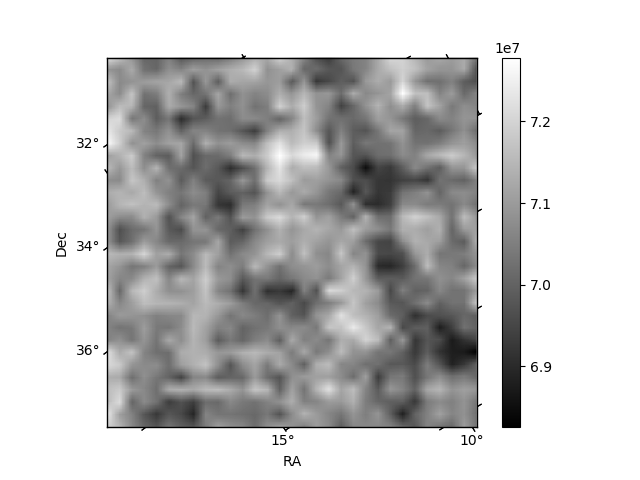
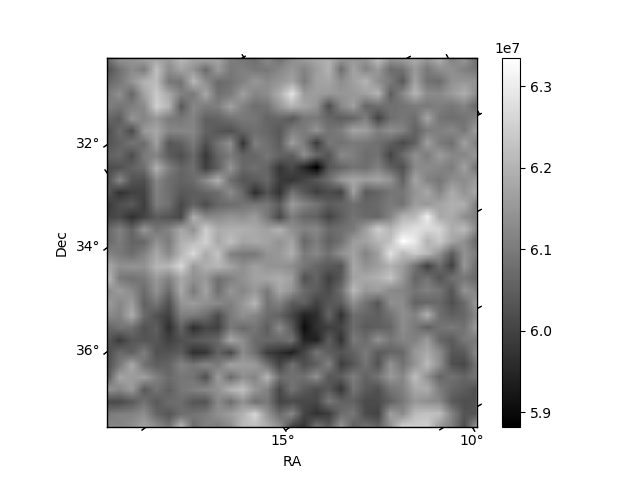
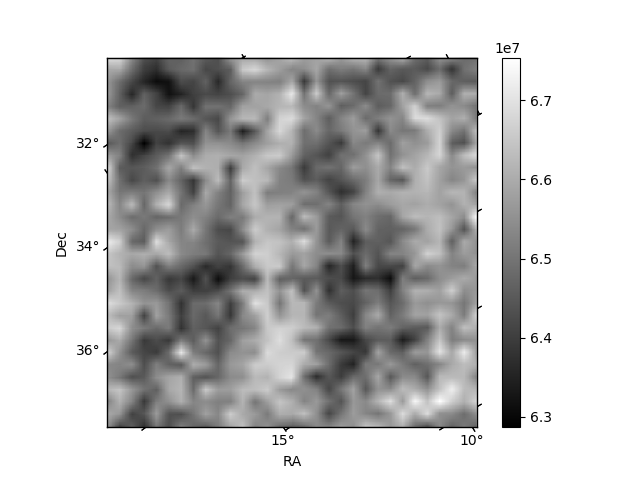
Histogram calculated using DETX and DETY for each event in the final _common_clean file
| Quadrant A |  |
 |
Quadrant B |
|---|---|---|---|
| Quadrant D | 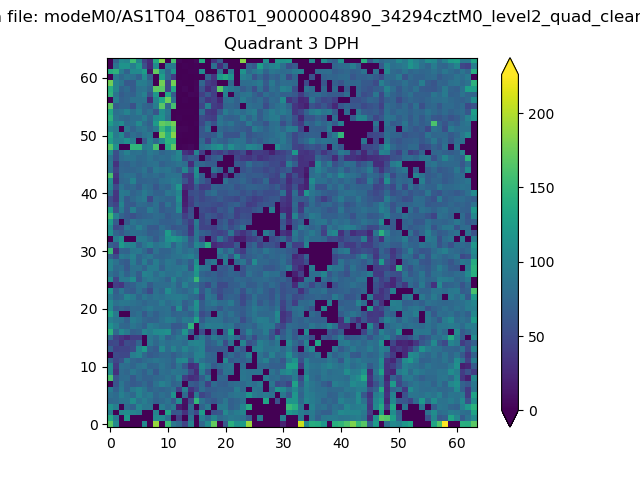 |
 |
Quadrant C |
| Plot type | Count rate plots | Images |
|---|---|---|
| Comparison with Poisson distribution Blue bars denote a histogram of data divided into 1 sec bins. Red curve is a Poisson curve with rate = median count rate of data. |
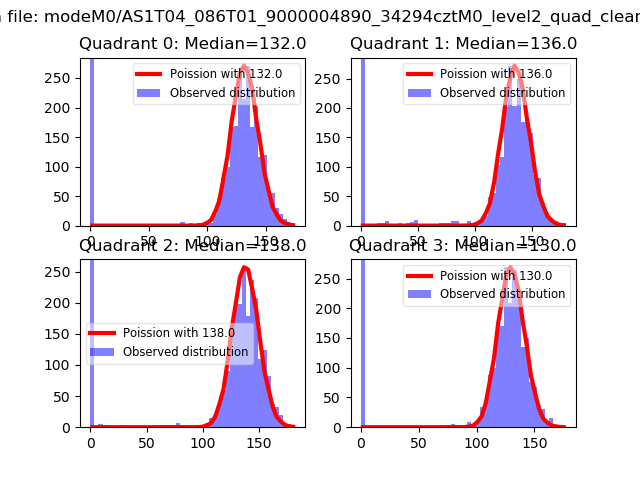 |
 |
| Quadrant-wise count rates Data is divided into 100 sec bins |
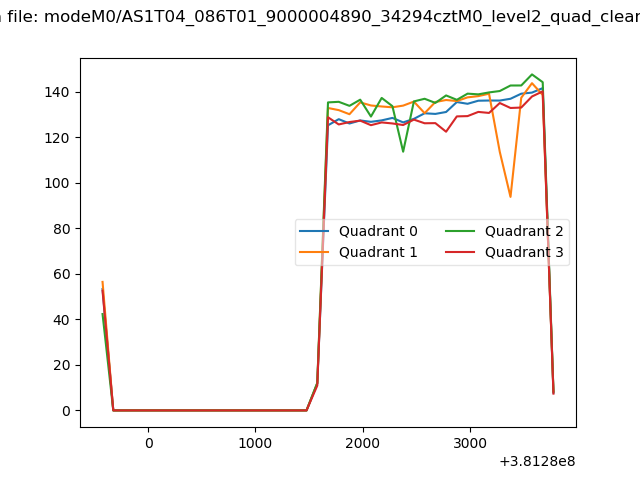 |
|
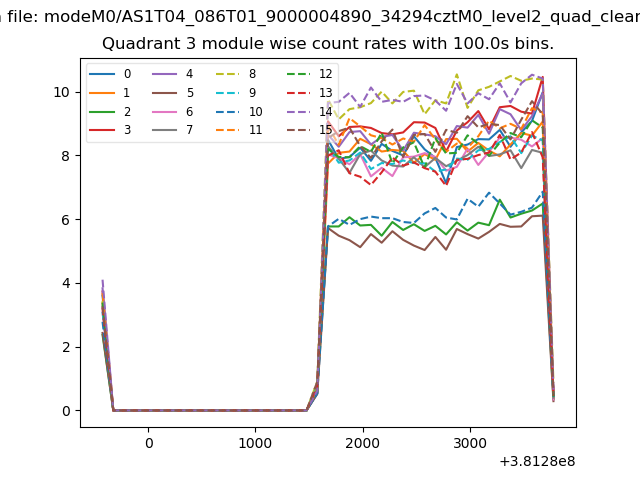
| Module-wise count rates for Quadrant A Data is divided into 100 sec bins |
 |
 |
| Module-wise count rates for Quadrant B Data is divided into 100 sec bins |
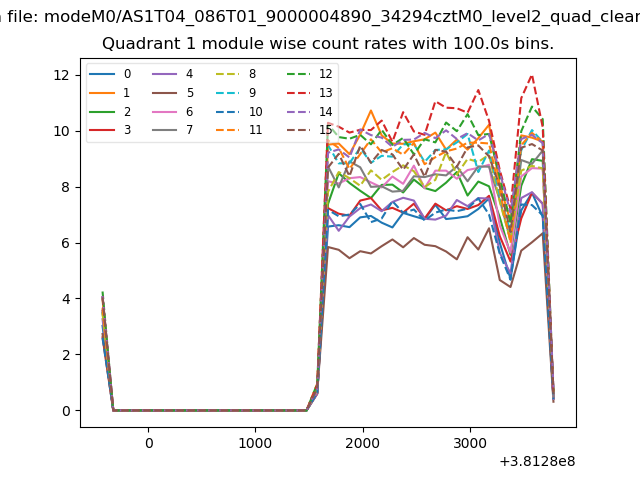 |
 |
| Module-wise count rates for Quadrant C Data is divided into 100 sec bins |
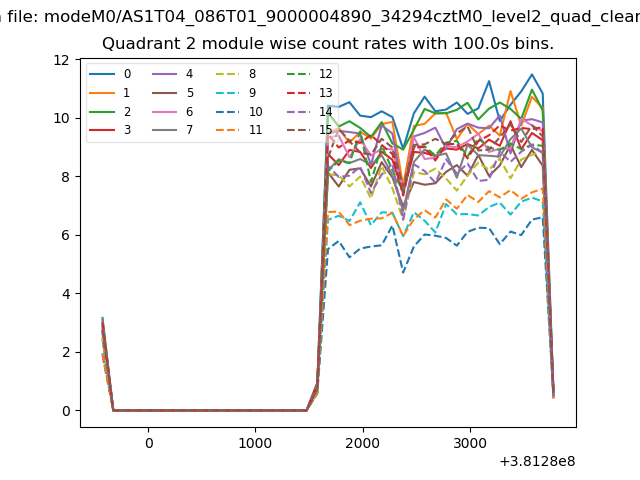 |
 |
| Module-wise count rates for Quadrant D Data is divided into 100 sec bins |
 |
 |
| Parameter | Plot |
|---|---|
| CZT HV Monitor | 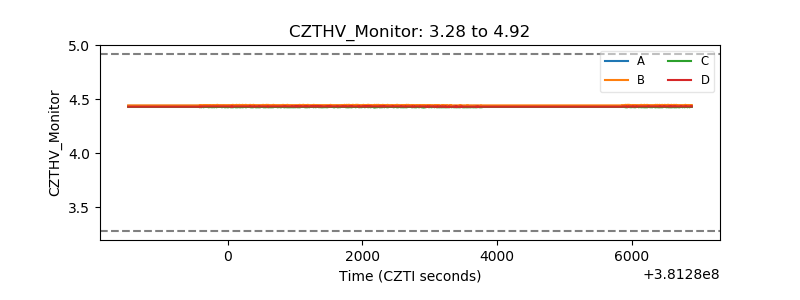 |
| D_VDD | 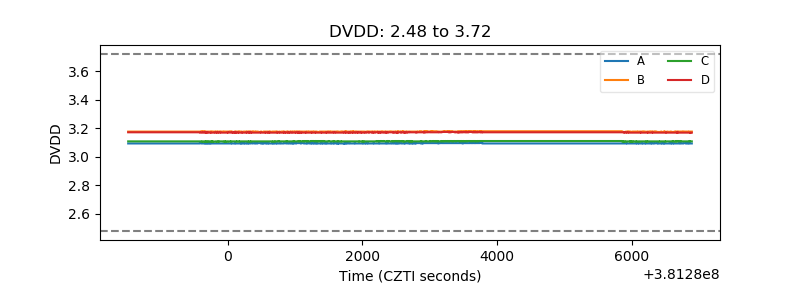 |
| Temperature 1 | 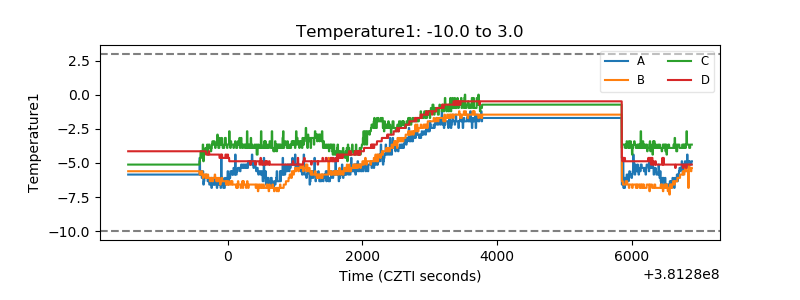 |
| Veto HV Monitor | 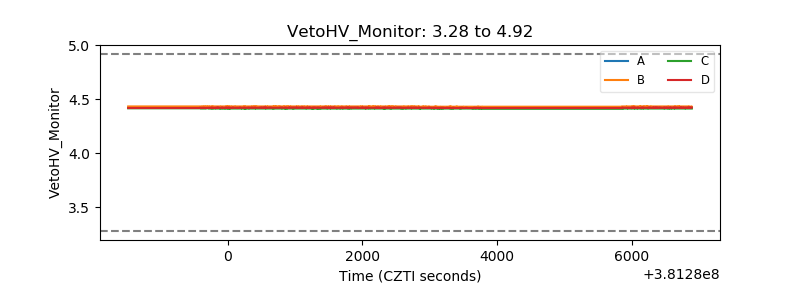 |
| Veto LLD | 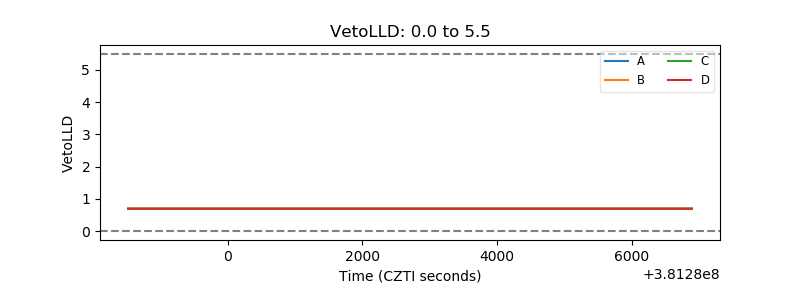 |
| Alpha Counter | 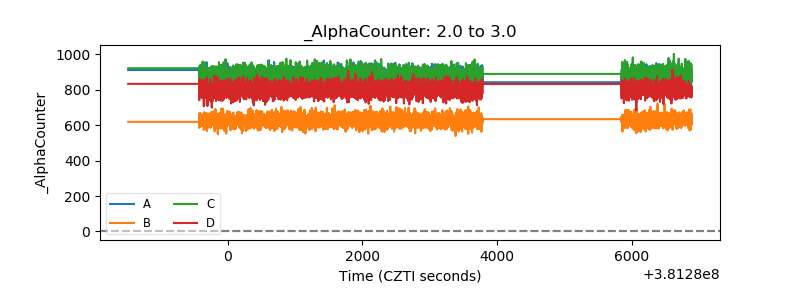 |
| _CPM_Rate | 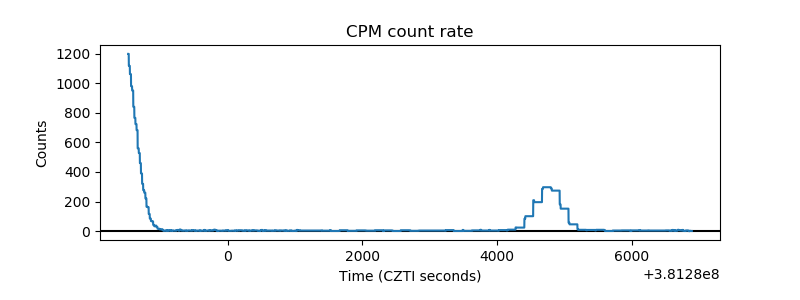 |
| CZT Counter | 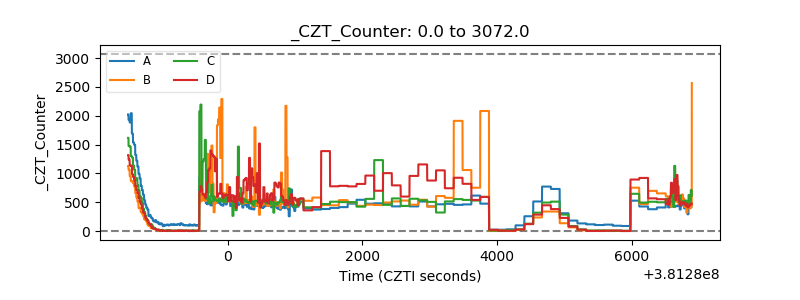 |
| +2.5 Volts monitor | 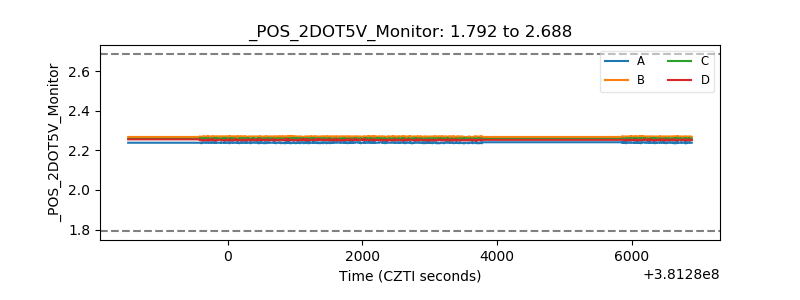 |
| +5 Volts monitor | 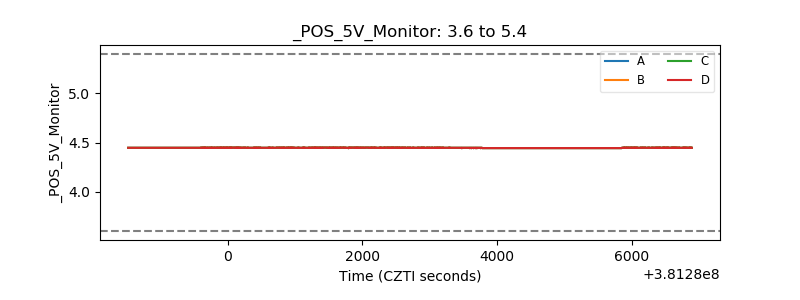 |
| _ROLL_ROT | 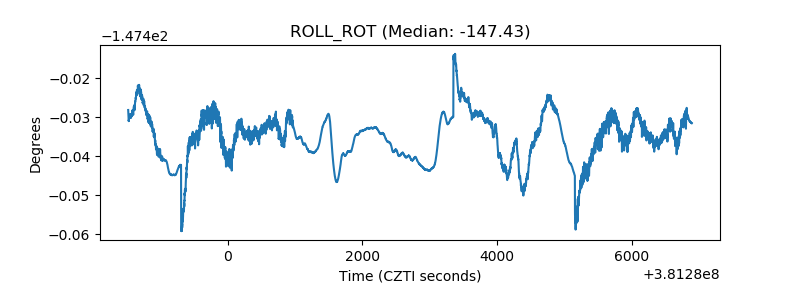 |
| _Roll_DEC | 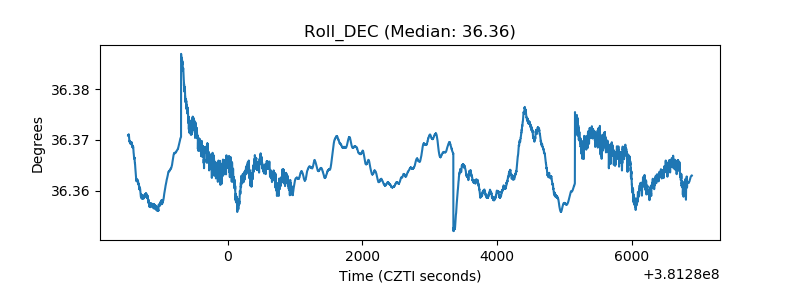 |
| _Roll_RA | 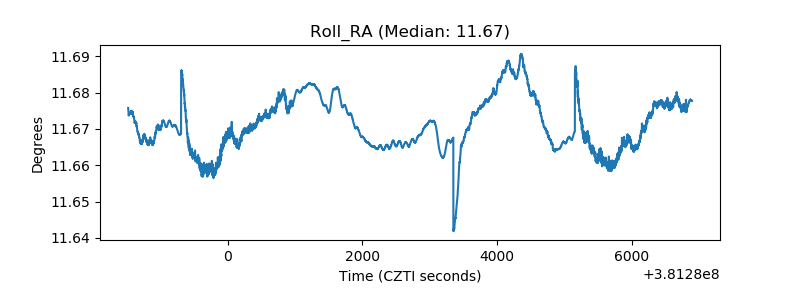 |
| Veto Counter | 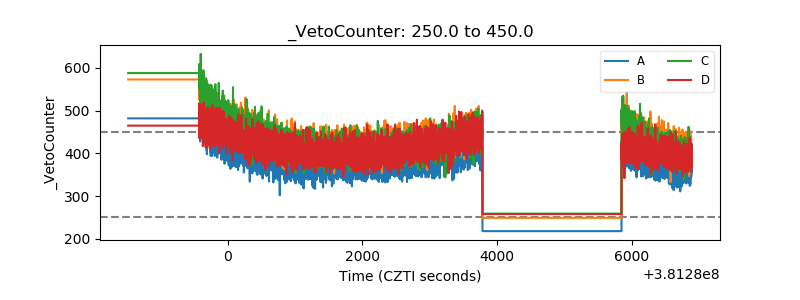 |