| Param | Original file | Final file |
|---|---|---|
| Filename | modeM0/AS1T04_086T01_9000004890_34293cztM0_level2.evt | modeM0/AS1T04_086T01_9000004890_34293cztM0_level2_quad_clean.evt |
| Size (bytes) | 424,687,680 | 51,566,400 |
| Size | 405.0 MB | 49.2 MB |
| Events in quadrant A | 2,439,310 | 298,267 |
| Events in quadrant B | 3,108,223 | 307,103 |
| Events in quadrant C | 3,073,309 | 307,436 |
| Events in quadrant D | 3,896,210 | 292,288 |
| Mode M0 | |||
|---|---|---|---|
| Quadrant | BADHDUFLAG | Total packets | Discarded packets |
| A | 0 | 10367 | 3 |
| B | 0 | 12385 | 2 |
| C | 0 | 11982 | 2 |
| D | 0 | 14989 | 2 |
| Mode SS | |||
|---|---|---|---|
| Quadrant | BADHDUFLAG | Total packets | Discarded packets |
| A | 0 | 104 | 0 |
| B | 0 | 104 | 0 |
| C | 0 | 104 | 0 |
| D | 0 | 104 | 0 |
| Mode M9 | |||
|---|---|---|---|
| Quadrant | BADHDUFLAG | Total packets | Discarded packets |
| A | 0 | 32 | 0 |
| B | 0 | 32 | 0 |
| C | 0 | 32 | 0 |
| D | 0 | 33 | 0 |
| Quadrant | Total seconds | Saturated seconds | Saturation percentage |
|---|---|---|---|
| A | 5076 | 12 | 0.236407% |
| B | 5076 | 115 | 2.265563% |
| C | 5076 | 98 | 1.930654% |
| D | 5076 | 109 | 2.147360% |
Noise dominated data is calculated using 1-second bins in cleaned event files. If a bin has >2000 counts, and if more than 50% of those come from <1% of pixels, then it is considered to be noise-dominated and hence unusable.
| Quadrant | # 1 sec bins | Bins with >0 counts | Bins with >2000 counts | High rate bins dominated by noise | Noise dominated (total time) | Noise dominated (detector-on time) | Marked lightcurve |
|---|---|---|---|---|---|---|---|
| A | 7201 | 5077 | 4 | 4 | 0.06% | 0.08% | 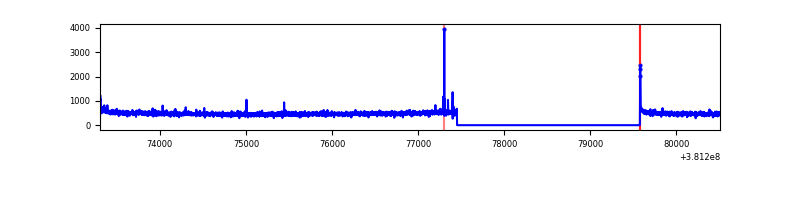 |
| B | 7201 | 5077 | 75 | 75 | 1.04% | 1.48% | 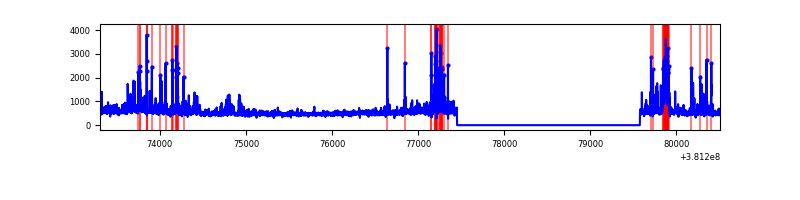 |
| C | 7201 | 5077 | 76 | 76 | 1.06% | 1.50% | 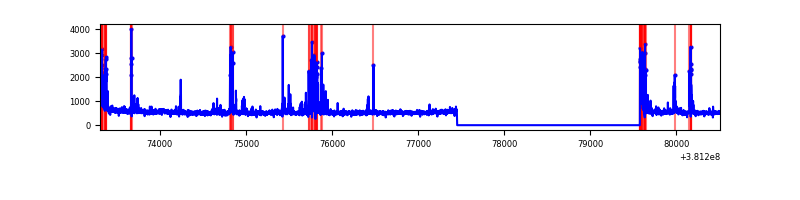 |
| D | 7201 | 5077 | 88 | 88 | 1.22% | 1.73% | 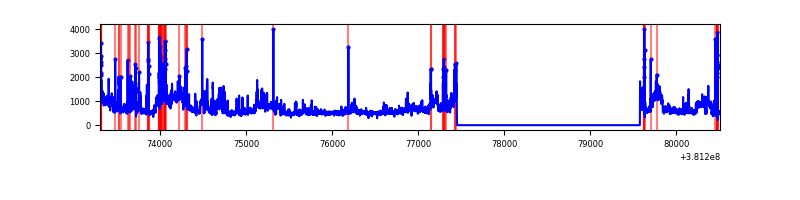 |
Top three noisy pixels from each quadrant. If the there are fewer than three noisy pixels in the level2.evt file, extra rows are filled as -1
| Pixel properties | Quadrant properties | ||||||
|---|---|---|---|---|---|---|---|
| Quadrant | DetID | PixID | Counts | Sigma | Mean | Median | Sigma |
| A | 10 | 83 | 26580 | 213.08 | 613 | 602 | 121.9 |
| A | 9 | 143 | 21829 | 174.11 | 613 | 602 | 121.9 |
| A | 10 | 255 | 13437 | 105.28 | 613 | 602 | 121.9 |
| B | 5 | 172 | 340618 | 2902.66 | 617 | 601 | 117.1 |
| B | 4 | 251 | 163195 | 1388.03 | 617 | 601 | 117.1 |
| B | 0 | 182 | 70787 | 599.16 | 617 | 601 | 117.1 |
| C | 14 | 254 | 296452 | 2075.3 | 611 | 617 | 142.6 |
| C | 15 | 214 | 221565 | 1549.96 | 611 | 617 | 142.6 |
| C | 0 | 10 | 127470 | 889.88 | 611 | 617 | 142.6 |
| D | 8 | 195 | 770785 | 4794.13 | 597 | 588 | 160.7 |
| D | 12 | 235 | 360283 | 2238.94 | 597 | 588 | 160.7 |
| D | 2 | 250 | 161465 | 1001.39 | 597 | 588 | 160.7 |
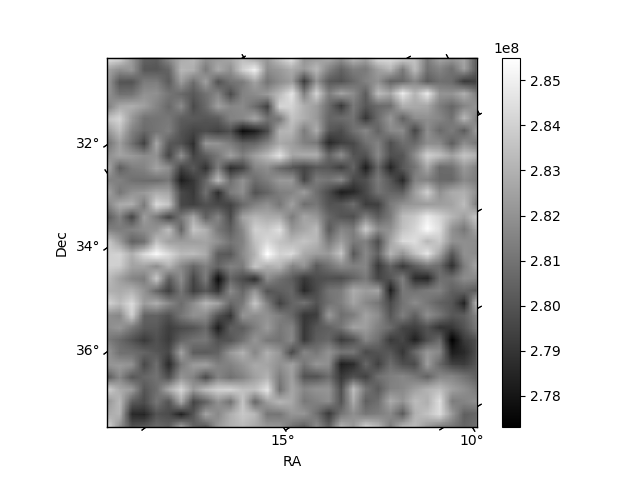
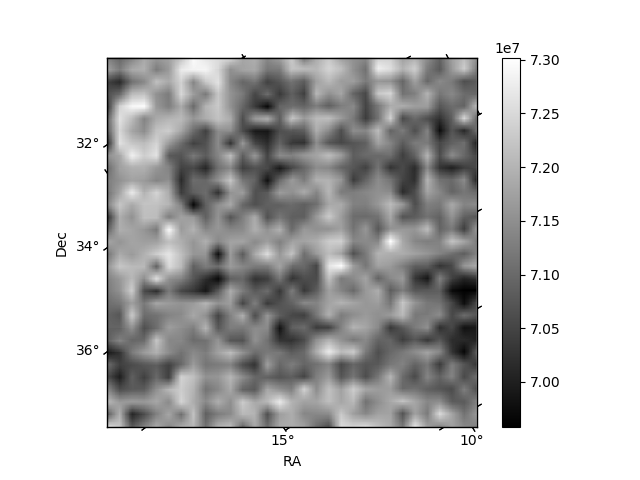
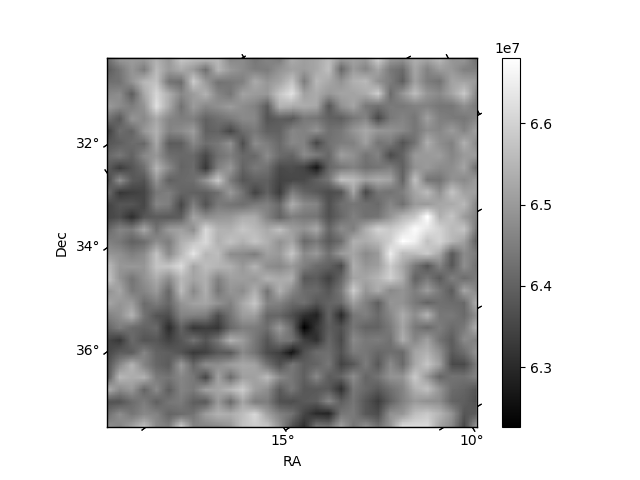
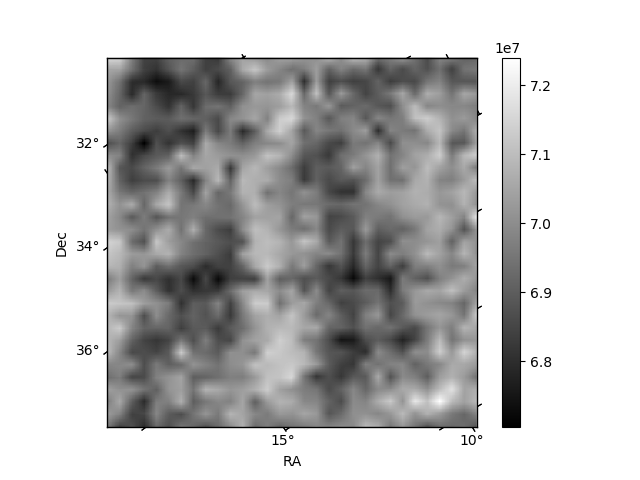
Histogram calculated using DETX and DETY for each event in the final _common_clean file
| Quadrant A | 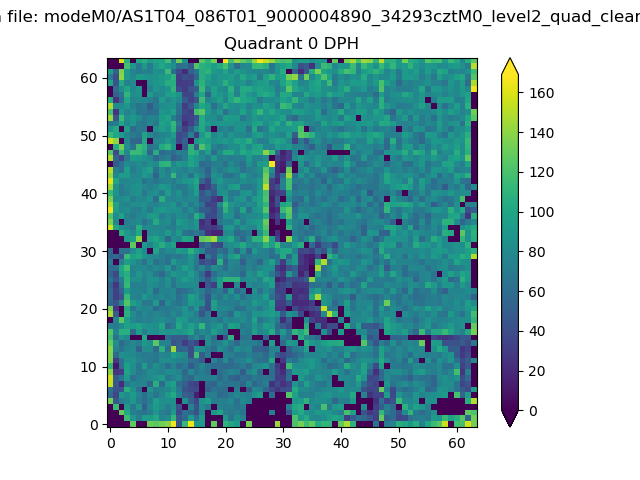 |
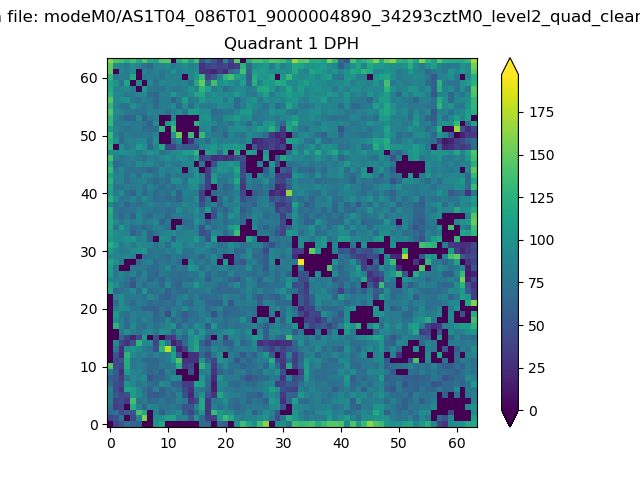 |
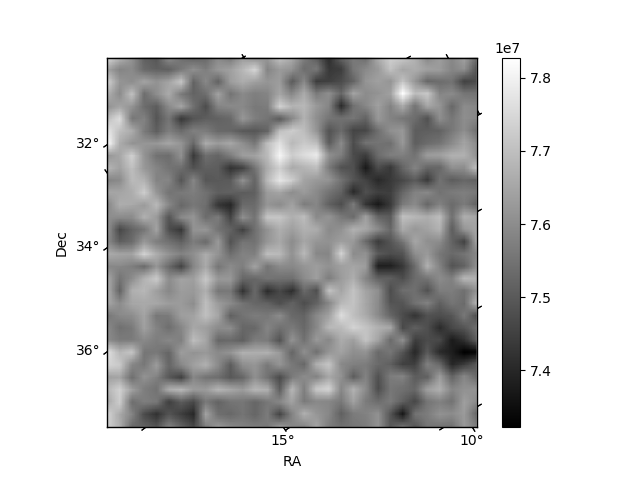
Quadrant B |
|---|---|---|---|
| Quadrant D | 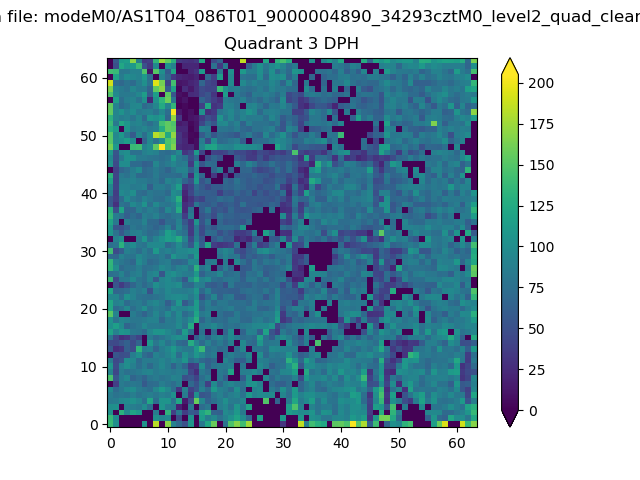 |
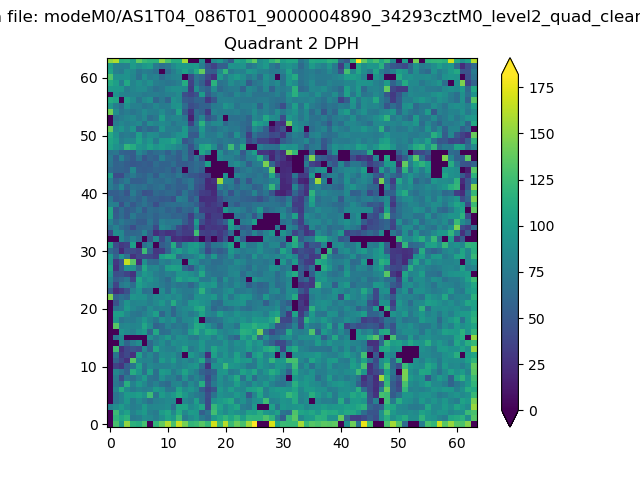 |
Quadrant C |
| Plot type | Count rate plots | Images |
|---|---|---|
| Comparison with Poisson distribution Blue bars denote a histogram of data divided into 1 sec bins. Red curve is a Poisson curve with rate = median count rate of data. |
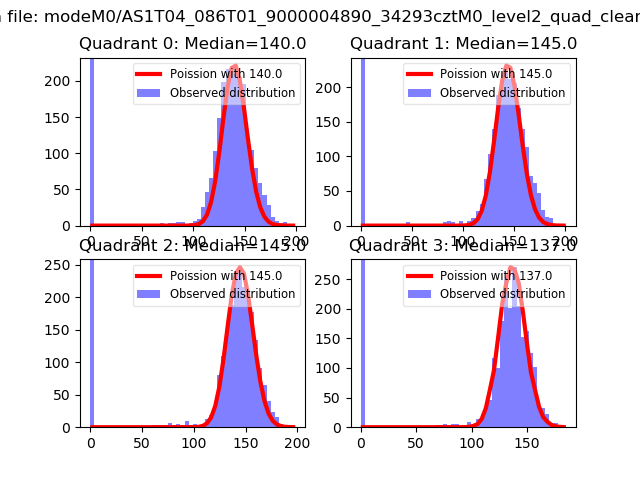 |
 |
| Quadrant-wise count rates Data is divided into 100 sec bins |
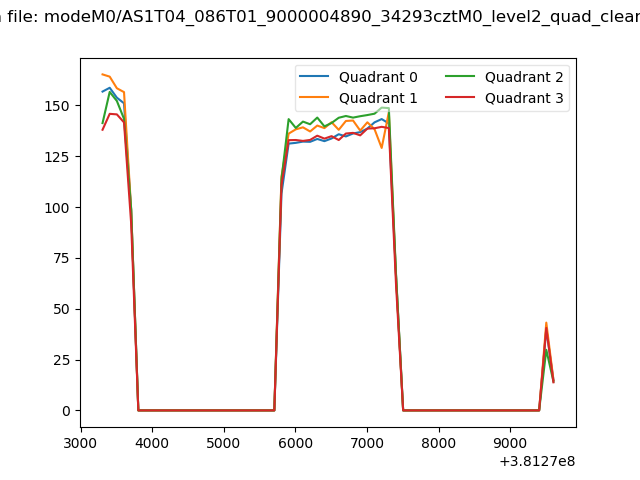 |
|
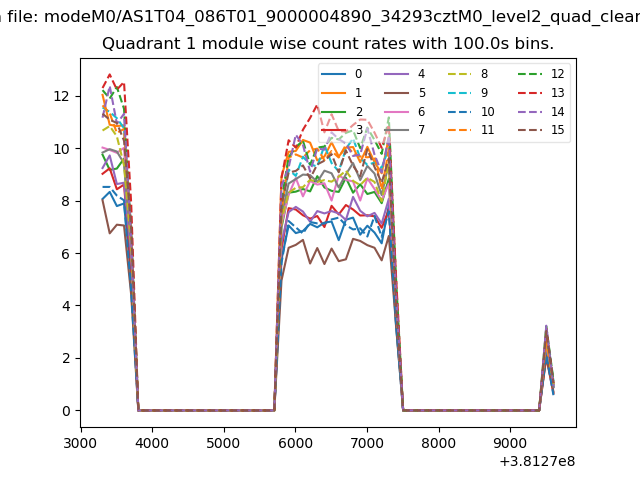
| Module-wise count rates for Quadrant A Data is divided into 100 sec bins |
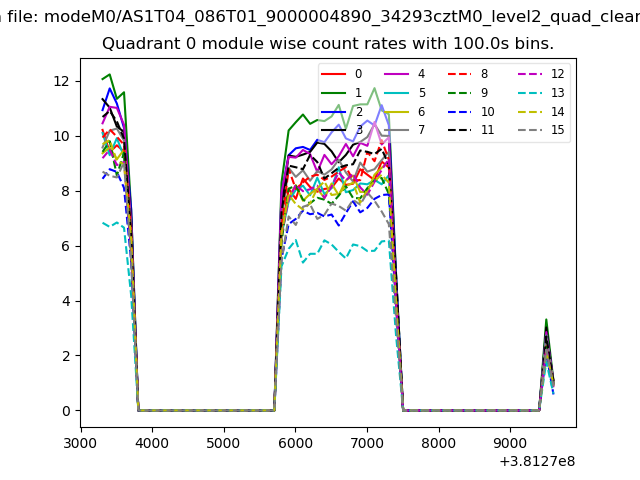 |
 |
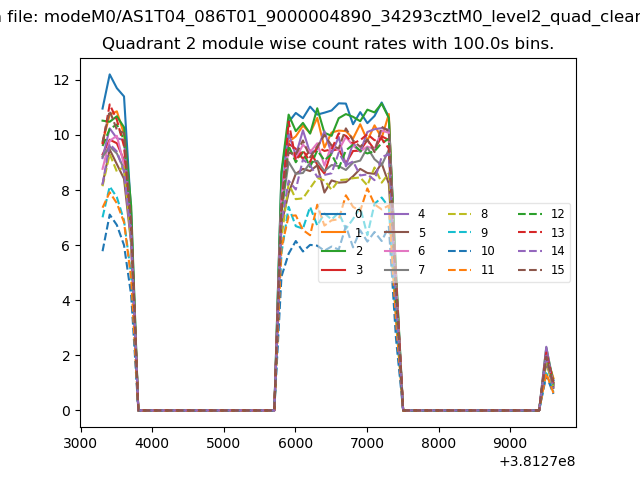
| Module-wise count rates for Quadrant B Data is divided into 100 sec bins |
 |
 |
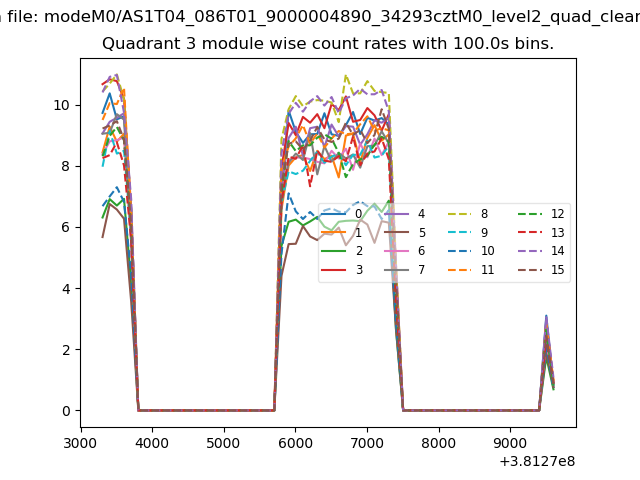
| Module-wise count rates for Quadrant C Data is divided into 100 sec bins |
 |
 |
| Module-wise count rates for Quadrant D Data is divided into 100 sec bins |
 |
 |
| Parameter | Plot |
|---|---|
| CZT HV Monitor |  |
| D_VDD | 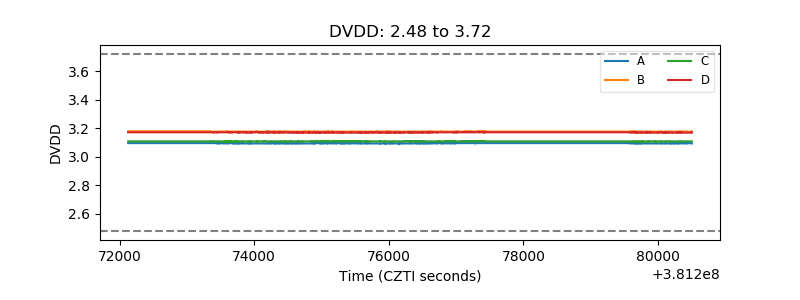 |
| Temperature 1 | 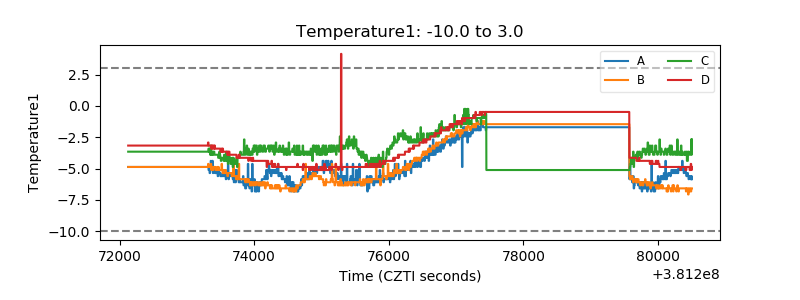 |
| Veto HV Monitor | 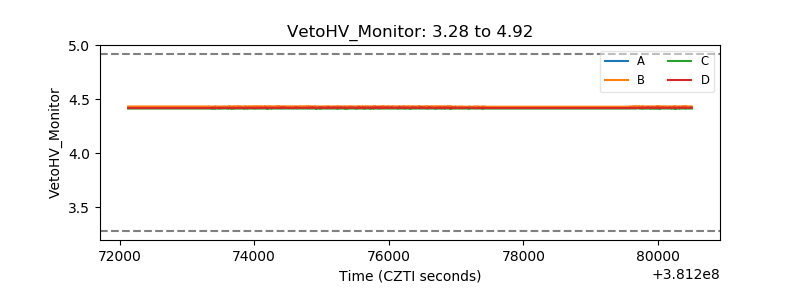 |
| Veto LLD | 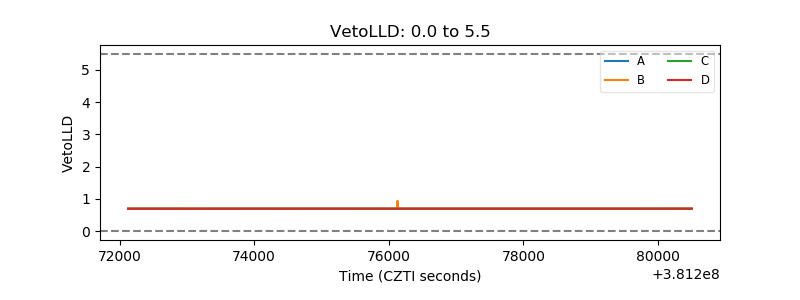 |
| Alpha Counter | 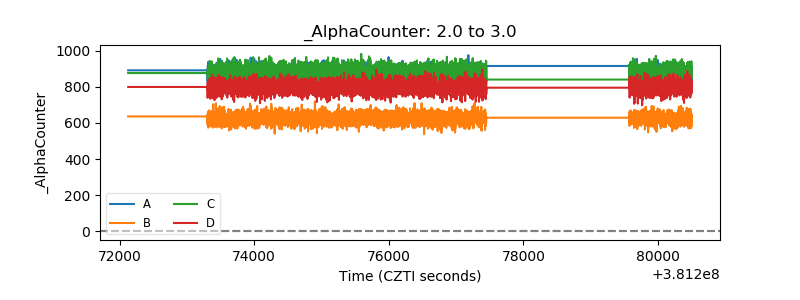 |
| _CPM_Rate | 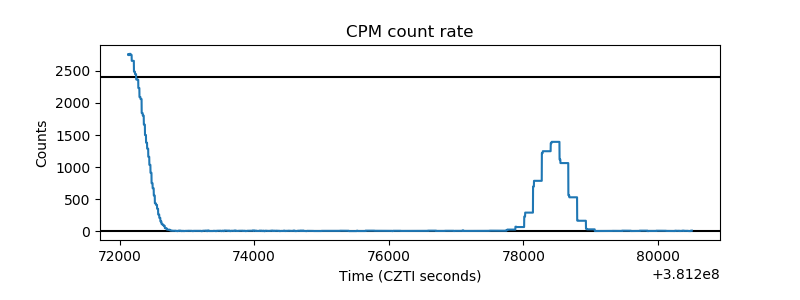 |
| CZT Counter | 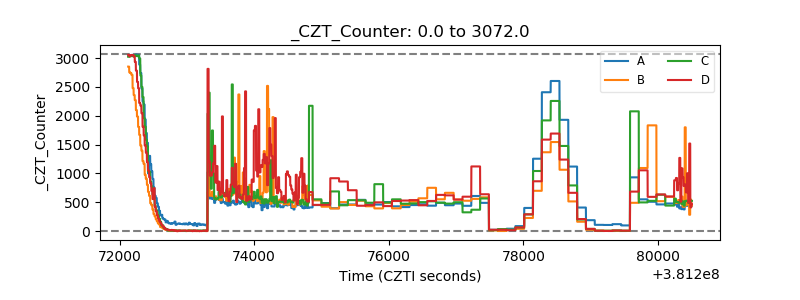 |
| +2.5 Volts monitor | 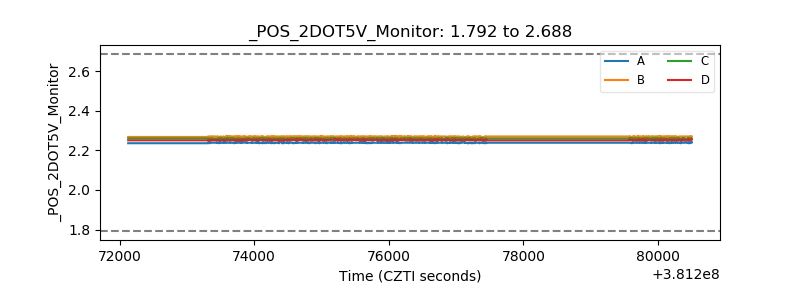 |
| +5 Volts monitor | 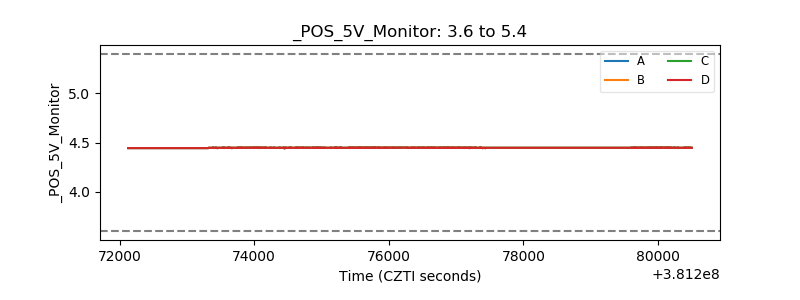 |
| _ROLL_ROT | 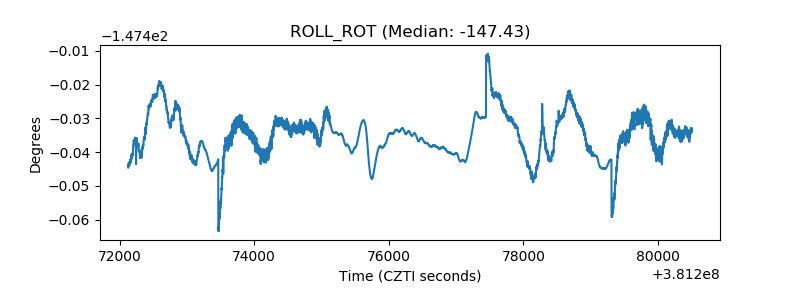 |
| _Roll_DEC | 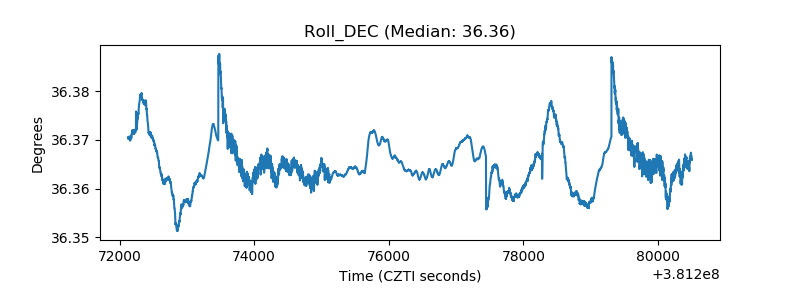 |
| _Roll_RA | 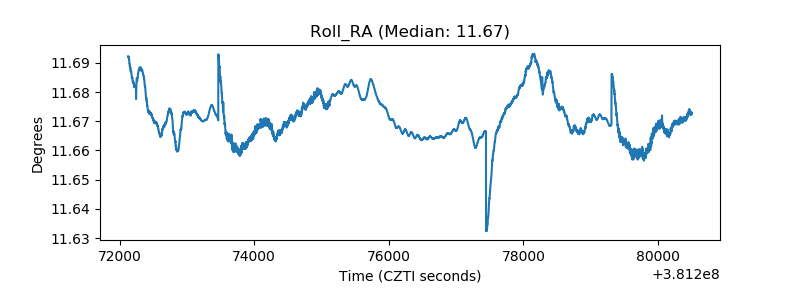 |
| Veto Counter | 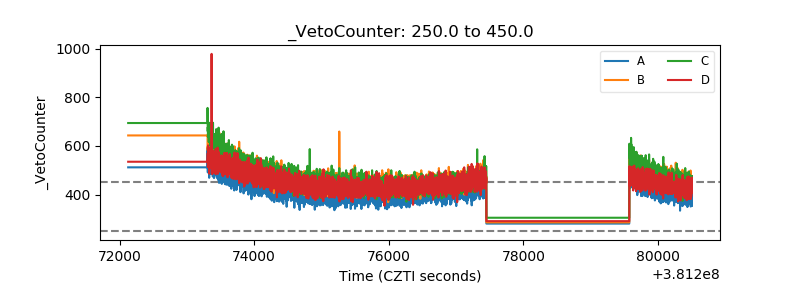 |