| Param | Original file | Final file |
|---|---|---|
| Filename | modeM0/AS1T04_086T01_9000004890_34290cztM0_level2.evt | modeM0/AS1T04_086T01_9000004890_34290cztM0_level2_quad_clean.evt |
| Size (bytes) | 481,072,320 | 70,453,440 |
| Size | 458.8 MB | 67.2 MB |
| Events in quadrant A | 2,502,063 | 450,564 |
| Events in quadrant B | 3,317,581 | 458,172 |
| Events in quadrant C | 3,343,757 | 446,407 |
| Events in quadrant D | 5,057,869 | 418,036 |
| Mode M0 | |||
|---|---|---|---|
| Quadrant | BADHDUFLAG | Total packets | Discarded packets |
| A | 0 | 10681 | 2 |
| B | 0 | 13128 | 1 |
| C | 0 | 12889 | 1 |
| D | 0 | 18609 | 1 |
| Mode SS | |||
|---|---|---|---|
| Quadrant | BADHDUFLAG | Total packets | Discarded packets |
| A | 0 | 104 | 0 |
| B | 0 | 104 | 0 |
| C | 0 | 104 | 0 |
| D | 0 | 104 | 0 |
| Mode M9 | |||
|---|---|---|---|
| Quadrant | BADHDUFLAG | Total packets | Discarded packets |
| A | 0 | 19 | 0 |
| B | 0 | 19 | 0 |
| C | 0 | 19 | 0 |
| D | 0 | 19 | 0 |
| Quadrant | Total seconds | Saturated seconds | Saturation percentage |
|---|---|---|---|
| A | 5142 | 9 | 0.175029% |
| B | 5142 | 96 | 1.866978% |
| C | 5142 | 176 | 3.422793% |
| D | 5142 | 273 | 5.309218% |
Noise dominated data is calculated using 1-second bins in cleaned event files. If a bin has >2000 counts, and if more than 50% of those come from <1% of pixels, then it is considered to be noise-dominated and hence unusable.
| Quadrant | # 1 sec bins | Bins with >0 counts | Bins with >2000 counts | High rate bins dominated by noise | Noise dominated (total time) | Noise dominated (detector-on time) | Marked lightcurve |
|---|---|---|---|---|---|---|---|
| A | 7054 | 5143 | 2 | 2 | 0.03% | 0.04% | 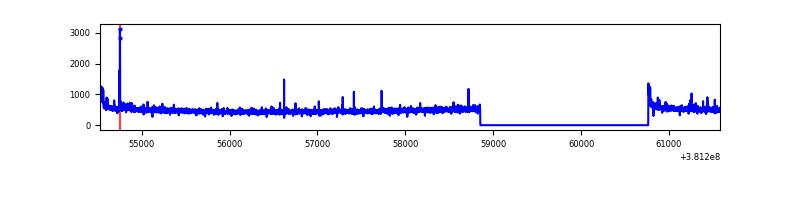 |
| B | 7054 | 5143 | 65 | 65 | 0.92% | 1.26% | 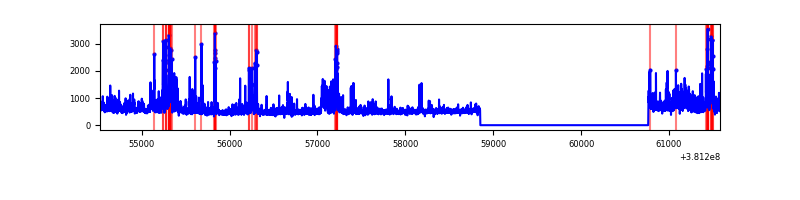 |
| C | 7054 | 5143 | 141 | 141 | 2.00% | 2.74% | 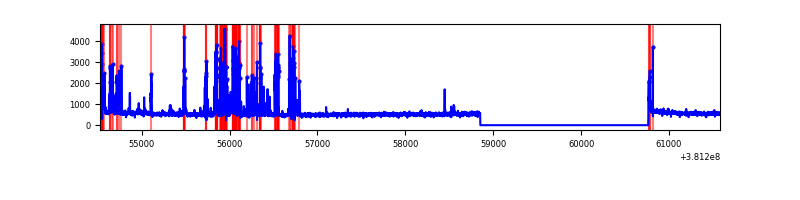 |
| D | 7054 | 5143 | 260 | 260 | 3.69% | 5.06% | 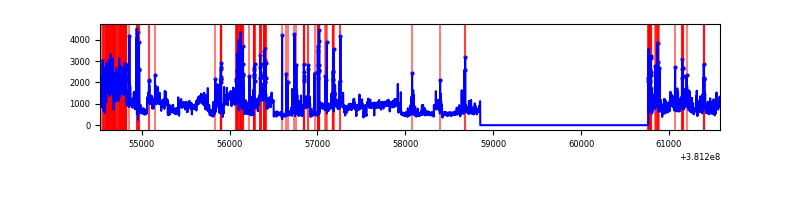 |
Top three noisy pixels from each quadrant. If the there are fewer than three noisy pixels in the level2.evt file, extra rows are filled as -1
| Pixel properties | Quadrant properties | ||||||
|---|---|---|---|---|---|---|---|
| Quadrant | DetID | PixID | Counts | Sigma | Mean | Median | Sigma |
| A | 9 | 143 | 41733 | 330.51 | 625 | 612 | 124.4 |
| A | 10 | 83 | 23503 | 183.99 | 625 | 612 | 124.4 |
| A | 15 | 223 | 9399 | 70.63 | 625 | 612 | 124.4 |
| B | 5 | 172 | 381495 | 3234.58 | 625 | 609 | 117.8 |
| B | 4 | 251 | 169275 | 1432.36 | 625 | 609 | 117.8 |
| B | 0 | 229 | 101460 | 856.45 | 625 | 609 | 117.8 |
| C | 14 | 254 | 680868 | 4856.86 | 613 | 620 | 140.1 |
| C | 15 | 214 | 221014 | 1573.58 | 613 | 620 | 140.1 |
| C | 0 | 10 | 35098 | 246.17 | 613 | 620 | 140.1 |
| D | 8 | 195 | 1423420 | 8811.4 | 606 | 595 | 161.5 |
| D | 7 | 223 | 531021 | 3284.87 | 606 | 595 | 161.5 |
| D | 12 | 235 | 278799 | 1722.89 | 606 | 595 | 161.5 |
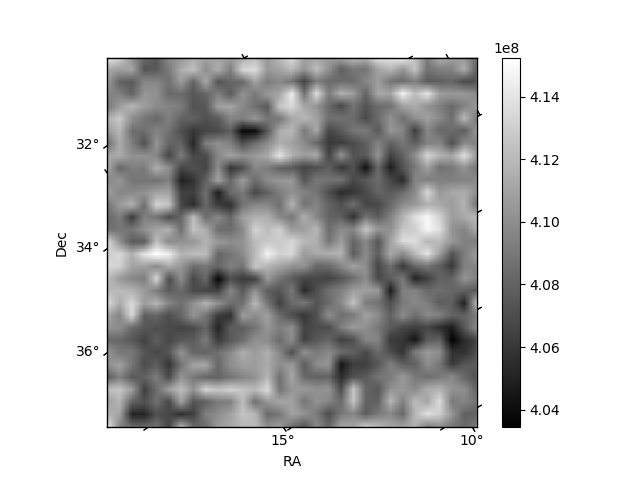
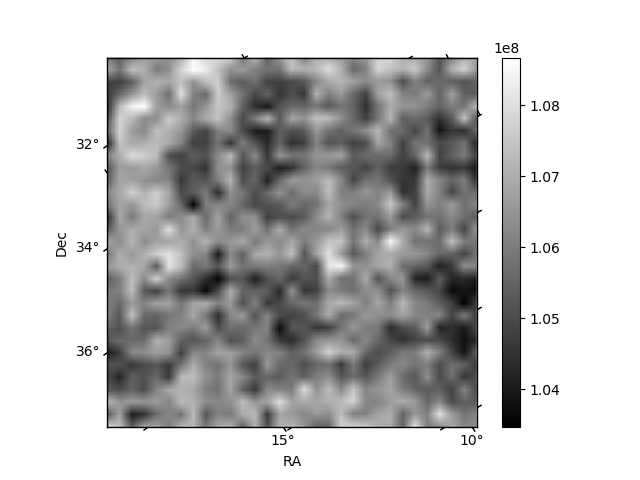
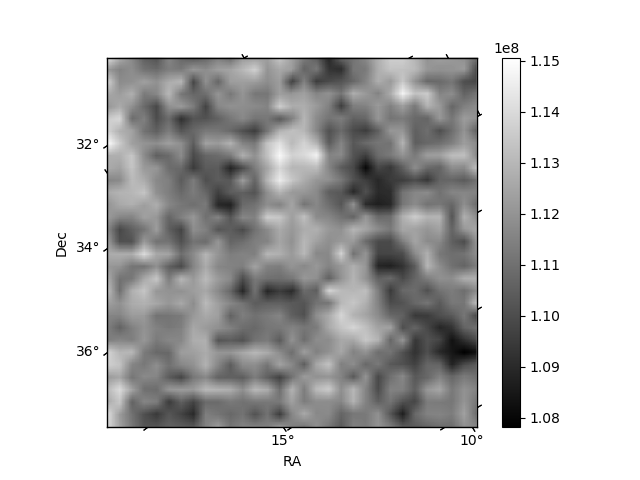
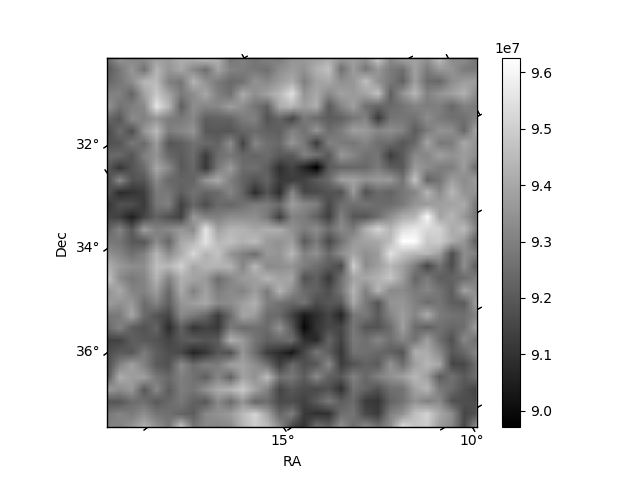
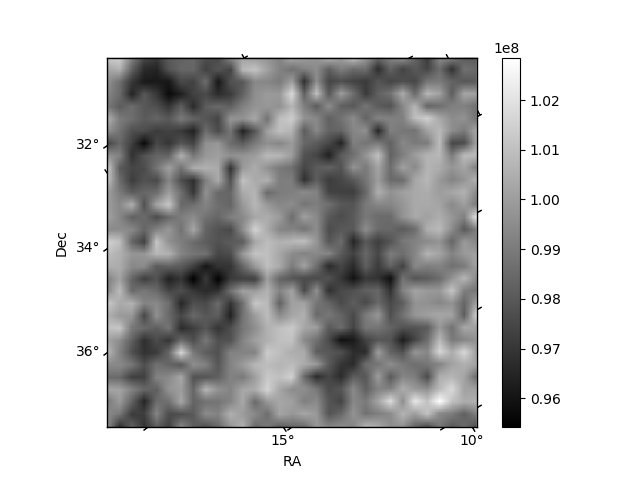
Histogram calculated using DETX and DETY for each event in the final _common_clean file
| Quadrant A | 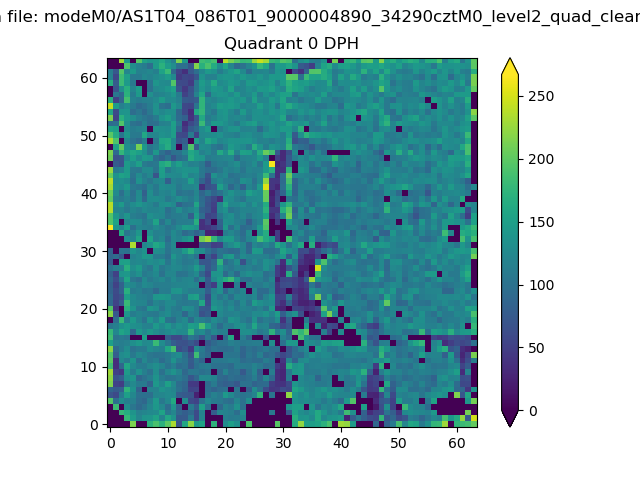 |
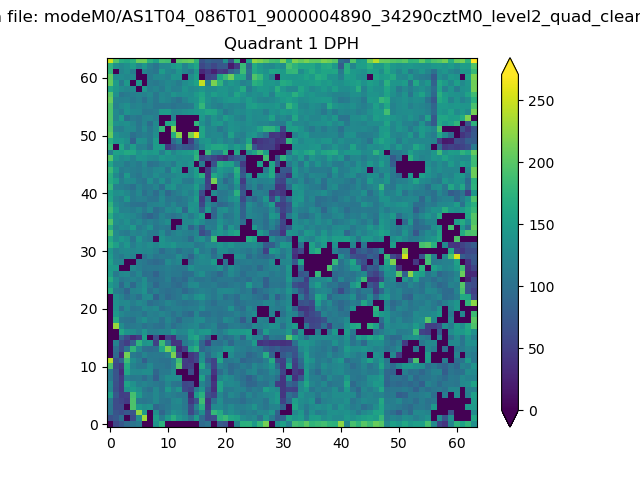 |
Quadrant B |
|---|---|---|---|
| Quadrant D | 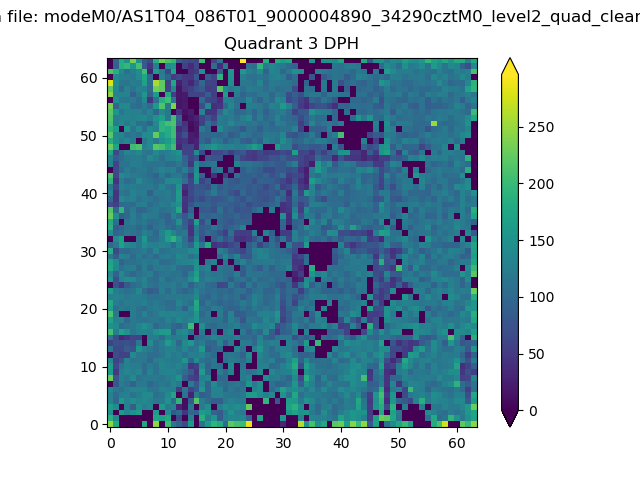 |
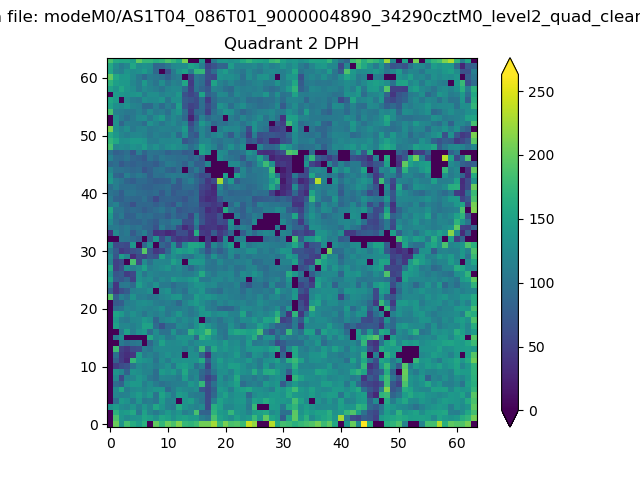 |
Quadrant C |
| Plot type | Count rate plots | Images |
|---|---|---|
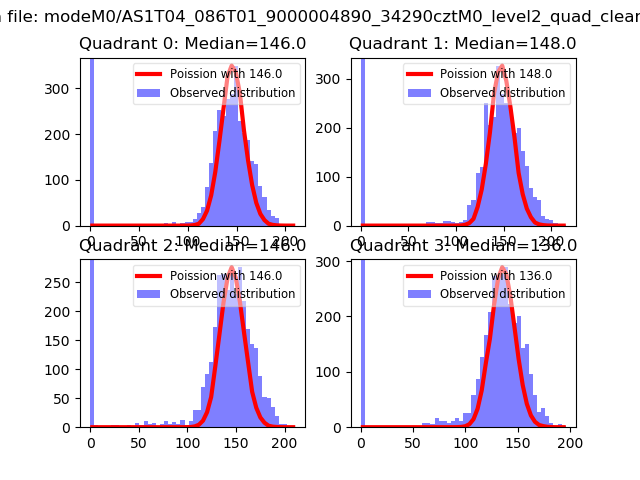
| Comparison with Poisson distribution Blue bars denote a histogram of data divided into 1 sec bins. Red curve is a Poisson curve with rate = median count rate of data. |
 |
 |
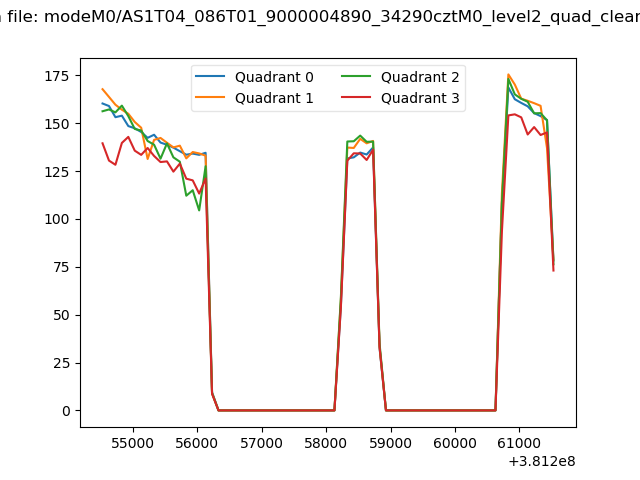
| Quadrant-wise count rates Data is divided into 100 sec bins |
 |
|
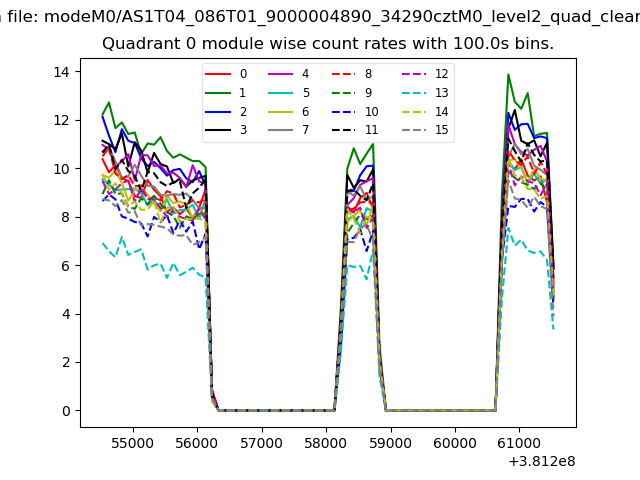
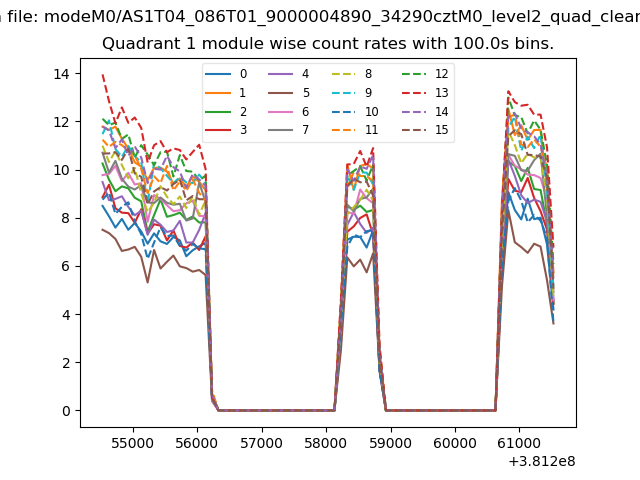
| Module-wise count rates for Quadrant A Data is divided into 100 sec bins |
 |
 |
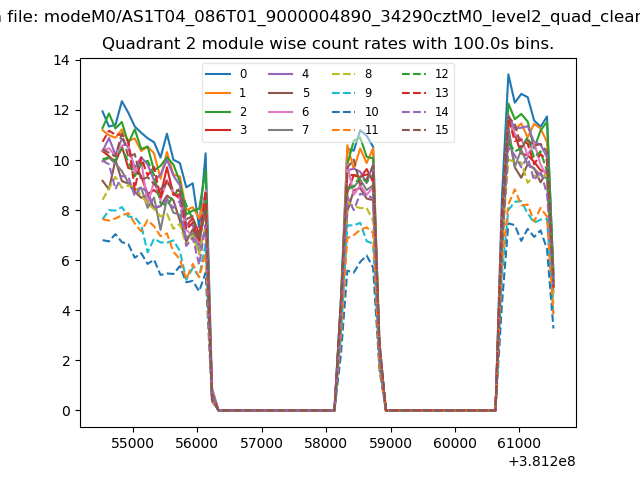
| Module-wise count rates for Quadrant B Data is divided into 100 sec bins |
 |
 |
| Module-wise count rates for Quadrant C Data is divided into 100 sec bins |
 |
 |
| Module-wise count rates for Quadrant D Data is divided into 100 sec bins |
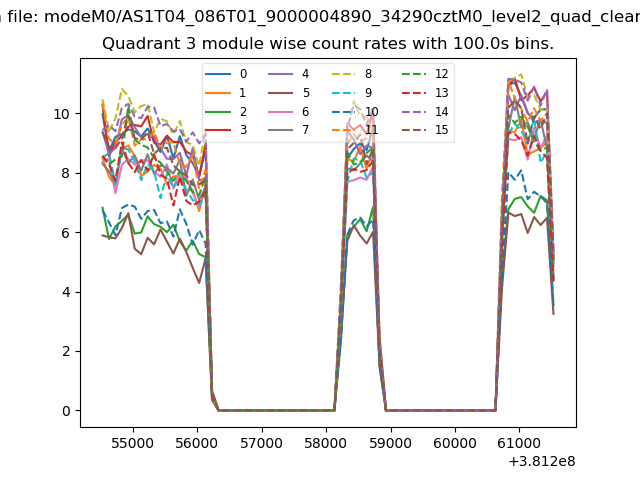 |
 |
| Parameter | Plot |
|---|---|
| CZT HV Monitor | 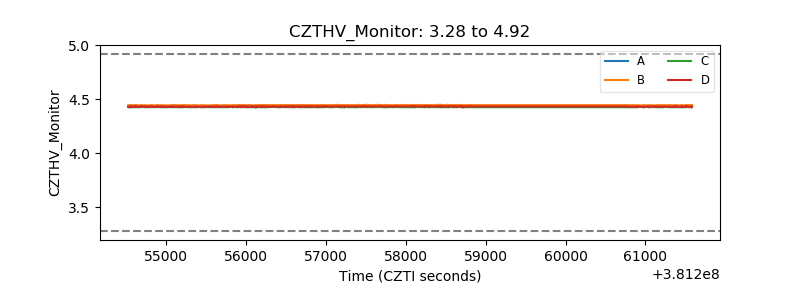 |
| D_VDD | 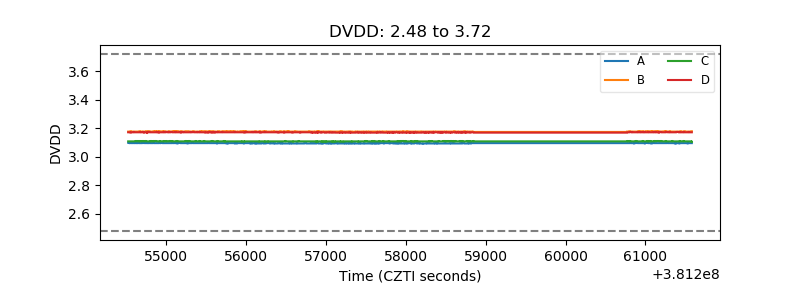 |
| Temperature 1 | 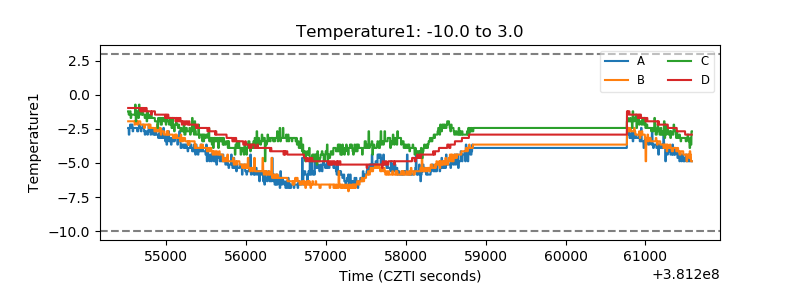 |
| Veto HV Monitor | 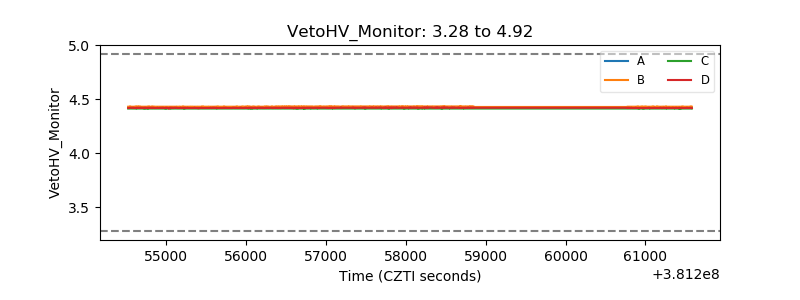 |
| Veto LLD | 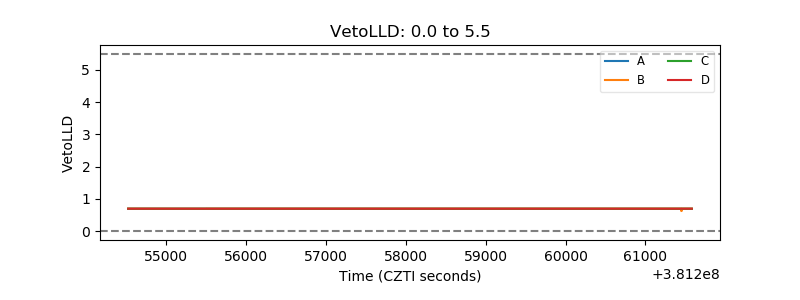 |
| Alpha Counter | 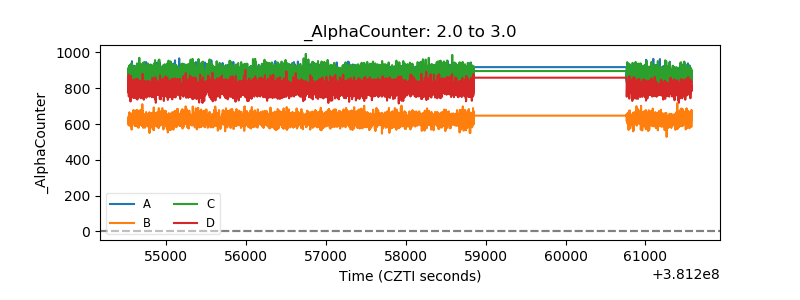 |
| _CPM_Rate | 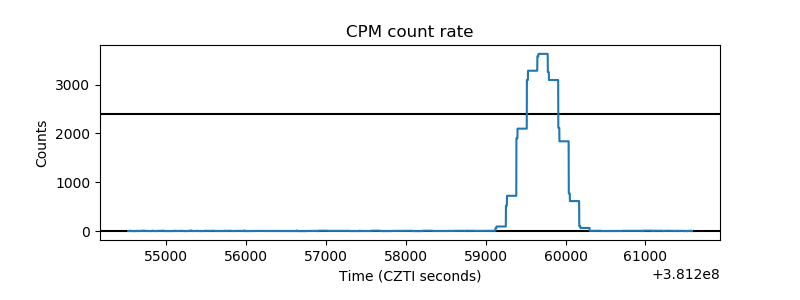 |
| CZT Counter | 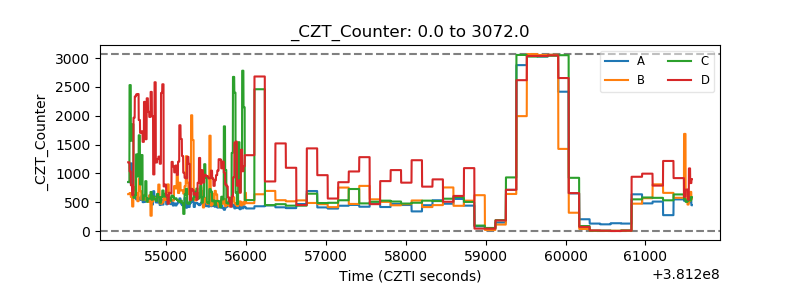 |
| +2.5 Volts monitor | 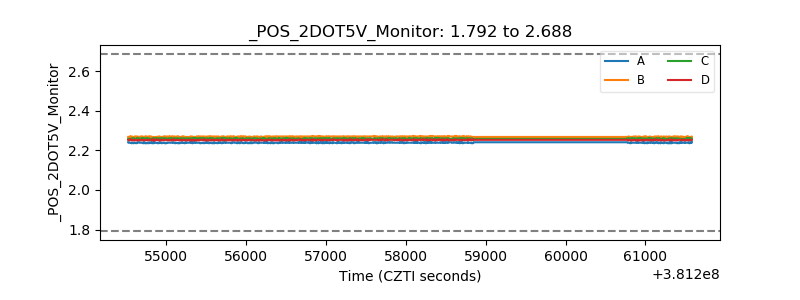 |
| +5 Volts monitor | 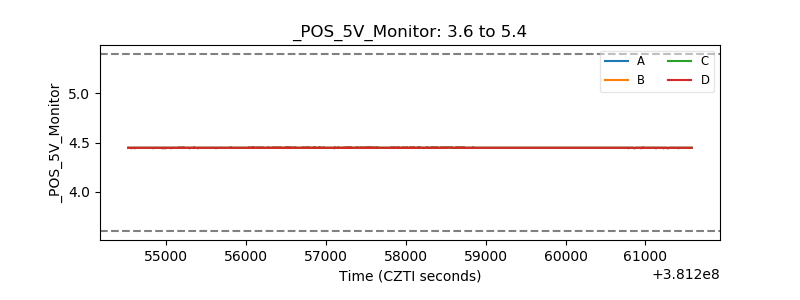 |
| _ROLL_ROT | 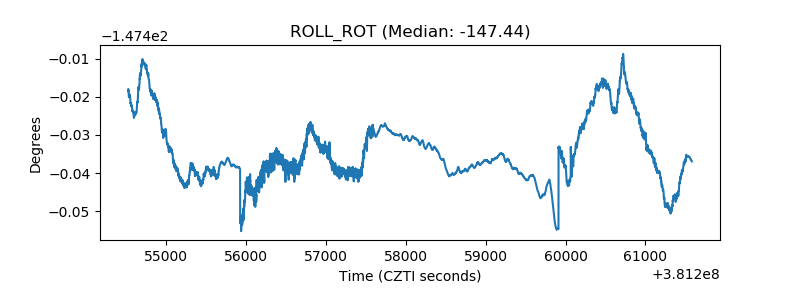 |
| _Roll_DEC | 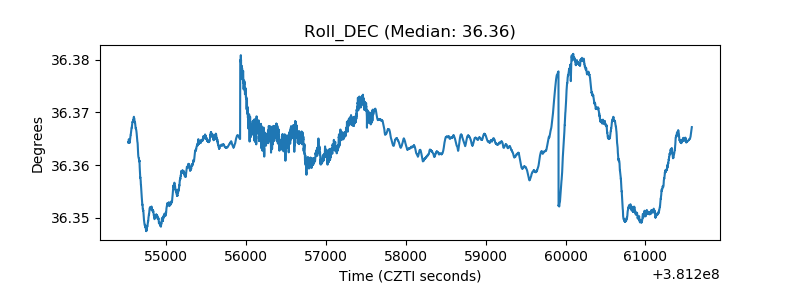 |
| _Roll_RA | 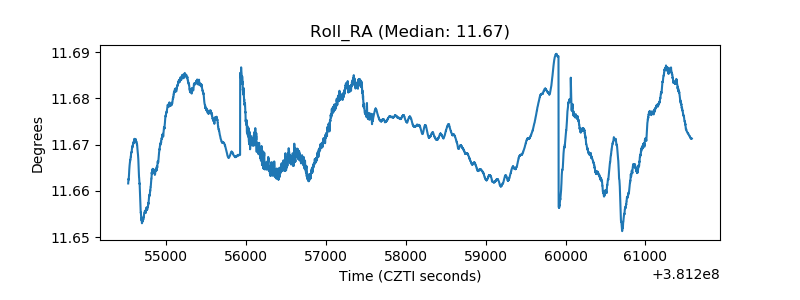 |
| Veto Counter | 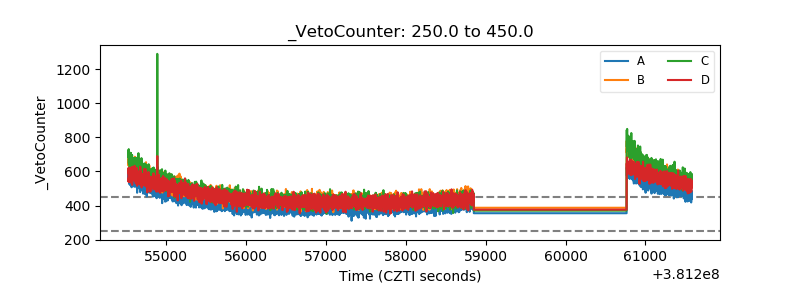 |