| Param | Original file | Final file |
|---|---|---|
| Filename | modeM0/AS1T04_086T01_9000004890_34289cztM0_level2.evt | modeM0/AS1T04_086T01_9000004890_34289cztM0_level2_quad_clean.evt |
| Size (bytes) | 521,294,400 | 71,354,880 |
| Size | 497.1 MB | 68.0 MB |
| Events in quadrant A | 2,573,508 | 460,740 |
| Events in quadrant B | 3,582,640 | 458,123 |
| Events in quadrant C | 3,124,233 | 447,248 |
| Events in quadrant D | 6,141,221 | 416,230 |
| Mode M0 | |||
|---|---|---|---|
| Quadrant | BADHDUFLAG | Total packets | Discarded packets |
| A | 0 | 11160 | 2 |
| B | 0 | 14068 | 1 |
| C | 0 | 12407 | 1 |
| D | 0 | 22081 | 1 |
| Mode SS | |||
|---|---|---|---|
| Quadrant | BADHDUFLAG | Total packets | Discarded packets |
| A | 0 | 110 | 0 |
| B | 0 | 110 | 0 |
| C | 0 | 110 | 0 |
| D | 0 | 110 | 0 |
| Mode M9 | |||
|---|---|---|---|
| Quadrant | BADHDUFLAG | Total packets | Discarded packets |
| A | 0 | 18 | 0 |
| B | 0 | 18 | 0 |
| C | 0 | 18 | 0 |
| D | 0 | 18 | 0 |
| Quadrant | Total seconds | Saturated seconds | Saturation percentage |
|---|---|---|---|
| A | 5399 | 15 | 0.277829% |
| B | 5399 | 203 | 3.759956% |
| C | 5399 | 150 | 2.778292% |
| D | 5399 | 558 | 10.335247% |
Noise dominated data is calculated using 1-second bins in cleaned event files. If a bin has >2000 counts, and if more than 50% of those come from <1% of pixels, then it is considered to be noise-dominated and hence unusable.
| Quadrant | # 1 sec bins | Bins with >0 counts | Bins with >2000 counts | High rate bins dominated by noise | Noise dominated (total time) | Noise dominated (detector-on time) | Marked lightcurve |
|---|---|---|---|---|---|---|---|
| A | 7191 | 5400 | 4 | 4 | 0.06% | 0.07% |  |
| B | 7191 | 5400 | 154 | 154 | 2.14% | 2.85% | 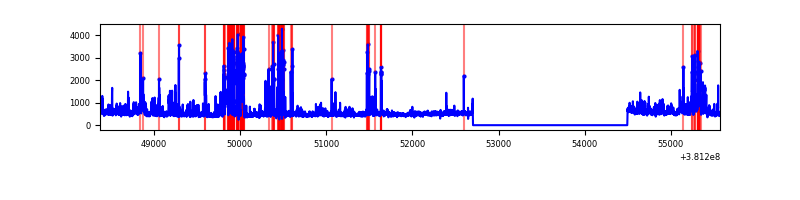 |
| C | 7191 | 5400 | 95 | 95 | 1.32% | 1.76% | 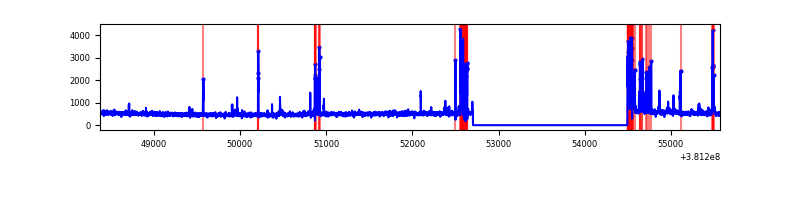 |
| D | 7191 | 5400 | 538 | 538 | 7.48% | 9.96% | 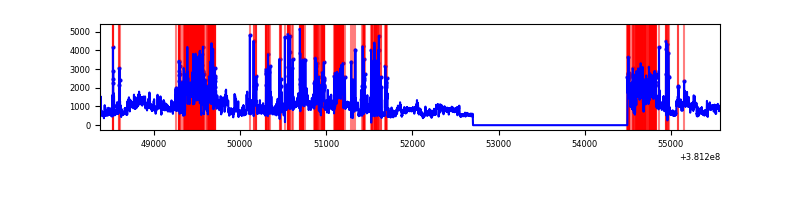 |
Top three noisy pixels from each quadrant. If the there are fewer than three noisy pixels in the level2.evt file, extra rows are filled as -1
| Pixel properties | Quadrant properties | ||||||
|---|---|---|---|---|---|---|---|
| Quadrant | DetID | PixID | Counts | Sigma | Mean | Median | Sigma |
| A | 9 | 143 | 62261 | 484.48 | 633 | 621 | 127.2 |
| A | 15 | 223 | 30560 | 235.32 | 633 | 621 | 127.2 |
| A | 10 | 83 | 18905 | 143.71 | 633 | 621 | 127.2 |
| B | 5 | 172 | 556744 | 4716.04 | 628 | 612 | 117.9 |
| B | 0 | 229 | 224588 | 1899.33 | 628 | 612 | 117.9 |
| B | 4 | 251 | 205595 | 1738.27 | 628 | 612 | 117.9 |
| C | 14 | 254 | 406983 | 2884.79 | 616 | 621 | 140.9 |
| C | 15 | 214 | 228515 | 1617.83 | 616 | 621 | 140.9 |
| C | 0 | 10 | 50834 | 356.47 | 616 | 621 | 140.9 |
| D | 8 | 195 | 1436642 | 9615.58 | 607 | 591 | 149.3 |
| D | 12 | 235 | 1072158 | 7175.05 | 607 | 591 | 149.3 |
| D | 7 | 223 | 974401 | 6520.48 | 607 | 591 | 149.3 |
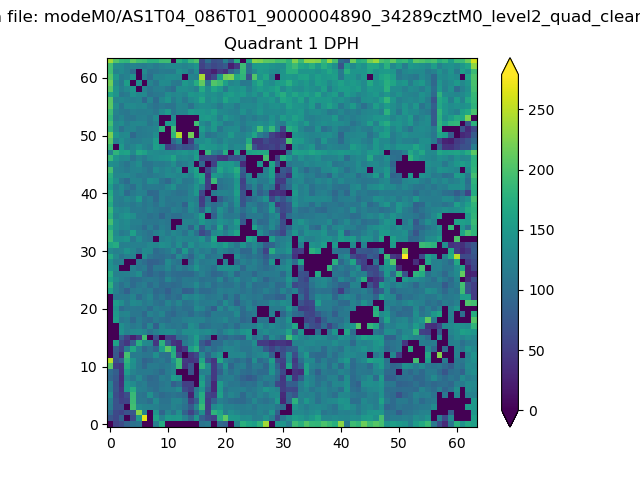
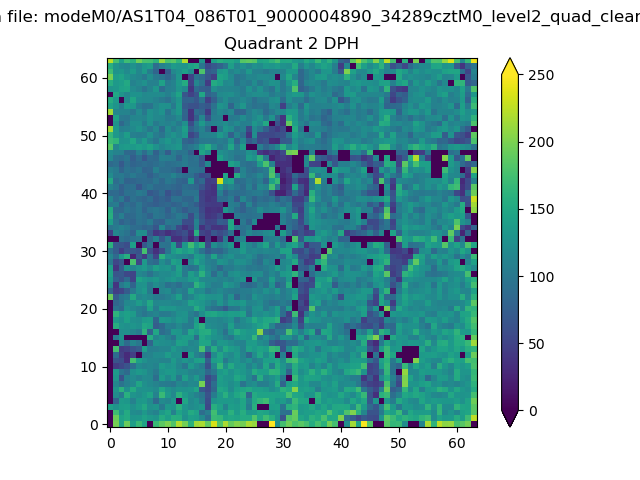
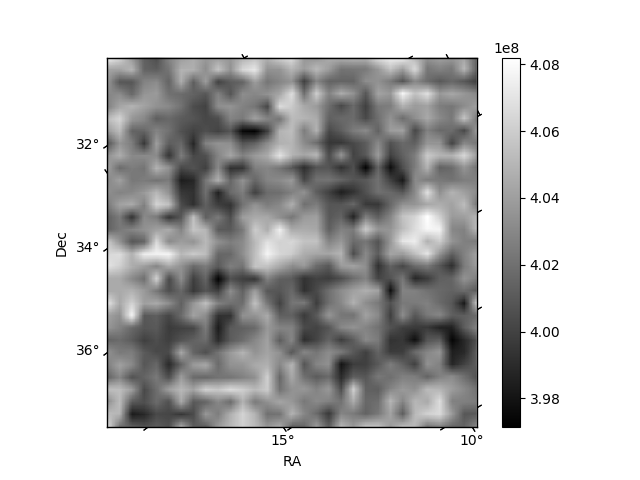
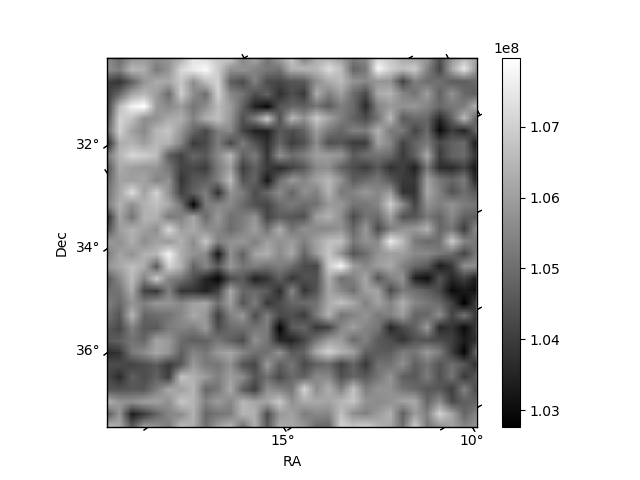
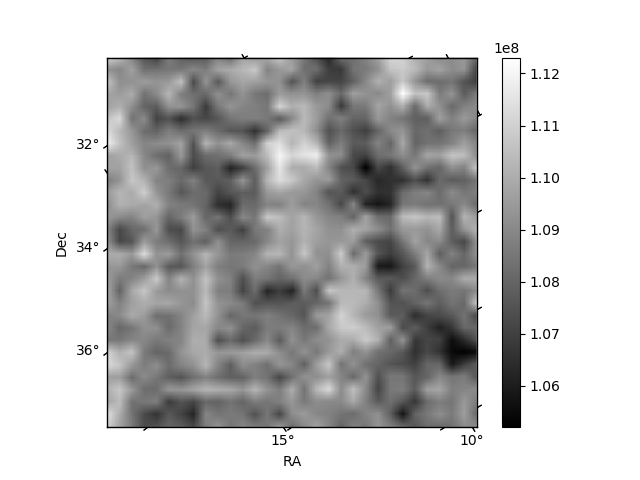
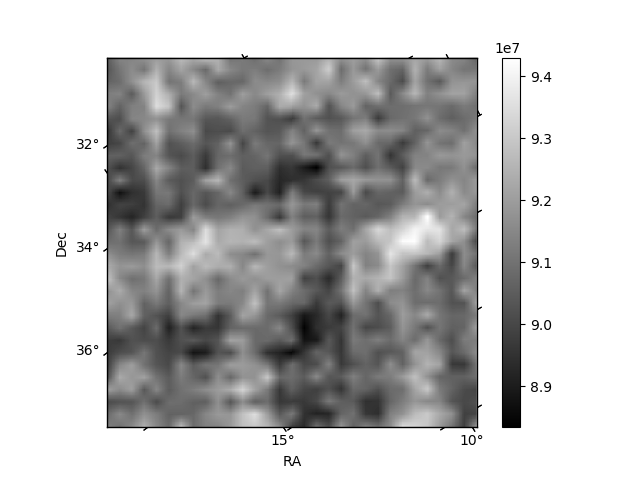
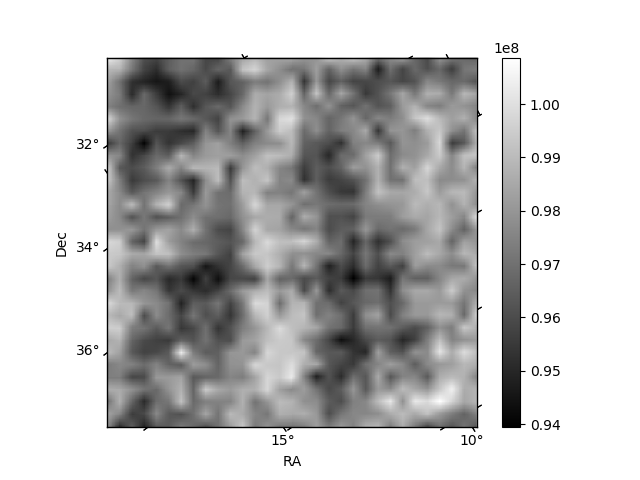
Histogram calculated using DETX and DETY for each event in the final _common_clean file
| Quadrant A | 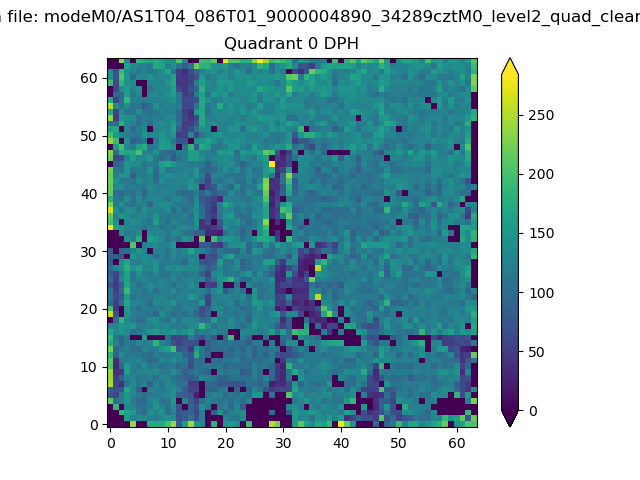 |
 |
Quadrant B |
|---|---|---|---|
| Quadrant D | 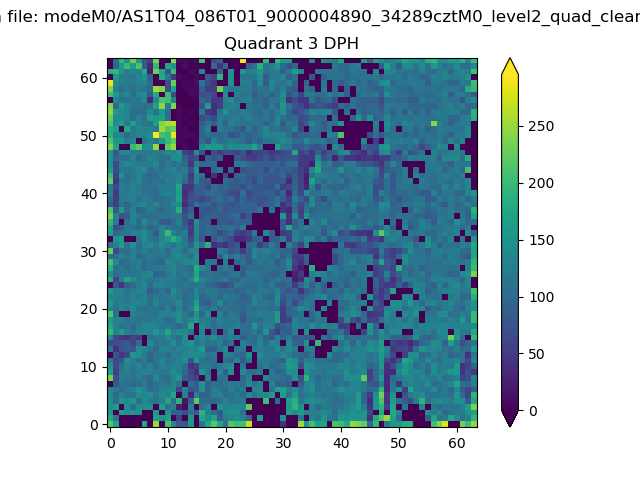 |
 |
Quadrant C |
| Plot type | Count rate plots | Images |
|---|---|---|
| Comparison with Poisson distribution Blue bars denote a histogram of data divided into 1 sec bins. Red curve is a Poisson curve with rate = median count rate of data. |
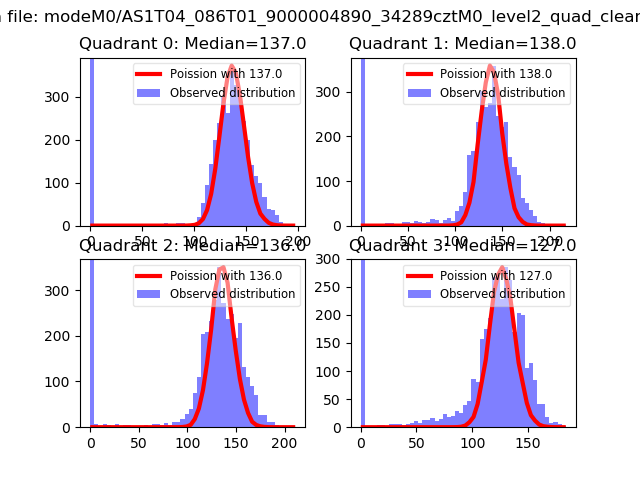 |
 |
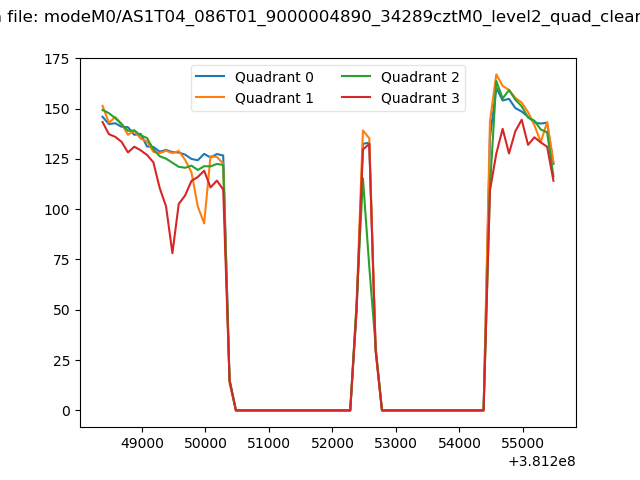
| Quadrant-wise count rates Data is divided into 100 sec bins |
 |
|
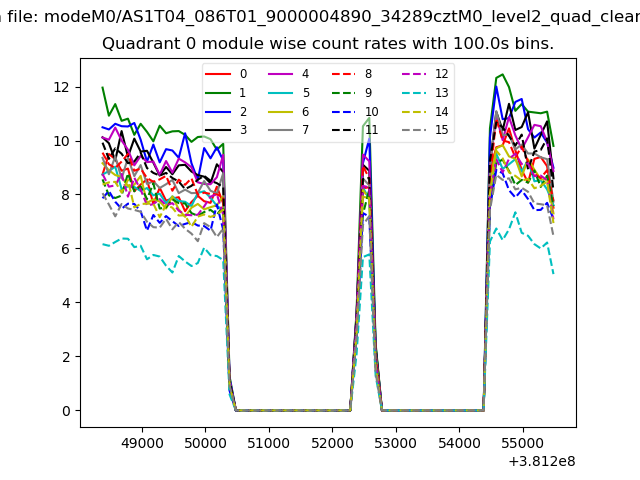
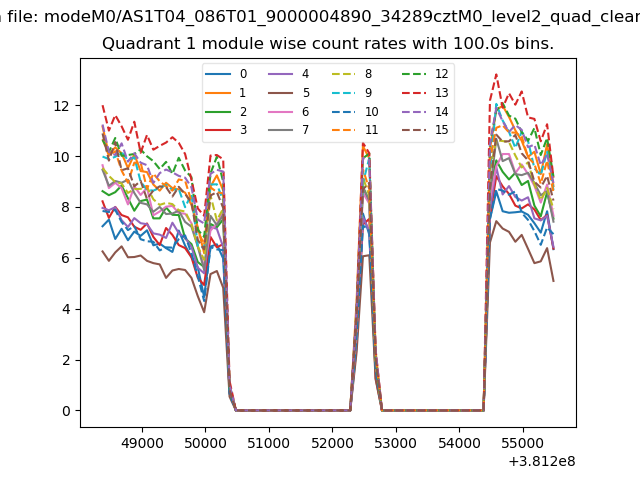
| Module-wise count rates for Quadrant A Data is divided into 100 sec bins |
 |
 |
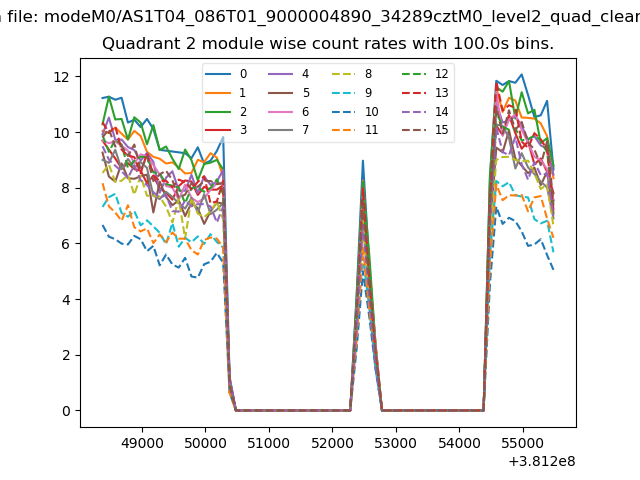
| Module-wise count rates for Quadrant B Data is divided into 100 sec bins |
 |
 |
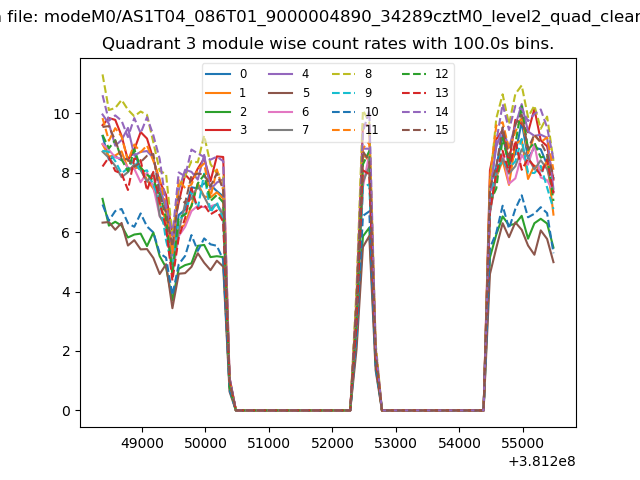
| Module-wise count rates for Quadrant C Data is divided into 100 sec bins |
 |
 |
| Module-wise count rates for Quadrant D Data is divided into 100 sec bins |
 |
 |
| Parameter | Plot |
|---|---|
| CZT HV Monitor | 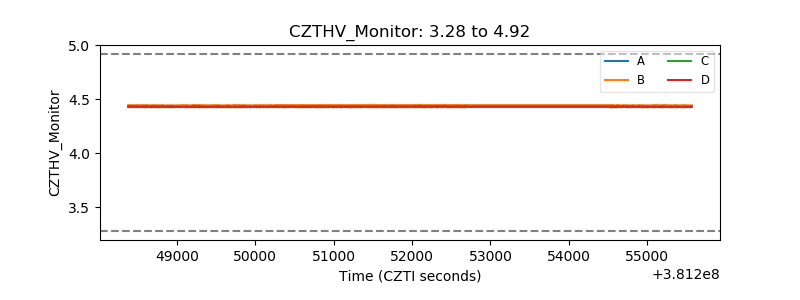 |
| D_VDD | 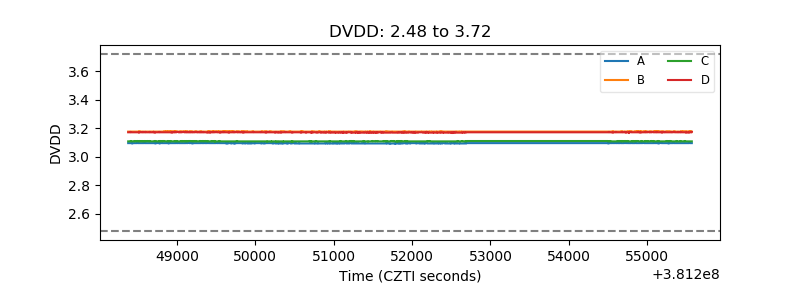 |
| Temperature 1 | 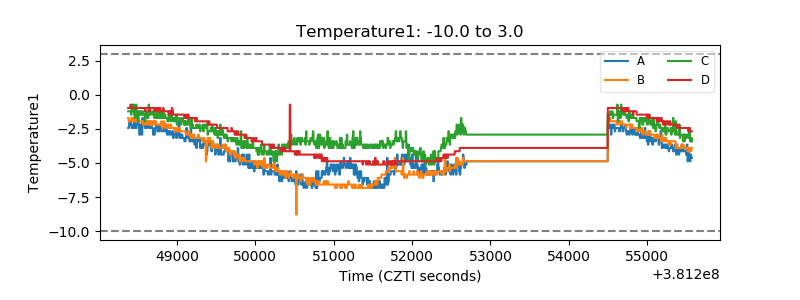 |
| Veto HV Monitor | 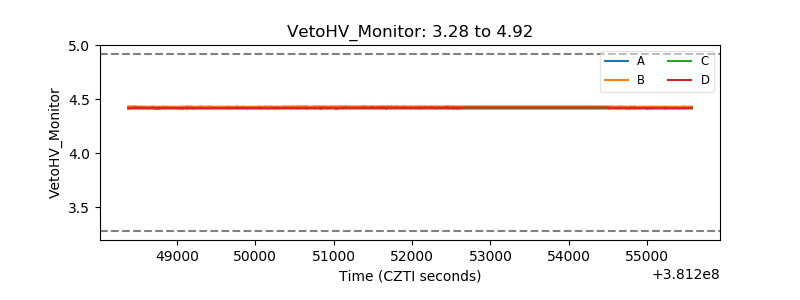 |
| Veto LLD | 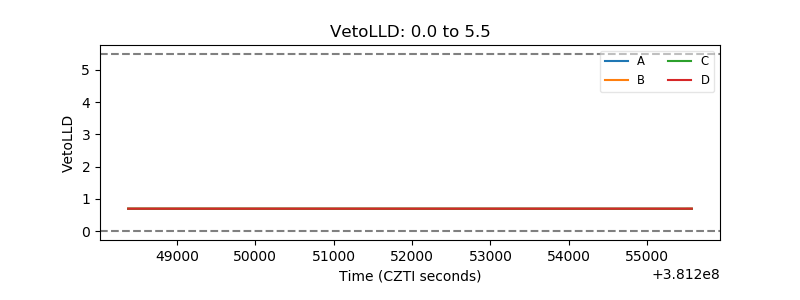 |
| Alpha Counter | 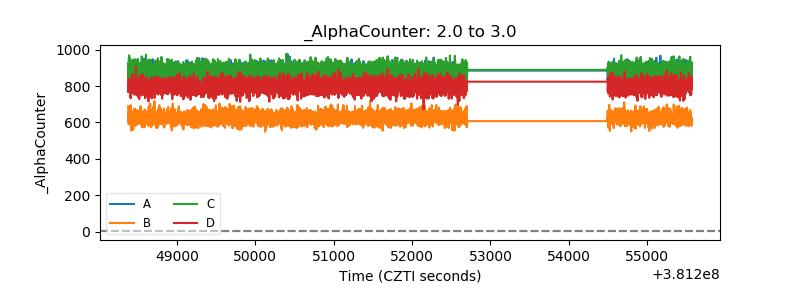 |
| _CPM_Rate | 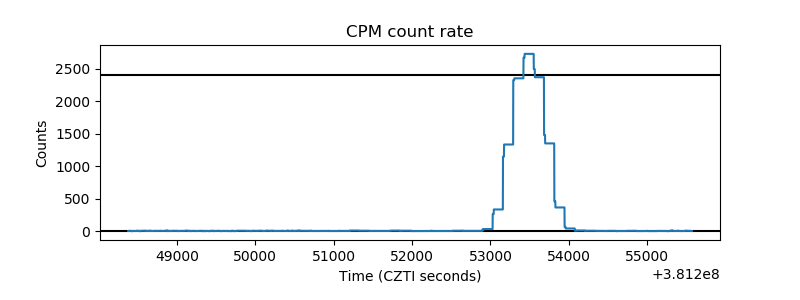 |
| CZT Counter | 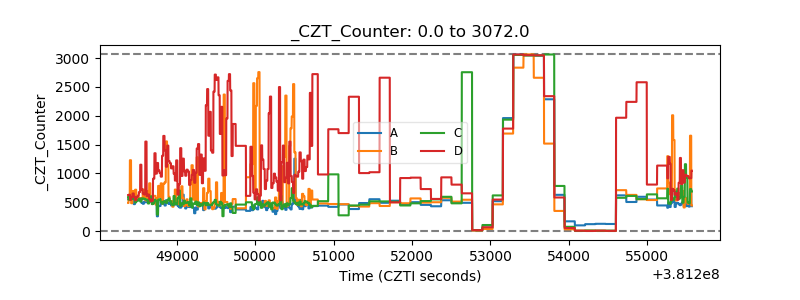 |
| +2.5 Volts monitor | 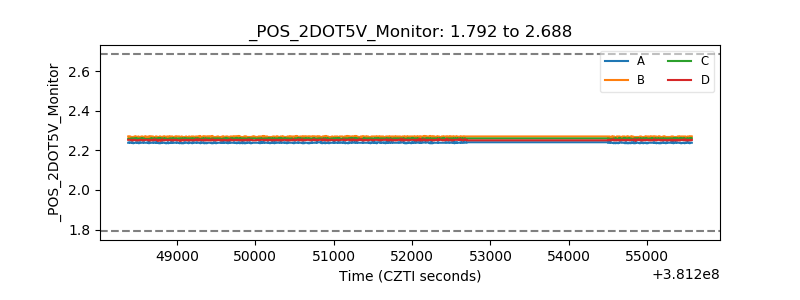 |
| +5 Volts monitor | 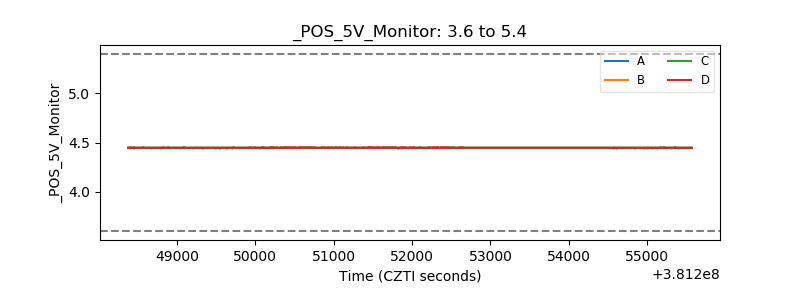 |
| _ROLL_ROT | 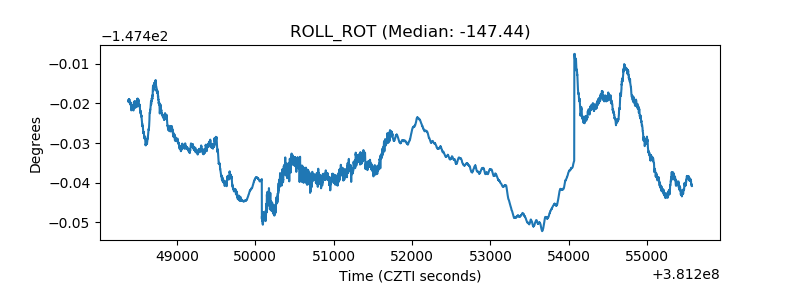 |
| _Roll_DEC | 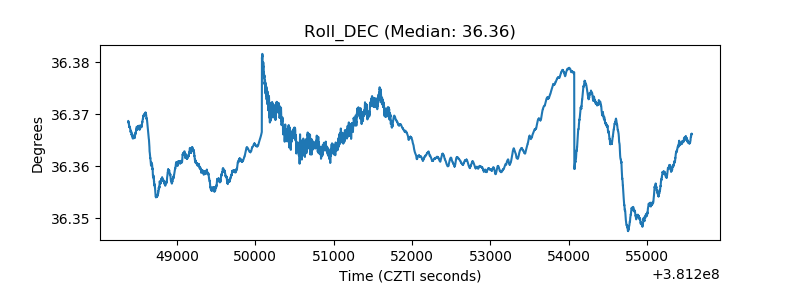 |
| _Roll_RA | 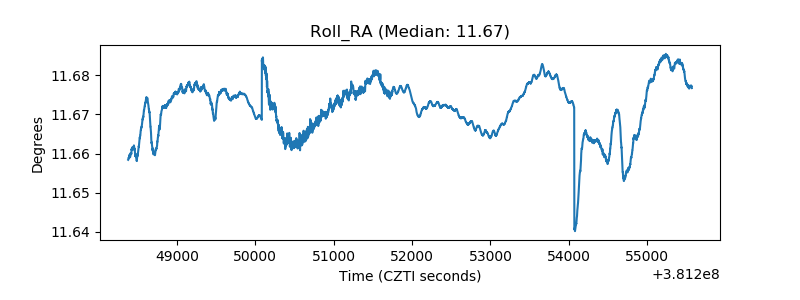 |
| Veto Counter | 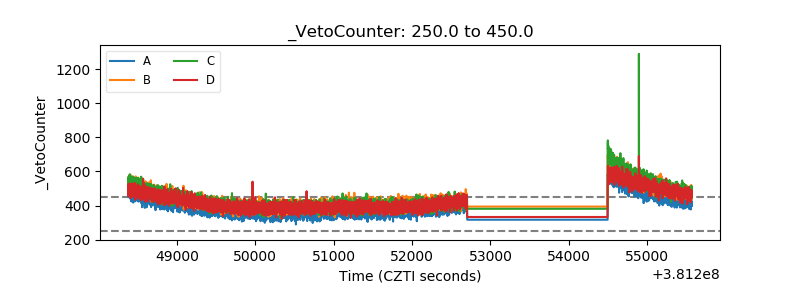 |