| Param | Original file | Final file |
|---|---|---|
| Filename | modeM0/AS1T04_086T01_9000004890_34287cztM0_level2.evt | modeM0/AS1T04_086T01_9000004890_34287cztM0_level2_quad_clean.evt |
| Size (bytes) | 446,794,560 | 66,962,880 |
| Size | 426.1 MB | 63.9 MB |
| Events in quadrant A | 2,442,826 | 421,348 |
| Events in quadrant B | 3,479,759 | 416,836 |
| Events in quadrant C | 2,874,937 | 420,049 |
| Events in quadrant D | 4,375,315 | 399,246 |
| Mode M0 | |||
|---|---|---|---|
| Quadrant | BADHDUFLAG | Total packets | Discarded packets |
| A | 0 | 10858 | 1 |
| B | 0 | 13747 | 0 |
| C | 0 | 11704 | 0 |
| D | 0 | 16653 | 0 |
| Mode SS | |||
|---|---|---|---|
| Quadrant | BADHDUFLAG | Total packets | Discarded packets |
| A | 0 | 106 | 0 |
| B | 0 | 106 | 0 |
| C | 0 | 106 | 0 |
| D | 0 | 106 | 0 |
| Mode M9 | |||
|---|---|---|---|
| Quadrant | BADHDUFLAG | Total packets | Discarded packets |
| A | 0 | 17 | 0 |
| B | 0 | 17 | 0 |
| C | 0 | 17 | 0 |
| D | 0 | 17 | 0 |
| Quadrant | Total seconds | Saturated seconds | Saturation percentage |
|---|---|---|---|
| A | 5290 | 3 | 0.056711% |
| B | 5290 | 153 | 2.892250% |
| C | 5290 | 61 | 1.153119% |
| D | 5290 | 65 | 1.228733% |
Noise dominated data is calculated using 1-second bins in cleaned event files. If a bin has >2000 counts, and if more than 50% of those come from <1% of pixels, then it is considered to be noise-dominated and hence unusable.
| Quadrant | # 1 sec bins | Bins with >0 counts | Bins with >2000 counts | High rate bins dominated by noise | Noise dominated (total time) | Noise dominated (detector-on time) | Marked lightcurve |
|---|---|---|---|---|---|---|---|
| A | 6932 | 5291 | 3 | 3 | 0.04% | 0.06% | 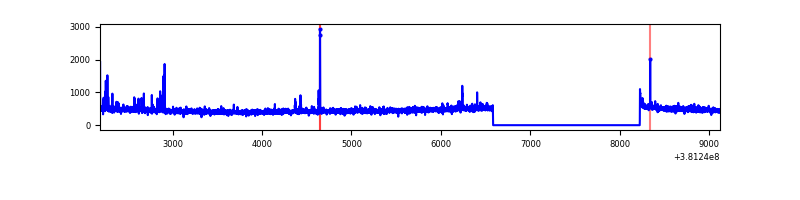 |
| B | 6932 | 5291 | 107 | 107 | 1.54% | 2.02% | 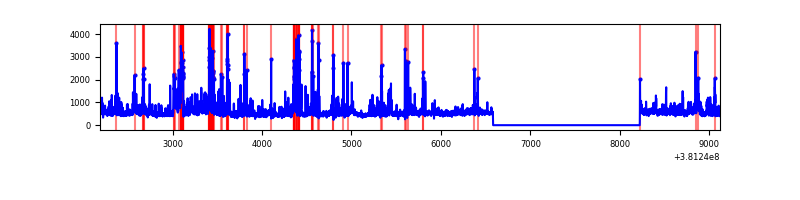 |
| C | 6932 | 5291 | 47 | 47 | 0.68% | 0.89% | 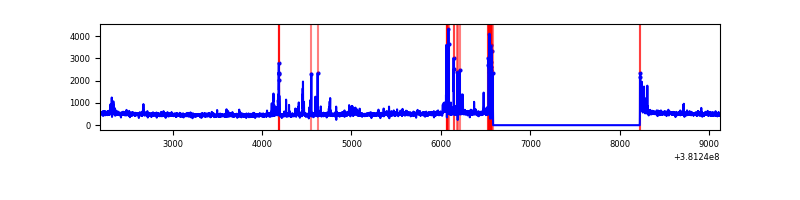 |
| D | 6932 | 5291 | 40 | 40 | 0.58% | 0.76% | 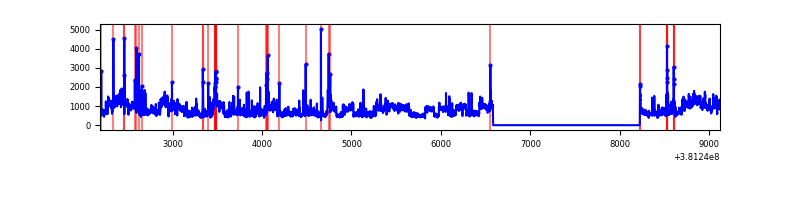 |
Top three noisy pixels from each quadrant. If the there are fewer than three noisy pixels in the level2.evt file, extra rows are filled as -1
| Pixel properties | Quadrant properties | ||||||
|---|---|---|---|---|---|---|---|
| Quadrant | DetID | PixID | Counts | Sigma | Mean | Median | Sigma |
| A | 9 | 143 | 50211 | 406.16 | 608 | 595 | 122.2 |
| A | 10 | 83 | 17660 | 139.69 | 608 | 595 | 122.2 |
| A | 7 | 16 | 14993 | 117.86 | 608 | 595 | 122.2 |
| B | 5 | 172 | 590424 | 5162.07 | 602 | 584 | 114.3 |
| B | 4 | 251 | 255661 | 2232.34 | 602 | 584 | 114.3 |
| B | 0 | 229 | 100546 | 874.83 | 602 | 584 | 114.3 |
| C | 14 | 254 | 257693 | 1868.34 | 597 | 602 | 137.6 |
| C | 15 | 214 | 225425 | 1633.84 | 597 | 602 | 137.6 |
| C | 0 | 10 | 36972 | 264.31 | 597 | 602 | 137.6 |
| D | 8 | 195 | 1295926 | 8877.53 | 600 | 585 | 145.9 |
| D | 12 | 235 | 413122 | 2827.29 | 600 | 585 | 145.9 |
| D | 7 | 223 | 115808 | 789.67 | 600 | 585 | 145.9 |
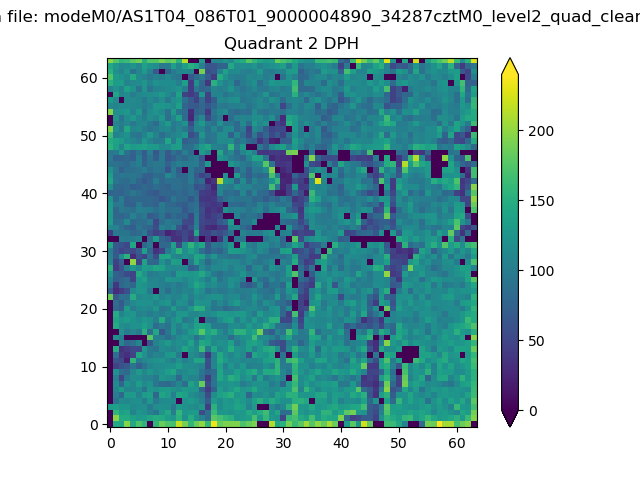
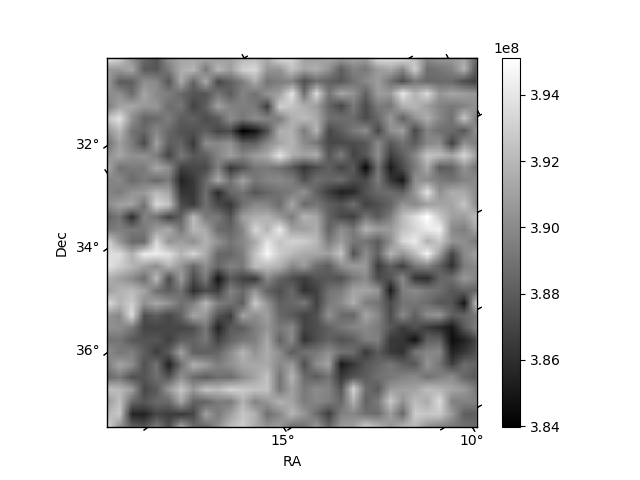
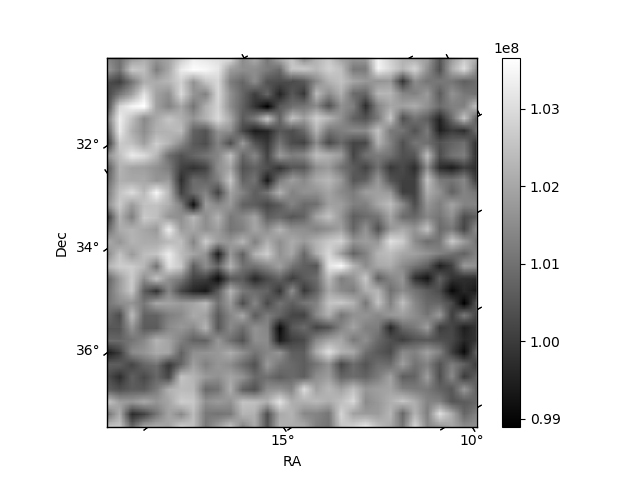
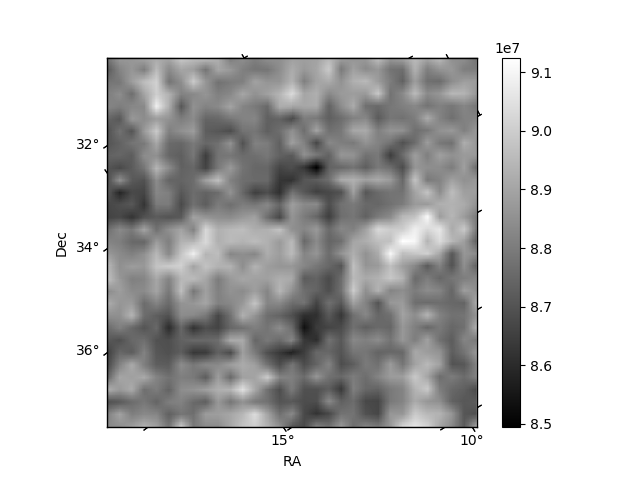
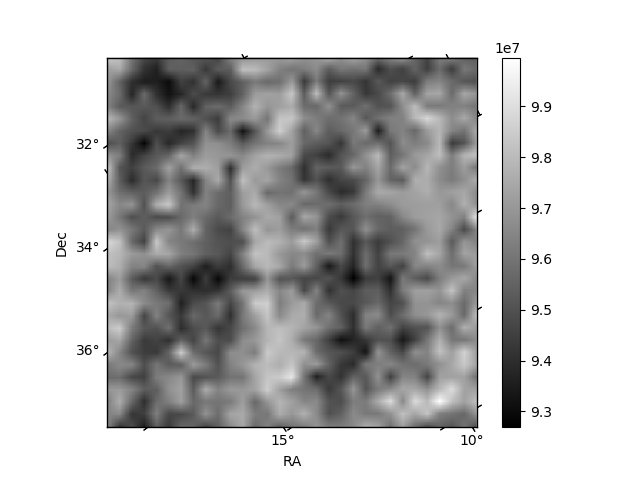
Histogram calculated using DETX and DETY for each event in the final _common_clean file
| Quadrant A | 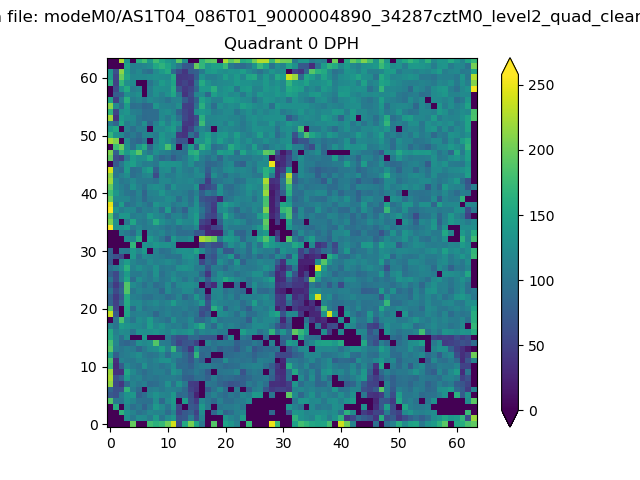 |
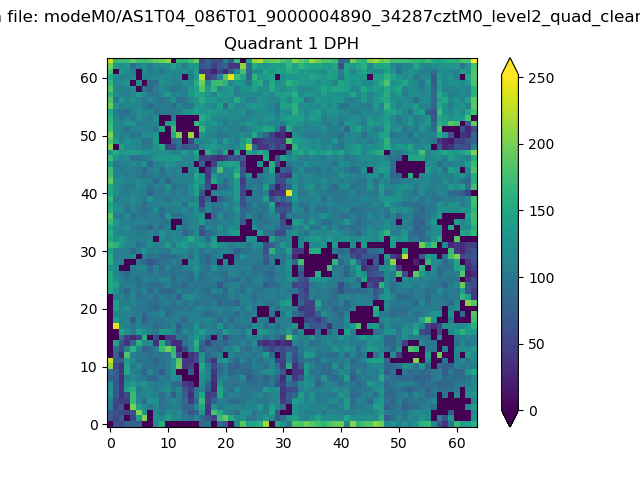 |
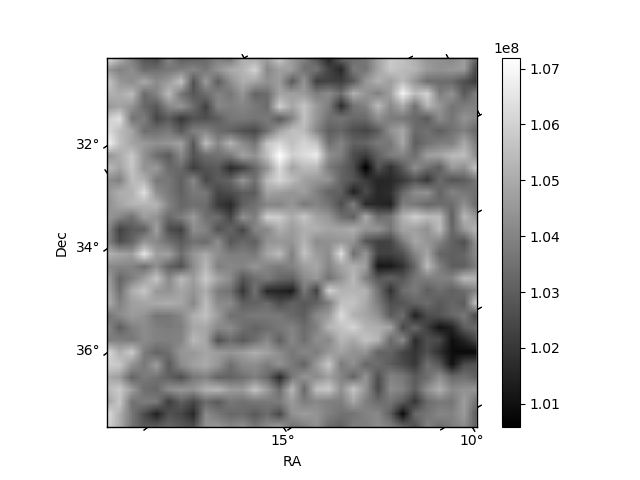
Quadrant B |
|---|---|---|---|
| Quadrant D | 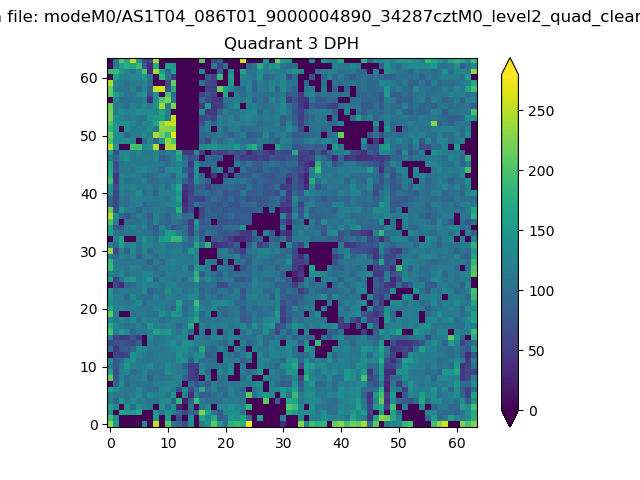 |
 |
Quadrant C |
| Plot type | Count rate plots | Images |
|---|---|---|
| Comparison with Poisson distribution Blue bars denote a histogram of data divided into 1 sec bins. Red curve is a Poisson curve with rate = median count rate of data. |
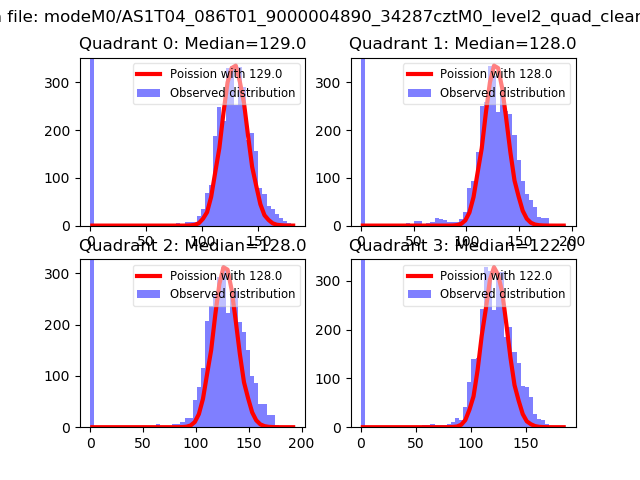 |
 |
| Quadrant-wise count rates Data is divided into 100 sec bins |
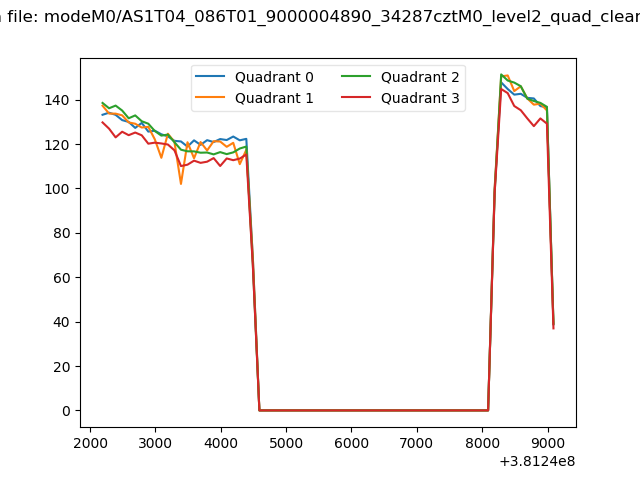 |
|
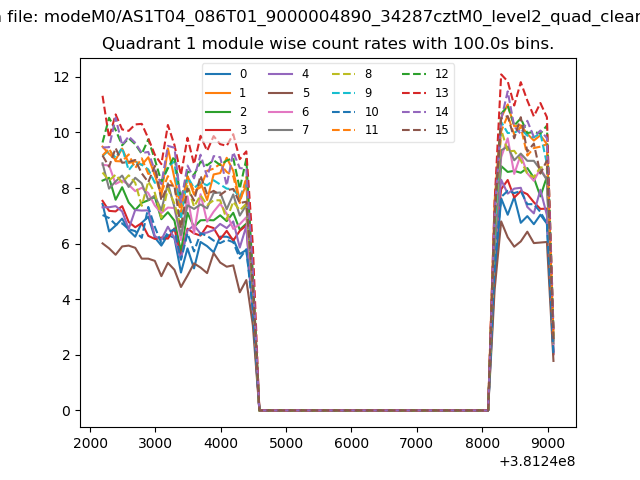
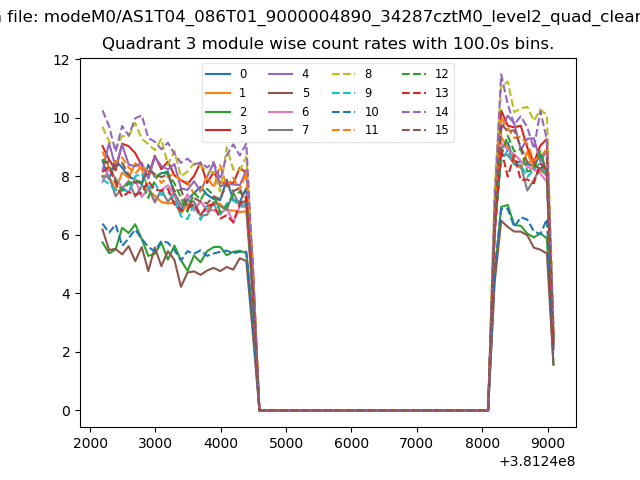
| Module-wise count rates for Quadrant A Data is divided into 100 sec bins |
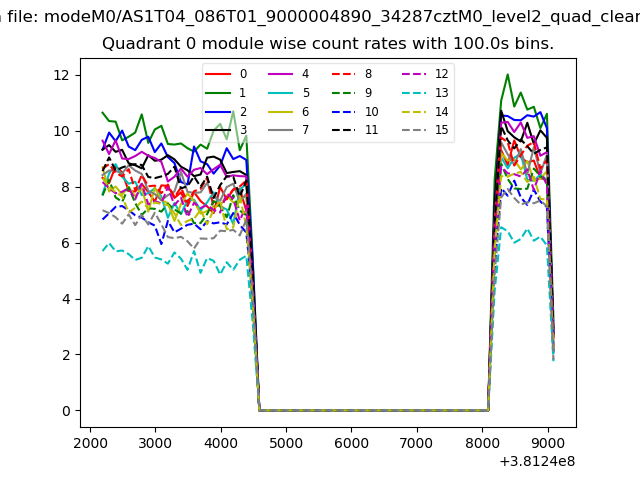 |
 |
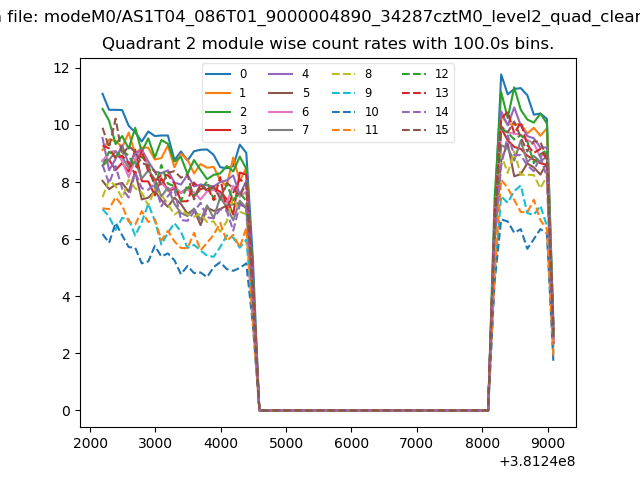
| Module-wise count rates for Quadrant B Data is divided into 100 sec bins |
 |
 |
| Module-wise count rates for Quadrant C Data is divided into 100 sec bins |
 |
 |
| Module-wise count rates for Quadrant D Data is divided into 100 sec bins |
 |
 |
| Parameter | Plot |
|---|---|
| CZT HV Monitor | 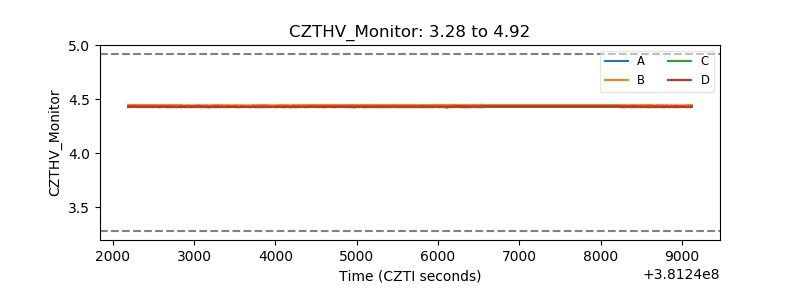 |
| D_VDD | 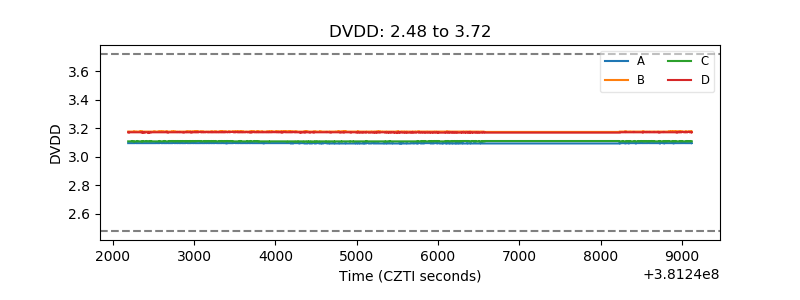 |
| Temperature 1 | 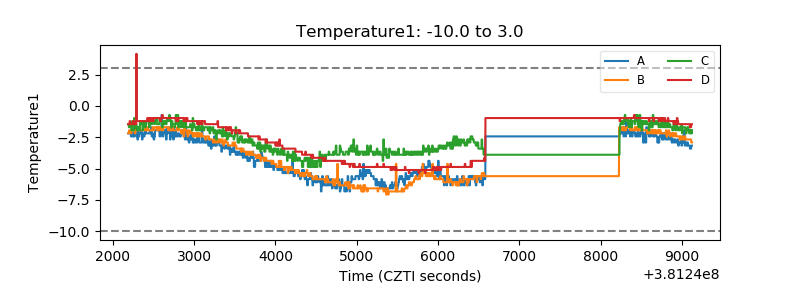 |
| Veto HV Monitor |  |
| Veto LLD | 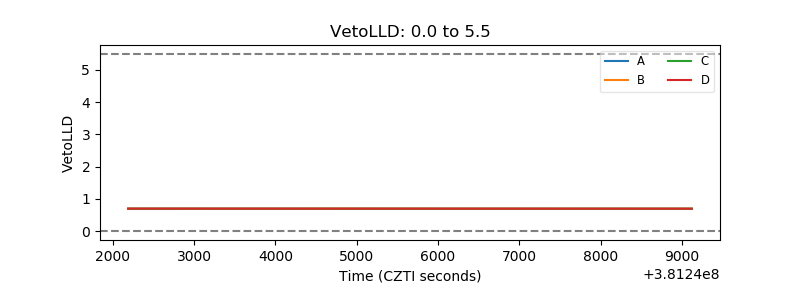 |
| Alpha Counter | 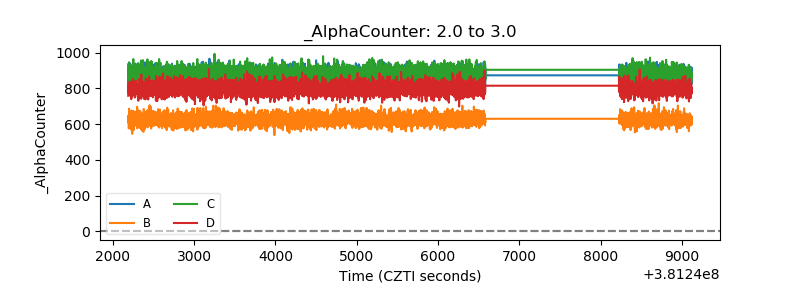 |
| _CPM_Rate |  |
| CZT Counter | 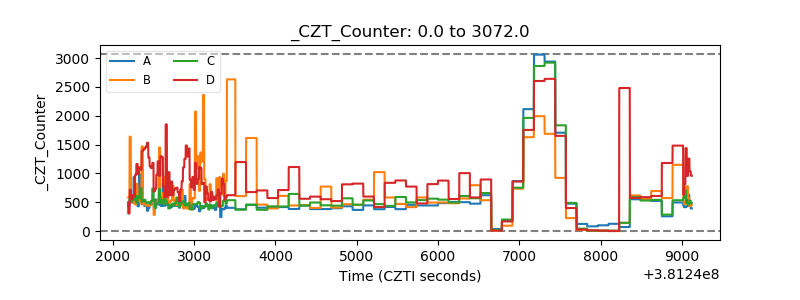 |
| +2.5 Volts monitor | 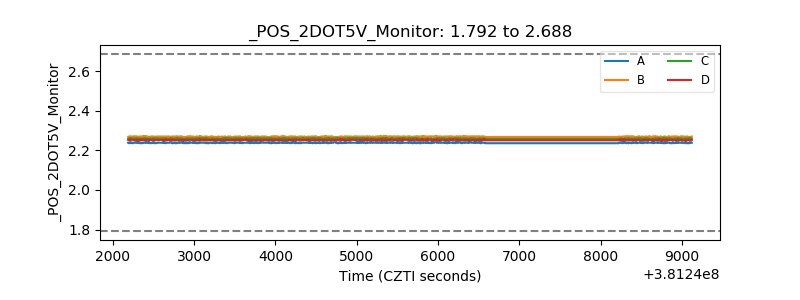 |
| +5 Volts monitor | 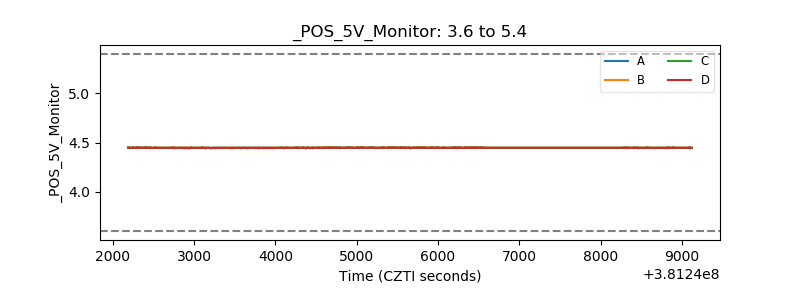 |
| _ROLL_ROT | 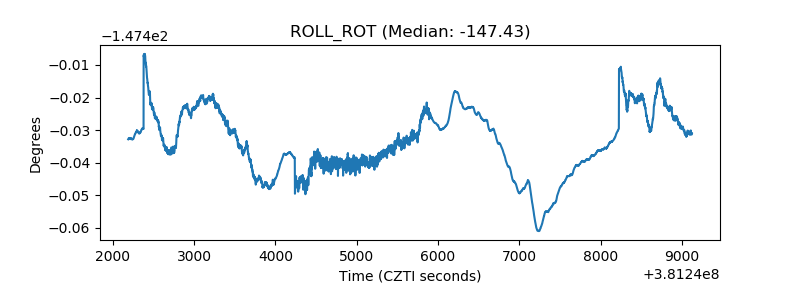 |
| _Roll_DEC | 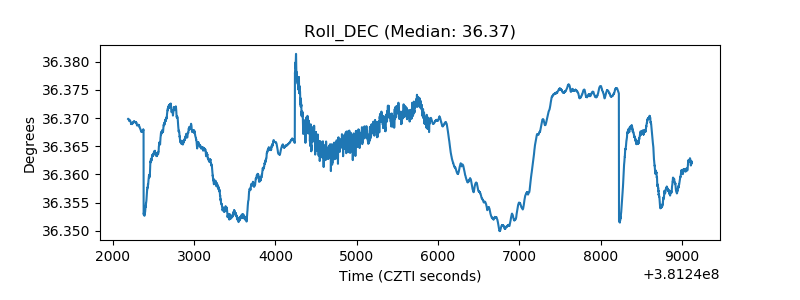 |
| _Roll_RA | 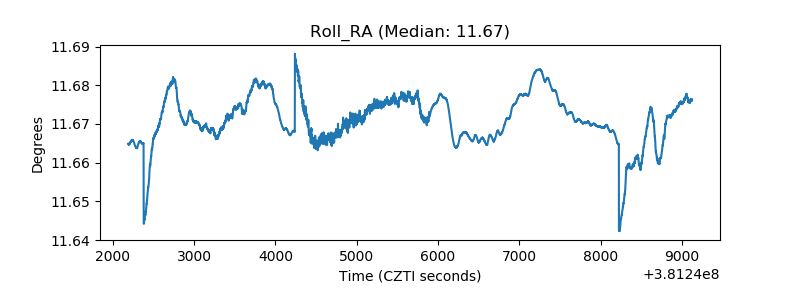 |
| Veto Counter | 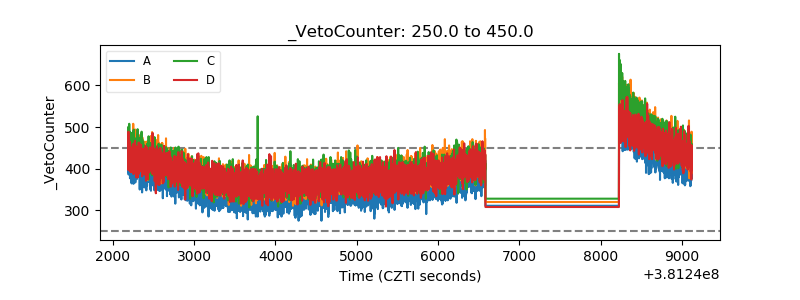 |