| Param | Original file | Final file |
|---|---|---|
| Filename | modeM0/AS1T04_086T01_9000004890_34286cztM0_level2.evt | modeM0/AS1T04_086T01_9000004890_34286cztM0_level2_quad_clean.evt |
| Size (bytes) | 971,233,920 | 144,535,680 |
| Size | 926.2 MB | 137.8 MB |
| Events in quadrant A | 5,093,825 | 917,681 |
| Events in quadrant B | 7,457,692 | 902,161 |
| Events in quadrant C | 6,520,105 | 923,593 |
| Events in quadrant D | 9,601,502 | 873,703 |
| Mode M0 | |||
|---|---|---|---|
| Quadrant | BADHDUFLAG | Total packets | Discarded packets |
| A | 0 | 22532 | 4 |
| B | 0 | 29186 | 3 |
| C | 0 | 25906 | 3 |
| D | 0 | 36055 | 3 |
| Mode SS | |||
|---|---|---|---|
| Quadrant | BADHDUFLAG | Total packets | Discarded packets |
| A | 0 | 228 | 0 |
| B | 0 | 228 | 0 |
| C | 0 | 228 | 0 |
| D | 0 | 228 | 0 |
| Mode M9 | |||
|---|---|---|---|
| Quadrant | BADHDUFLAG | Total packets | Discarded packets |
| A | 0 | 42 | 0 |
| B | 0 | 42 | 0 |
| C | 0 | 42 | 0 |
| D | 0 | 42 | 0 |
| Quadrant | Total seconds | Saturated seconds | Saturation percentage |
|---|---|---|---|
| A | 10971 | 32 | 0.291678% |
| B | 10971 | 616 | 5.614803% |
| C | 10971 | 355 | 3.235803% |
| D | 10971 | 333 | 3.035275% |
Noise dominated data is calculated using 1-second bins in cleaned event files. If a bin has >2000 counts, and if more than 50% of those come from <1% of pixels, then it is considered to be noise-dominated and hence unusable.
| Quadrant | # 1 sec bins | Bins with >0 counts | Bins with >2000 counts | High rate bins dominated by noise | Noise dominated (total time) | Noise dominated (detector-on time) | Marked lightcurve |
|---|---|---|---|---|---|---|---|
| A | 15208 | 10974 | 23 | 23 | 0.15% | 0.21% | 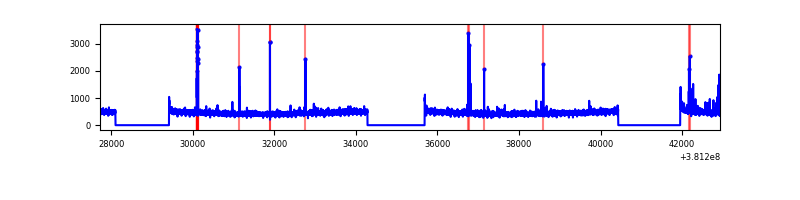 |
| B | 15208 | 10974 | 457 | 457 | 3.00% | 4.16% | 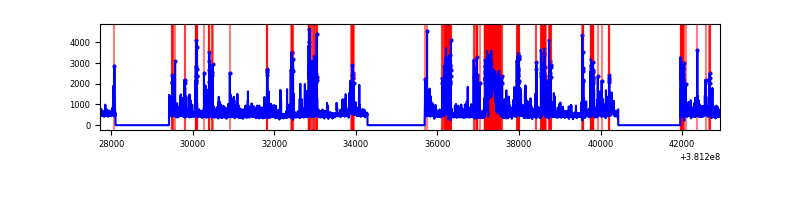 |
| C | 15208 | 10974 | 286 | 286 | 1.88% | 2.61% | 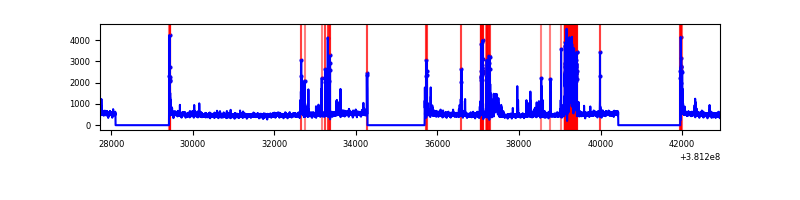 |
| D | 15208 | 10974 | 282 | 282 | 1.85% | 2.57% | 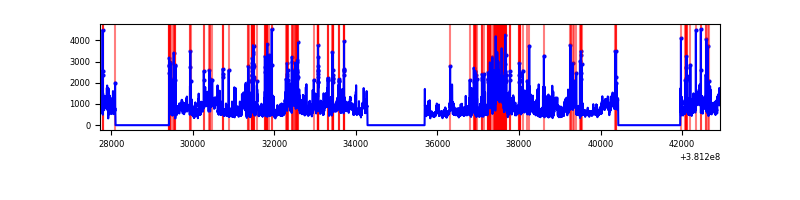 |
Top three noisy pixels from each quadrant. If the there are fewer than three noisy pixels in the level2.evt file, extra rows are filled as -1
| Pixel properties | Quadrant properties | ||||||
|---|---|---|---|---|---|---|---|
| Quadrant | DetID | PixID | Counts | Sigma | Mean | Median | Sigma |
| A | 9 | 143 | 128363 | 502.39 | 1261 | 1235 | 253.0 |
| A | 10 | 83 | 43669 | 167.69 | 1261 | 1235 | 253.0 |
| A | 13 | 6 | 20709 | 76.96 | 1261 | 1235 | 253.0 |
| B | 5 | 172 | 1903356 | 8089.81 | 1236 | 1203 | 235.1 |
| B | 4 | 251 | 413051 | 1751.58 | 1236 | 1203 | 235.1 |
| B | 0 | 229 | 88529 | 371.4 | 1236 | 1203 | 235.1 |
| C | 14 | 254 | 1069802 | 3805.45 | 1221 | 1229 | 280.8 |
| C | 15 | 214 | 467680 | 1661.15 | 1221 | 1229 | 280.8 |
| C | 0 | 10 | 118280 | 416.85 | 1221 | 1229 | 280.8 |
| D | 8 | 195 | 2564273 | 8461.84 | 1231 | 1198 | 302.9 |
| D | 12 | 235 | 1037476 | 3421.21 | 1231 | 1198 | 302.9 |
| D | 7 | 223 | 259996 | 854.41 | 1231 | 1198 | 302.9 |
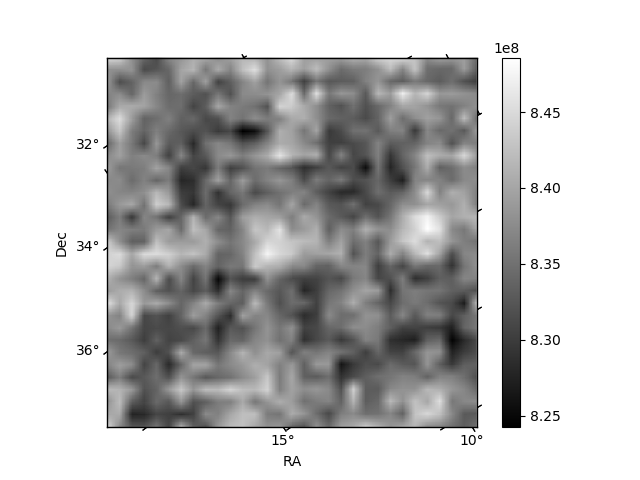
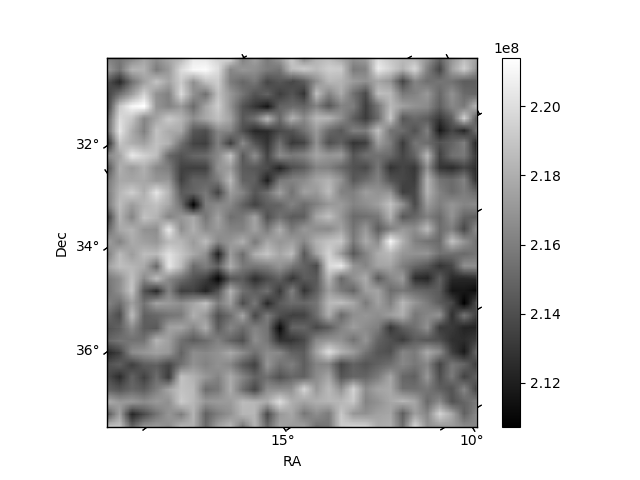
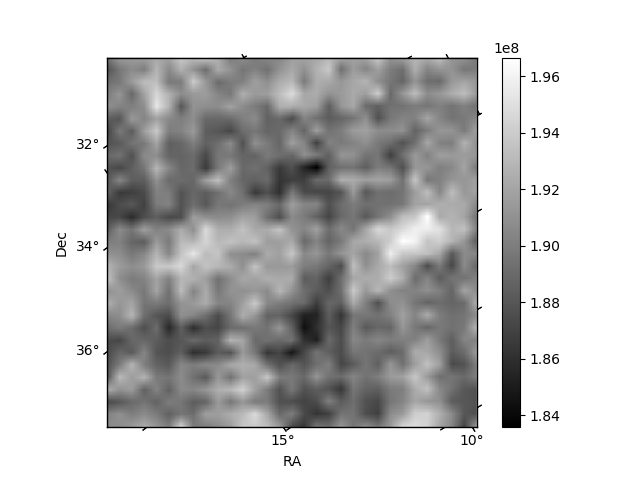
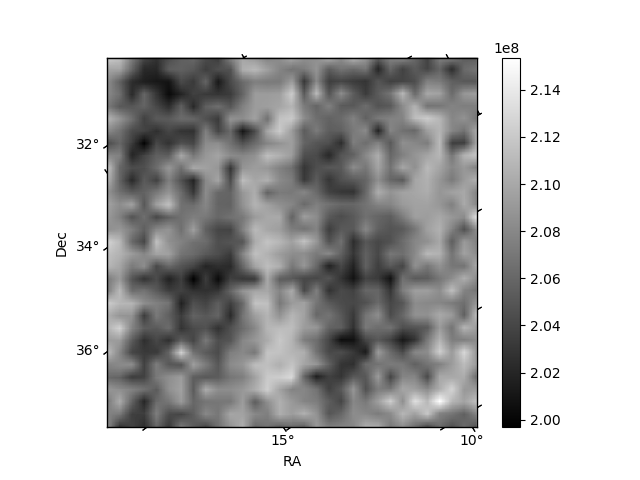
Histogram calculated using DETX and DETY for each event in the final _common_clean file
| Quadrant A | 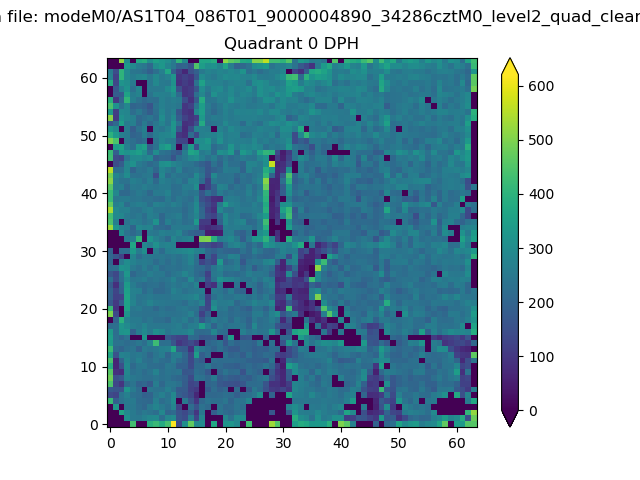 |
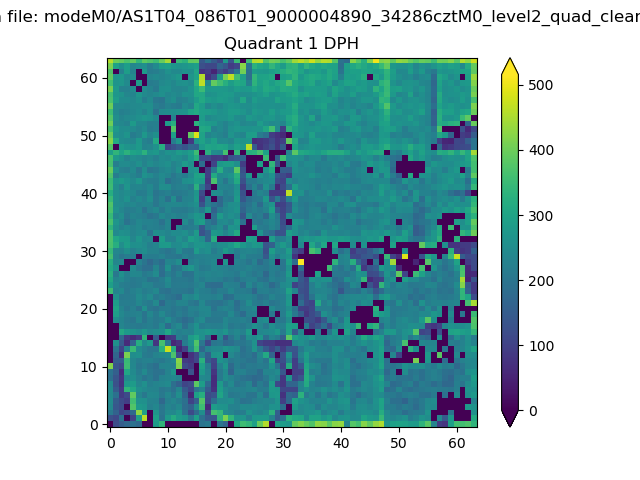 |
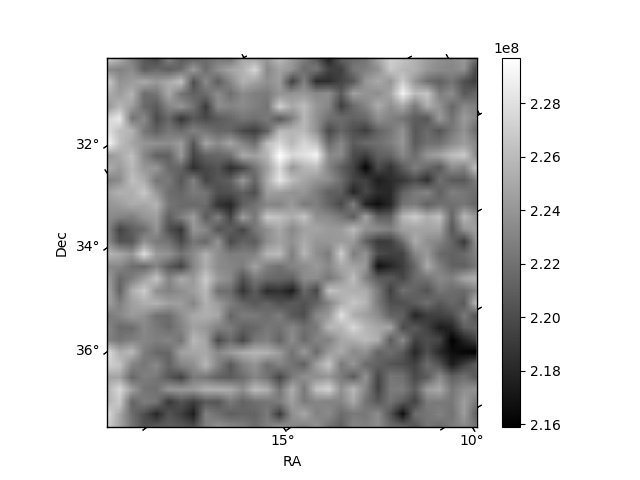
Quadrant B |
|---|---|---|---|
| Quadrant D | 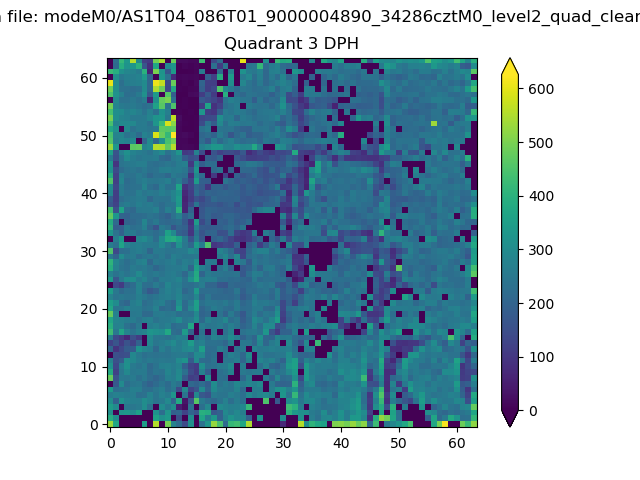 |
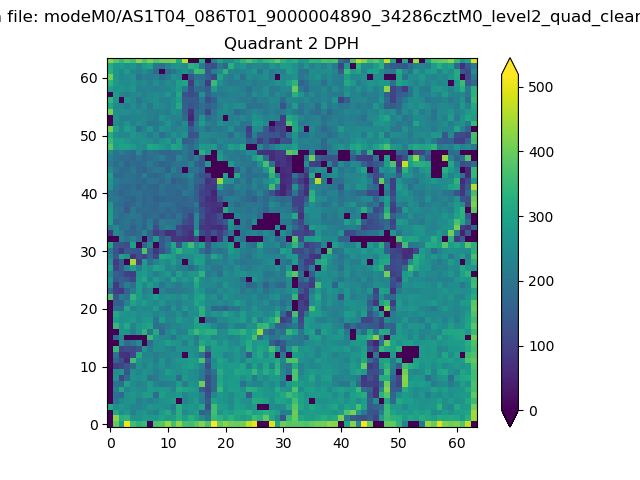 |
Quadrant C |
| Plot type | Count rate plots | Images |
|---|---|---|
| Comparison with Poisson distribution Blue bars denote a histogram of data divided into 1 sec bins. Red curve is a Poisson curve with rate = median count rate of data. |
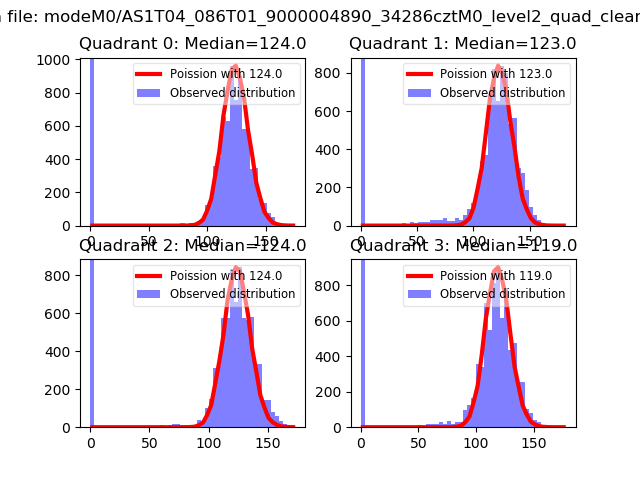 |
 |
| Quadrant-wise count rates Data is divided into 100 sec bins |
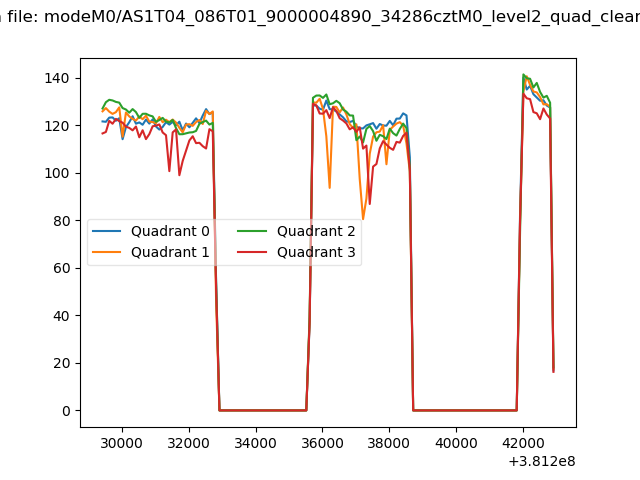 |
|
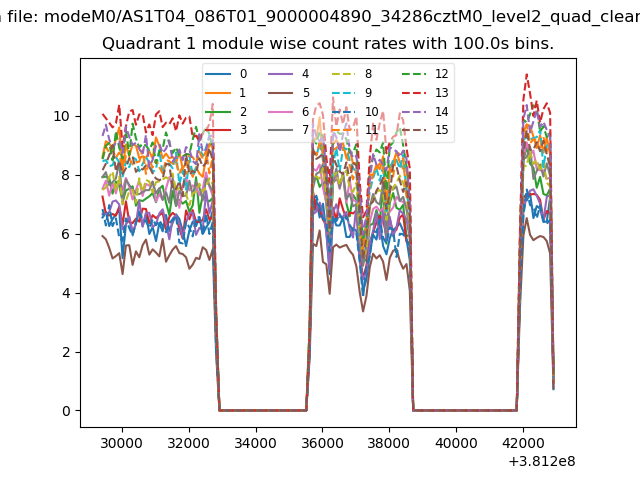
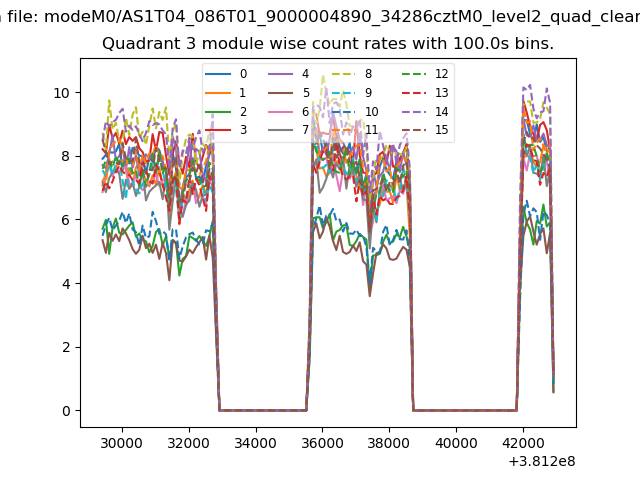
| Module-wise count rates for Quadrant A Data is divided into 100 sec bins |
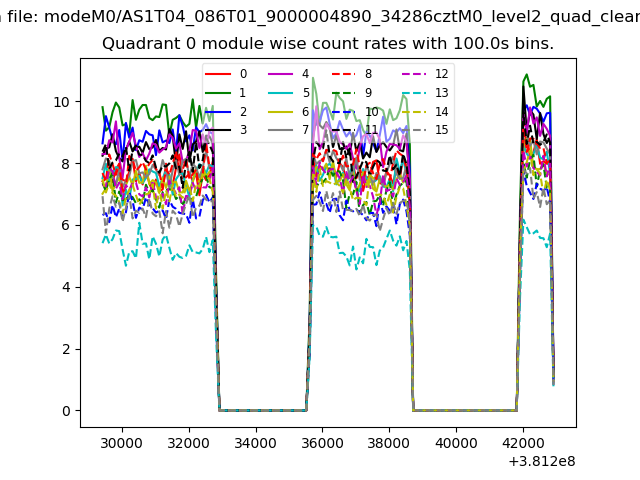 |
 |
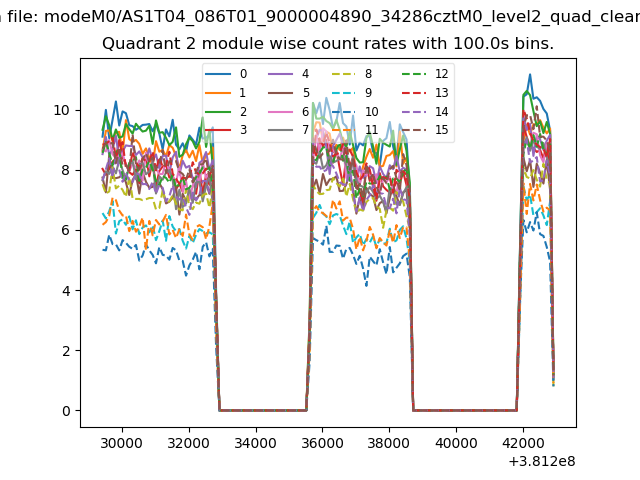
| Module-wise count rates for Quadrant B Data is divided into 100 sec bins |
 |
 |
| Module-wise count rates for Quadrant C Data is divided into 100 sec bins |
 |
 |
| Module-wise count rates for Quadrant D Data is divided into 100 sec bins |
 |
 |
| Parameter | Plot |
|---|---|
| CZT HV Monitor | 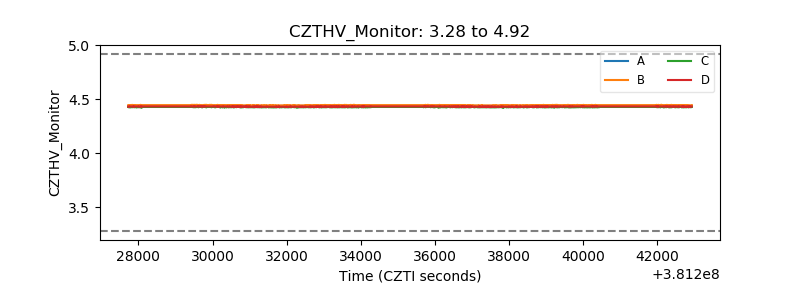 |
| D_VDD | 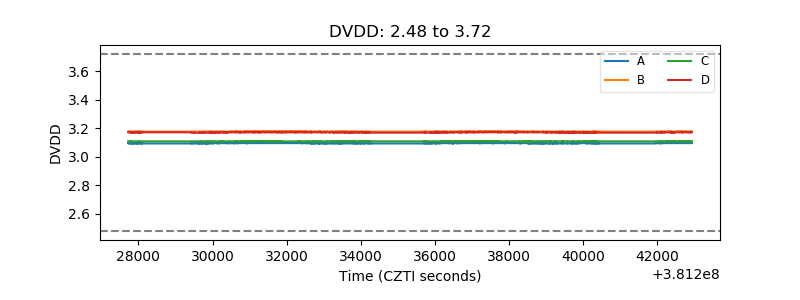 |
| Temperature 1 | 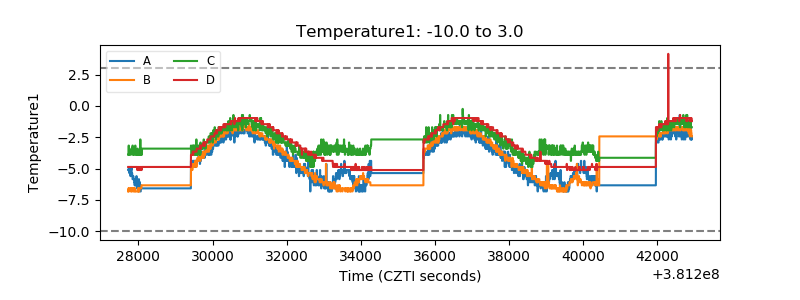 |
| Veto HV Monitor | 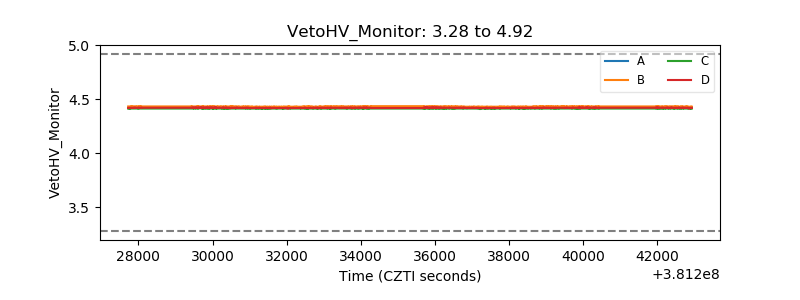 |
| Veto LLD | 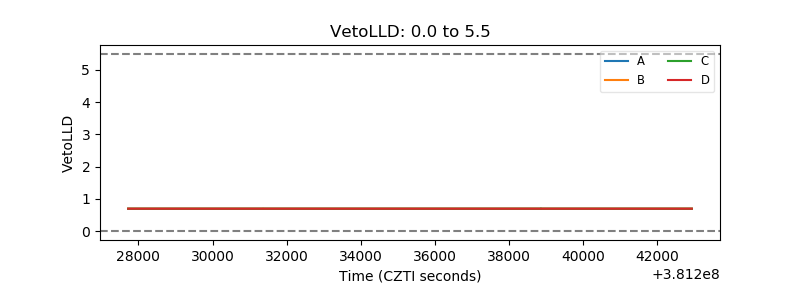 |
| Alpha Counter | 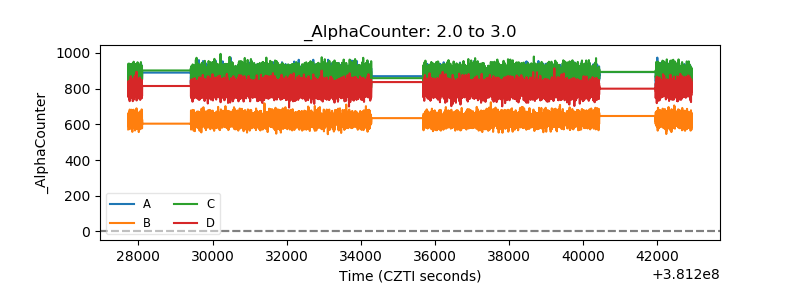 |
| _CPM_Rate | 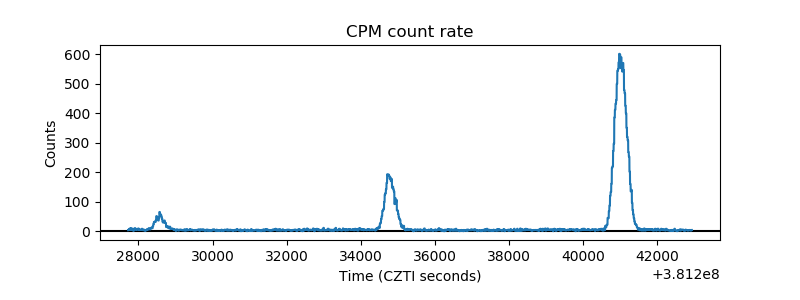 |
| CZT Counter | 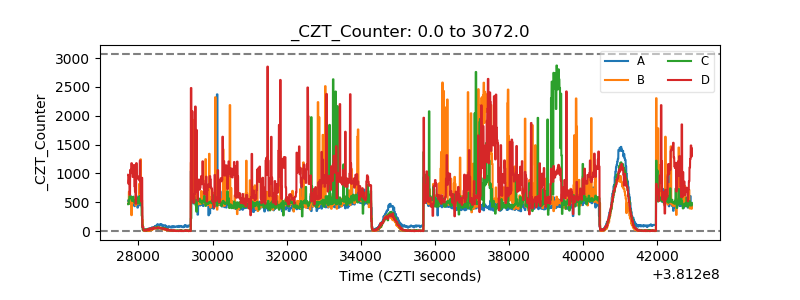 |
| +2.5 Volts monitor | 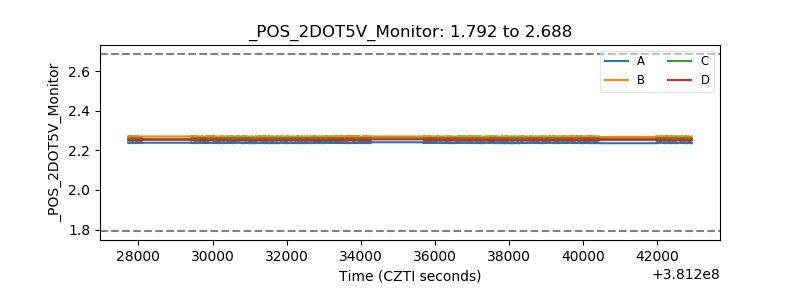 |
| +5 Volts monitor | 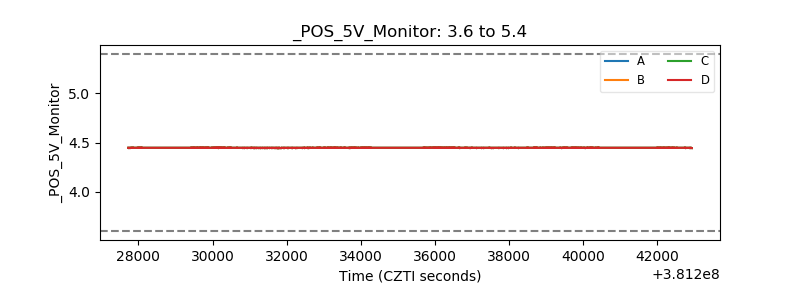 |
| _ROLL_ROT |  |
| _Roll_DEC | 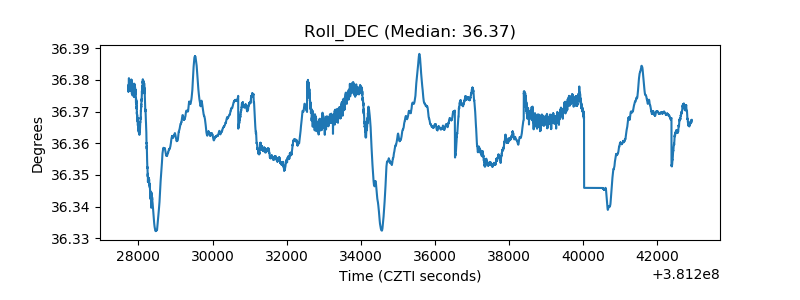 |
| _Roll_RA | 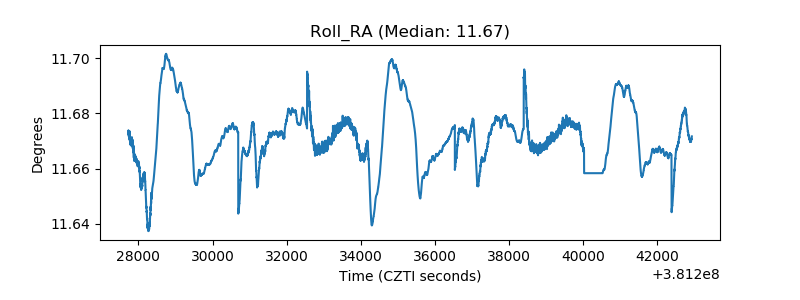 |
| Veto Counter | 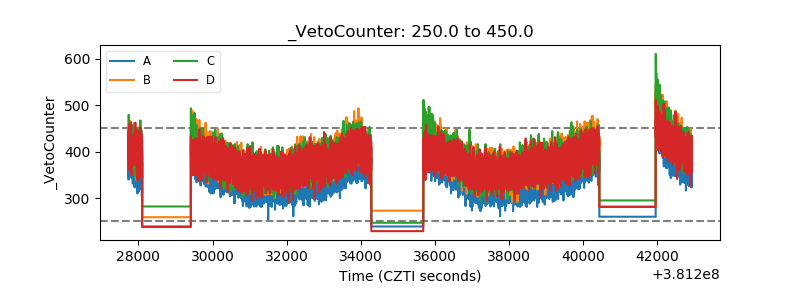 |