| Param | Original file | Final file |
|---|---|---|
| Filename | modeM0/AS1T04_086T01_9000004890_34282cztM0_level2.evt | modeM0/AS1T04_086T01_9000004890_34282cztM0_level2_quad_clean.evt |
| Size (bytes) | 568,906,560 | 80,133,120 |
| Size | 542.6 MB | 76.4 MB |
| Events in quadrant A | 2,667,184 | 525,084 |
| Events in quadrant B | 3,856,369 | 519,915 |
| Events in quadrant C | 2,990,951 | 540,328 |
| Events in quadrant D | 7,320,819 | 434,096 |
| Mode M0 | |||
|---|---|---|---|
| Quadrant | BADHDUFLAG | Total packets | Discarded packets |
| A | 0 | 11794 | 3 |
| B | 0 | 15170 | 2 |
| C | 0 | 12230 | 2 |
| D | 0 | 25654 | 2 |
| Mode SS | |||
|---|---|---|---|
| Quadrant | BADHDUFLAG | Total packets | Discarded packets |
| A | 0 | 118 | 0 |
| B | 0 | 118 | 0 |
| C | 0 | 118 | 0 |
| D | 0 | 118 | 0 |
| Mode M9 | |||
|---|---|---|---|
| Quadrant | BADHDUFLAG | Total packets | Discarded packets |
| A | 0 | 24 | 0 |
| B | 0 | 24 | 0 |
| C | 0 | 24 | 0 |
| D | 0 | 25 | 0 |
| Quadrant | Total seconds | Saturated seconds | Saturation percentage |
|---|---|---|---|
| A | 5818 | 10 | 0.171880% |
| B | 5818 | 273 | 4.692334% |
| C | 5818 | 4 | 0.068752% |
| D | 5818 | 1378 | 23.685115% |
Noise dominated data is calculated using 1-second bins in cleaned event files. If a bin has >2000 counts, and if more than 50% of those come from <1% of pixels, then it is considered to be noise-dominated and hence unusable.
| Quadrant | # 1 sec bins | Bins with >0 counts | Bins with >2000 counts | High rate bins dominated by noise | Noise dominated (total time) | Noise dominated (detector-on time) | Marked lightcurve |
|---|---|---|---|---|---|---|---|
| A | 7190 | 5819 | 4 | 4 | 0.06% | 0.07% | 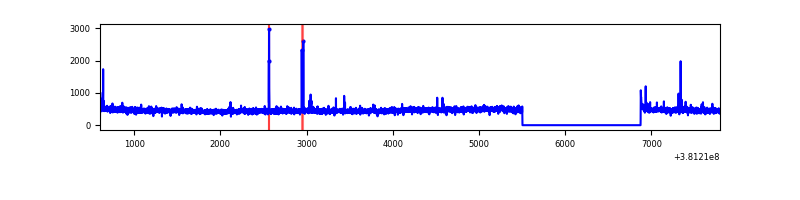 |
| B | 7190 | 5819 | 190 | 190 | 2.64% | 3.27% | 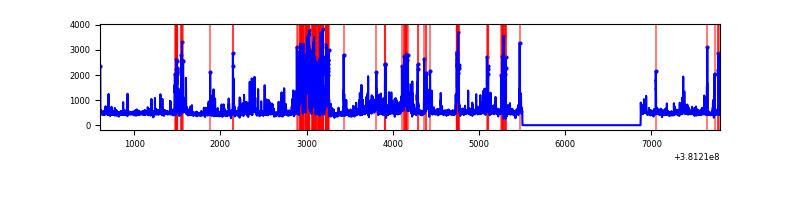 |
| C | 7190 | 5819 | 2 | 2 | 0.03% | 0.03% | 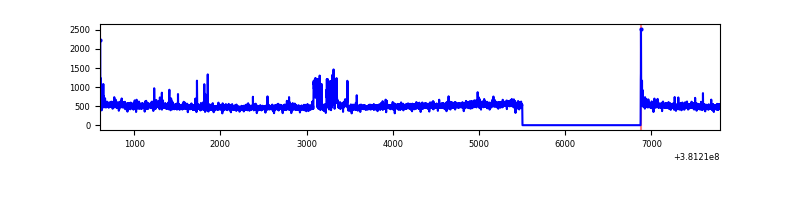 |
| D | 7190 | 5819 | 1213 | 1213 | 16.87% | 20.85% | 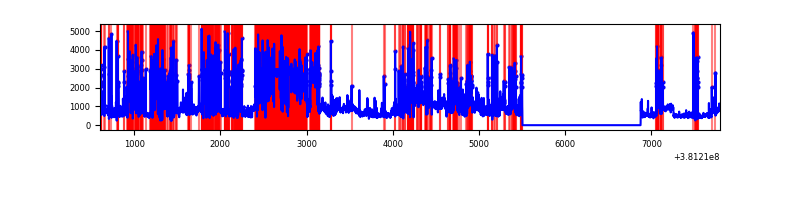 |
Top three noisy pixels from each quadrant. If the there are fewer than three noisy pixels in the level2.evt file, extra rows are filled as -1
| Pixel properties | Quadrant properties | ||||||
|---|---|---|---|---|---|---|---|
| Quadrant | DetID | PixID | Counts | Sigma | Mean | Median | Sigma |
| A | 9 | 143 | 33469 | 243.32 | 671 | 657 | 134.9 |
| A | 10 | 83 | 27021 | 195.5 | 671 | 657 | 134.9 |
| A | 13 | 6 | 10758 | 74.9 | 671 | 657 | 134.9 |
| B | 5 | 172 | 879468 | 6919.15 | 660 | 644 | 127.0 |
| B | 0 | 229 | 169455 | 1329.08 | 660 | 644 | 127.0 |
| B | 4 | 251 | 70406 | 549.25 | 660 | 644 | 127.0 |
| C | 15 | 214 | 256722 | 1673.46 | 661 | 665 | 153.0 |
| C | 1 | 128 | 96066 | 623.49 | 661 | 665 | 153.0 |
| C | 0 | 10 | 24398 | 155.1 | 661 | 665 | 153.0 |
| D | 7 | 223 | 2563465 | 18169.14 | 580 | 564 | 141.1 |
| D | 8 | 195 | 898072 | 6362.69 | 580 | 564 | 141.1 |
| D | 13 | 249 | 625551 | 4430.71 | 580 | 564 | 141.1 |
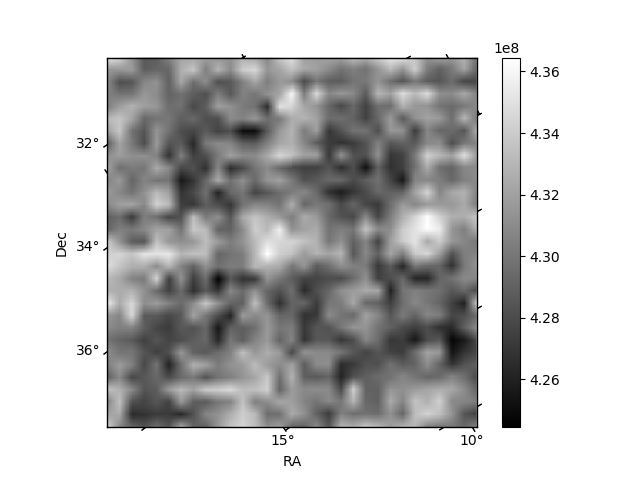
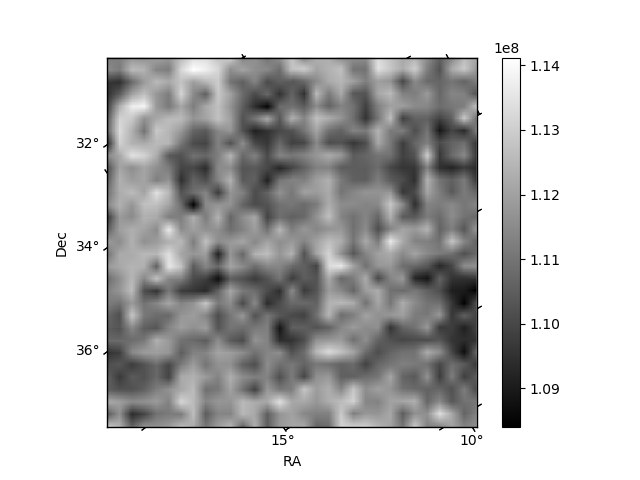
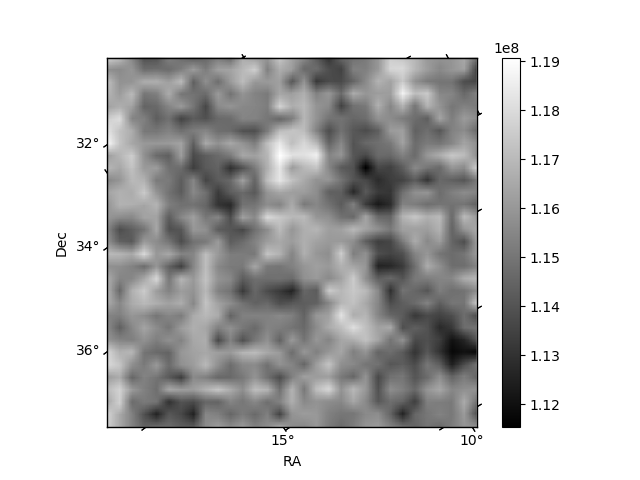
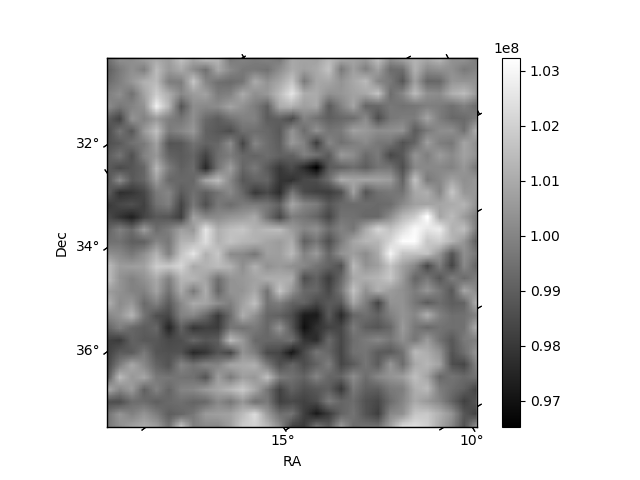
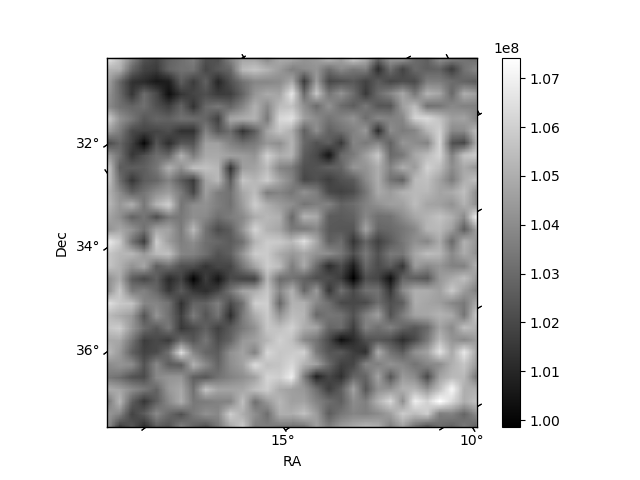
Histogram calculated using DETX and DETY for each event in the final _common_clean file
| Quadrant A | 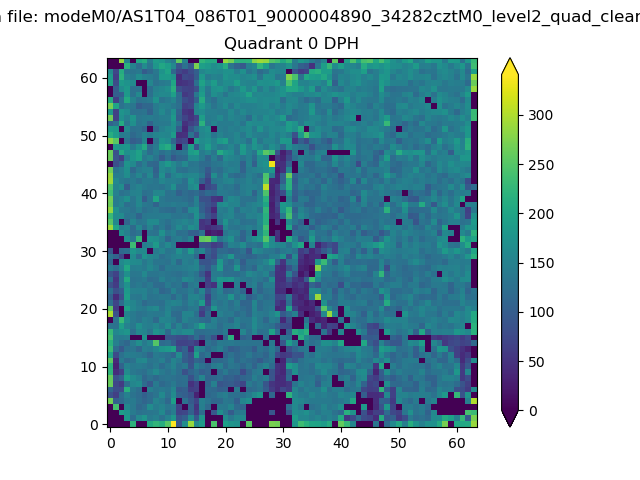 |
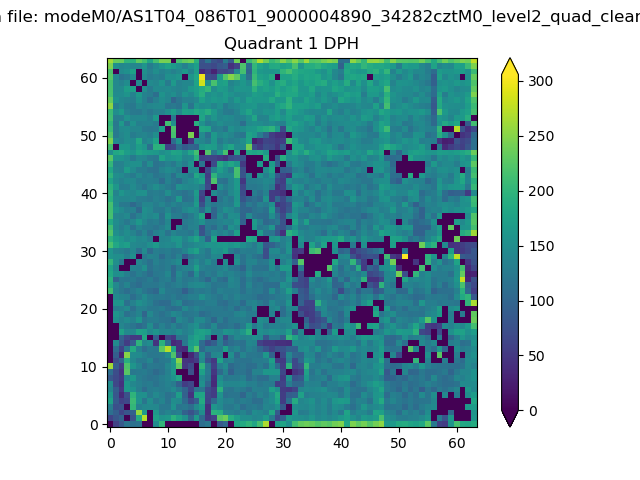 |
Quadrant B |
|---|---|---|---|
| Quadrant D | 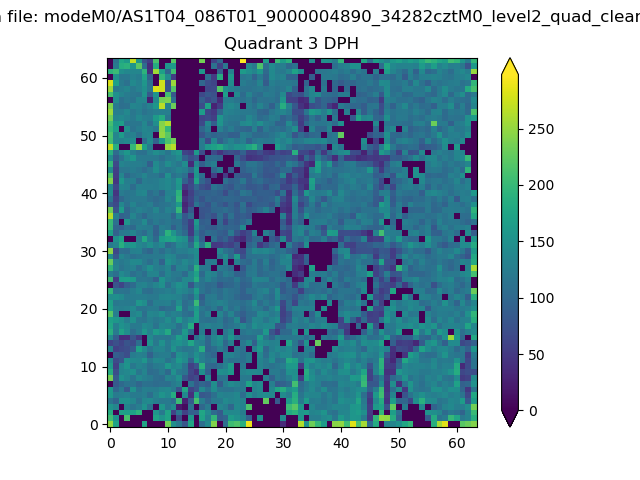 |
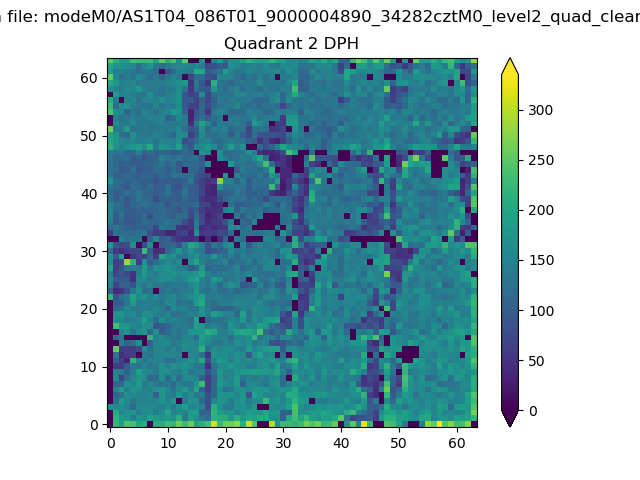 |
Quadrant C |
| Plot type | Count rate plots | Images |
|---|---|---|
| Comparison with Poisson distribution Blue bars denote a histogram of data divided into 1 sec bins. Red curve is a Poisson curve with rate = median count rate of data. |
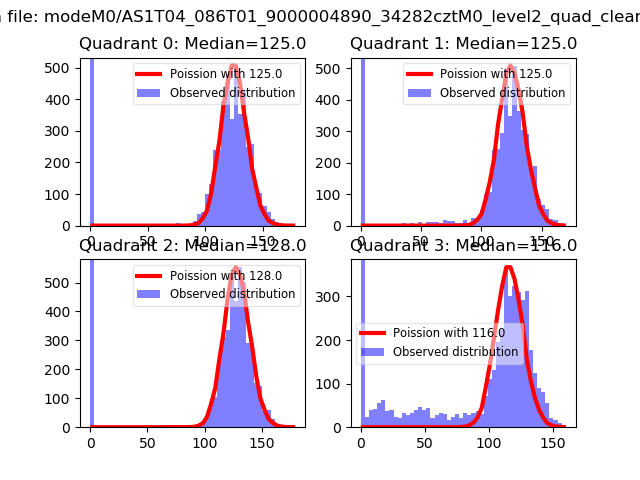 |
 |
| Quadrant-wise count rates Data is divided into 100 sec bins |
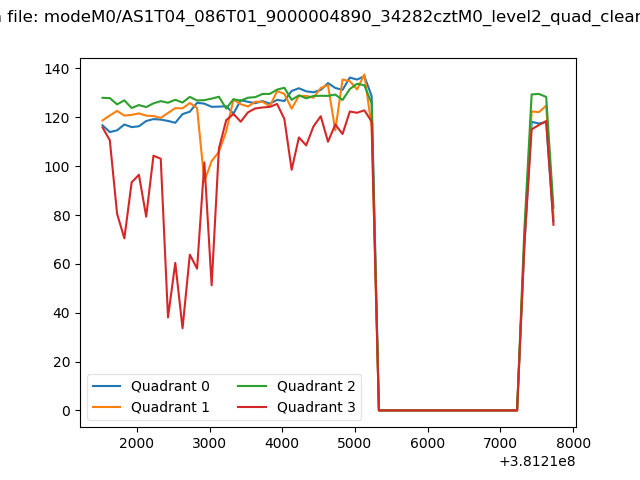 |
|
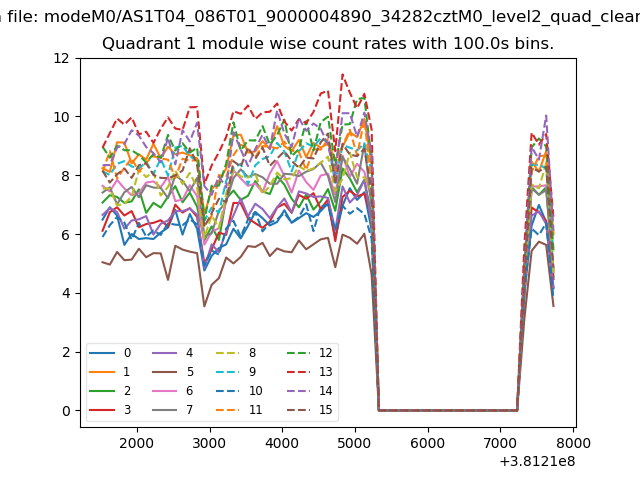
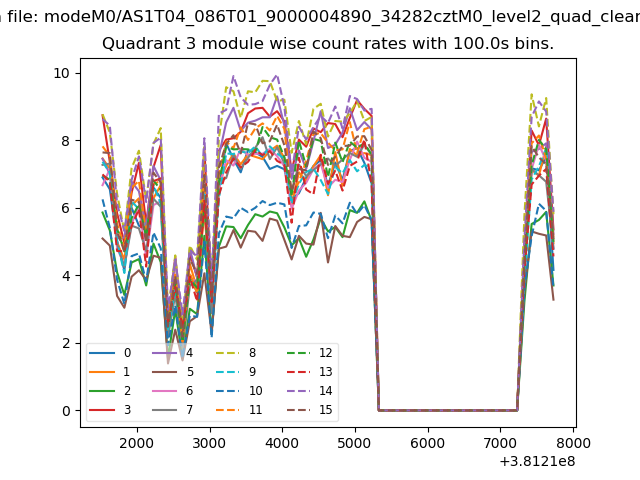
| Module-wise count rates for Quadrant A Data is divided into 100 sec bins |
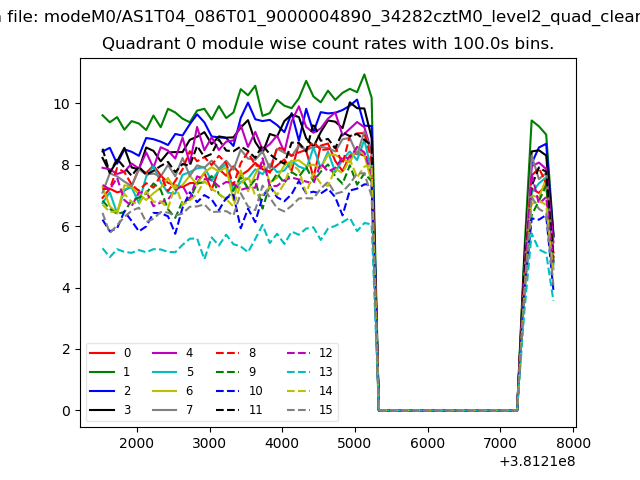 |
 |
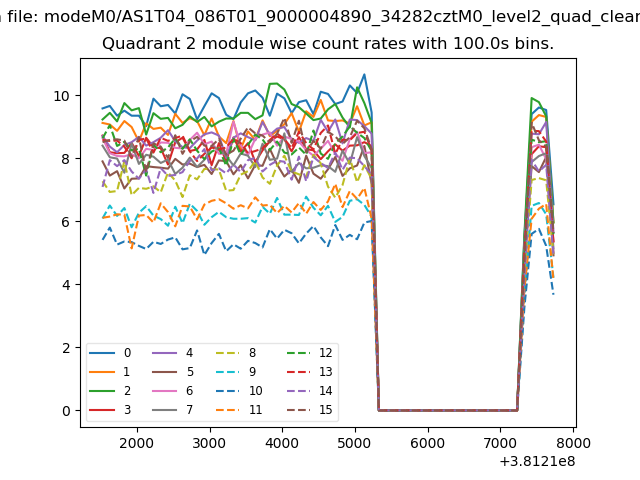
| Module-wise count rates for Quadrant B Data is divided into 100 sec bins |
 |
 |
| Module-wise count rates for Quadrant C Data is divided into 100 sec bins |
 |
 |
| Module-wise count rates for Quadrant D Data is divided into 100 sec bins |
 |
 |
| Parameter | Plot |
|---|---|
| CZT HV Monitor | 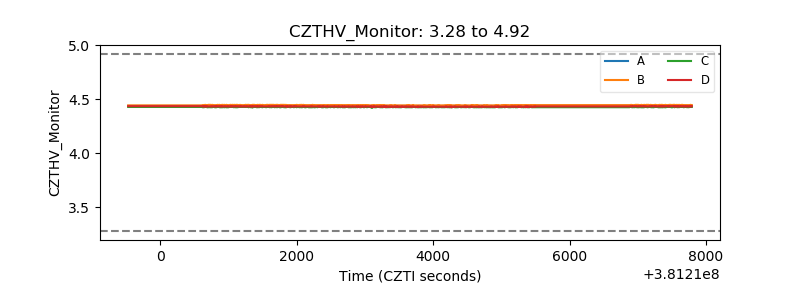 |
| D_VDD | 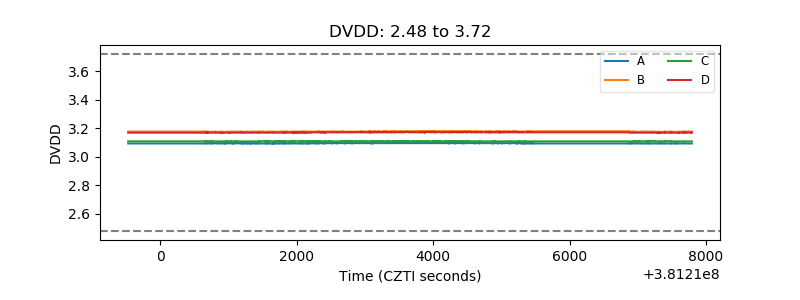 |
| Temperature 1 | 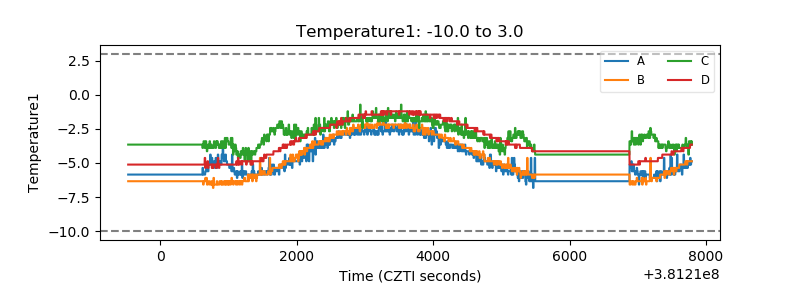 |
| Veto HV Monitor | 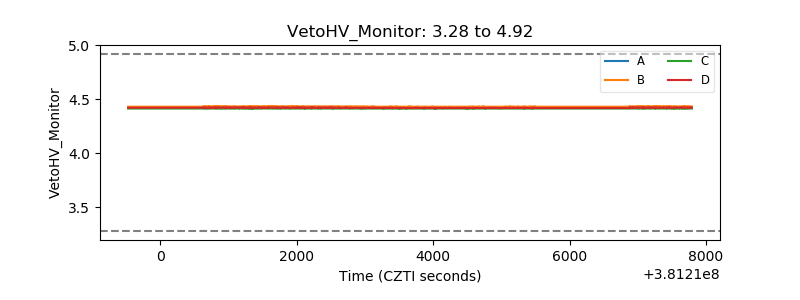 |
| Veto LLD | 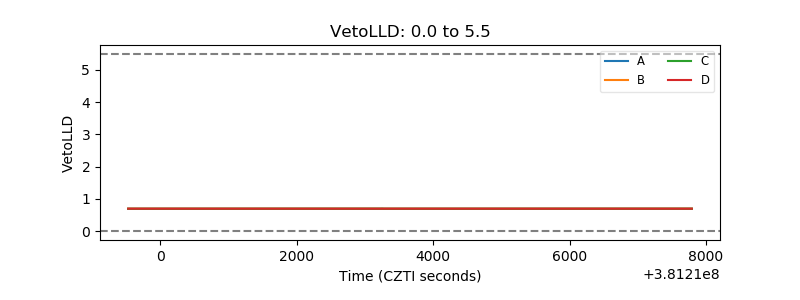 |
| Alpha Counter | 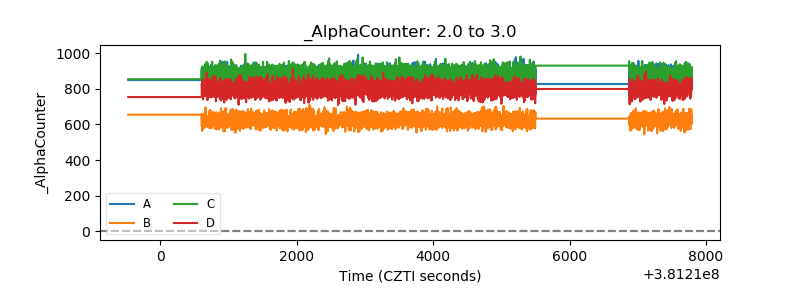 |
| _CPM_Rate | 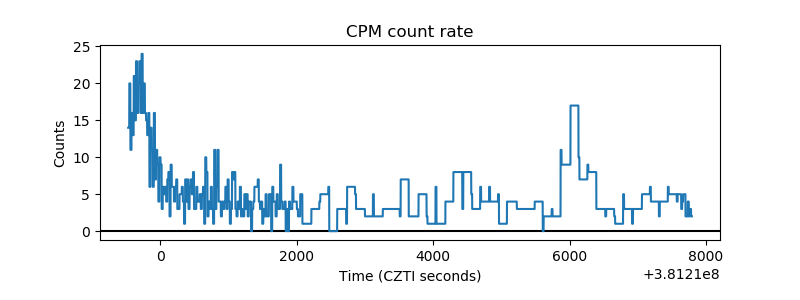 |
| CZT Counter | 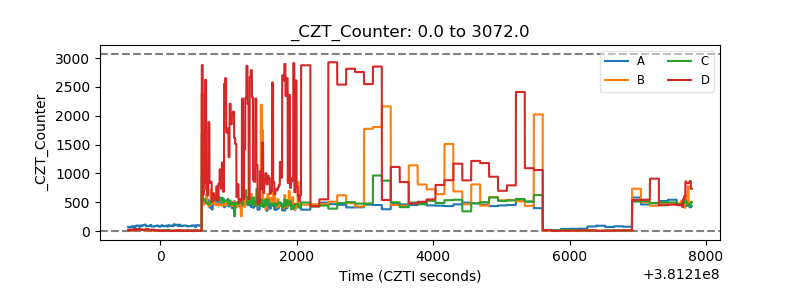 |
| +2.5 Volts monitor | 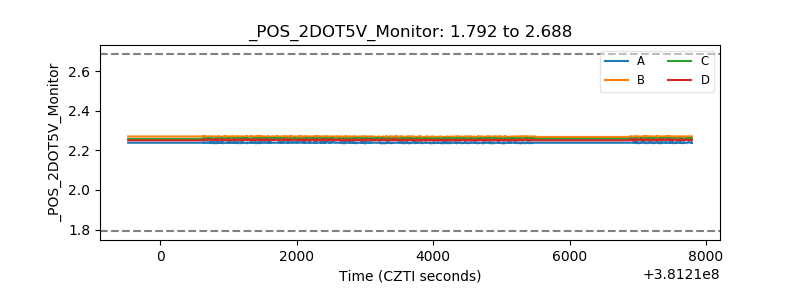 |
| +5 Volts monitor | 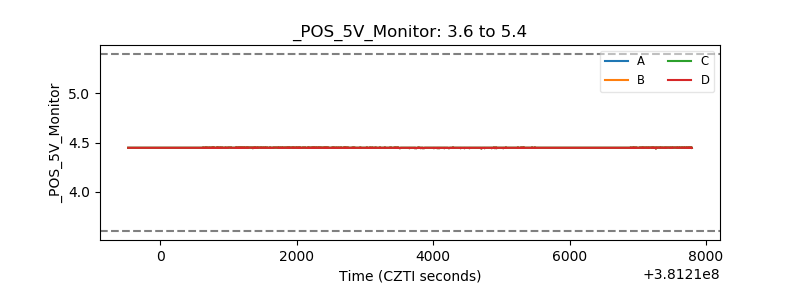 |
| _ROLL_ROT | 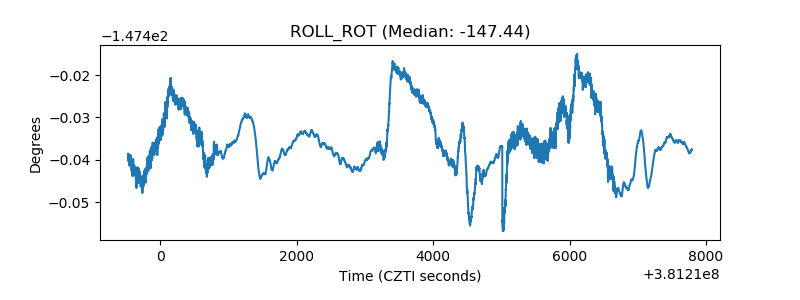 |
| _Roll_DEC | 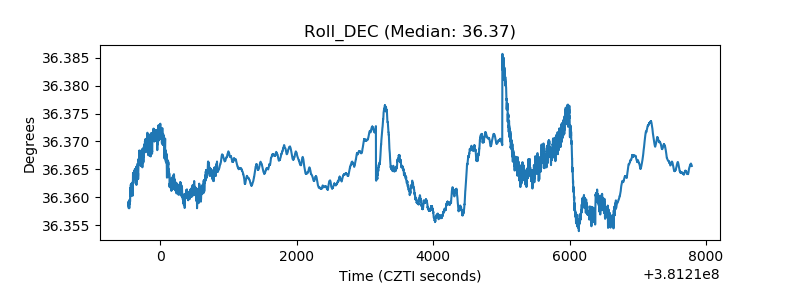 |
| _Roll_RA | 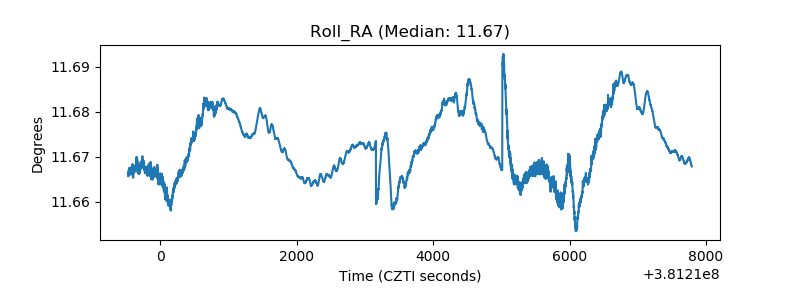 |
| Veto Counter | 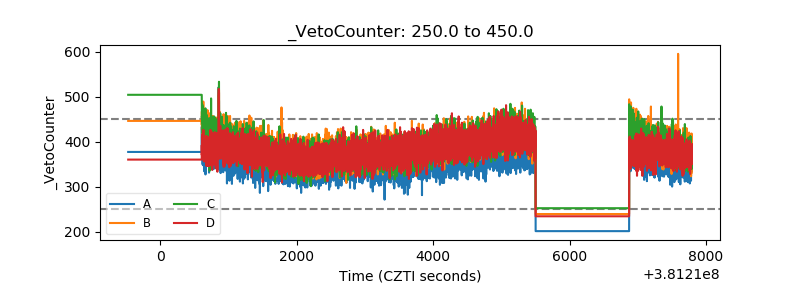 |