| Param | Original file | Final file |
|---|---|---|
| Filename | modeM0/AS1T04_086T01_9000004890_34281cztM0_level2.evt | modeM0/AS1T04_086T01_9000004890_34281cztM0_level2_quad_clean.evt |
| Size (bytes) | 544,098,240 | 65,733,120 |
| Size | 518.9 MB | 62.7 MB |
| Events in quadrant A | 2,501,665 | 421,199 |
| Events in quadrant B | 3,580,158 | 420,188 |
| Events in quadrant C | 2,933,401 | 432,766 |
| Events in quadrant D | 7,089,903 | 330,666 |
| Mode M0 | |||
|---|---|---|---|
| Quadrant | BADHDUFLAG | Total packets | Discarded packets |
| A | 0 | 11086 | 3 |
| B | 0 | 14125 | 2 |
| C | 0 | 11786 | 2 |
| D | 0 | 24854 | 2 |
| Mode SS | |||
|---|---|---|---|
| Quadrant | BADHDUFLAG | Total packets | Discarded packets |
| A | 0 | 112 | 0 |
| B | 0 | 112 | 0 |
| C | 0 | 112 | 0 |
| D | 0 | 112 | 0 |
| Mode M9 | |||
|---|---|---|---|
| Quadrant | BADHDUFLAG | Total packets | Discarded packets |
| A | 0 | 25 | 0 |
| B | 0 | 25 | 0 |
| C | 0 | 25 | 0 |
| D | 0 | 26 | 0 |
| Quadrant | Total seconds | Saturated seconds | Saturation percentage |
|---|---|---|---|
| A | 5501 | 6 | 0.109071% |
| B | 5501 | 226 | 4.108344% |
| C | 5501 | 12 | 0.218142% |
| D | 5501 | 1452 | 26.395201% |
Noise dominated data is calculated using 1-second bins in cleaned event files. If a bin has >2000 counts, and if more than 50% of those come from <1% of pixels, then it is considered to be noise-dominated and hence unusable.
| Quadrant | # 1 sec bins | Bins with >0 counts | Bins with >2000 counts | High rate bins dominated by noise | Noise dominated (total time) | Noise dominated (detector-on time) | Marked lightcurve |
|---|---|---|---|---|---|---|---|
| A | 7113 | 5502 | 0 | 0 | 0.00% | 0.00% | 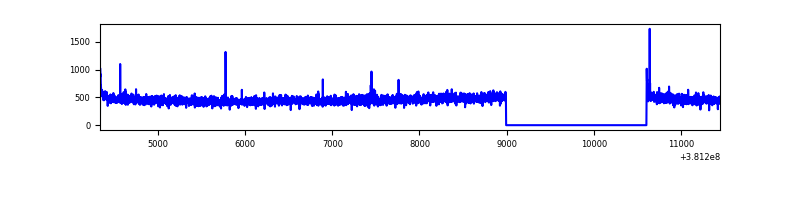 |
| B | 7113 | 5502 | 147 | 147 | 2.07% | 2.67% | 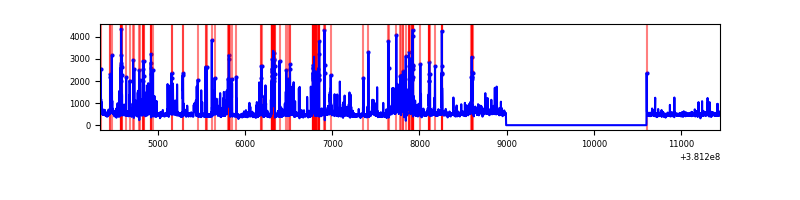 |
| C | 7113 | 5502 | 13 | 13 | 0.18% | 0.24% | 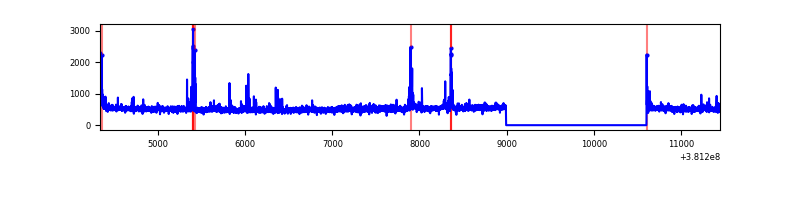 |
| D | 7113 | 5501 | 1312 | 1312 | 18.45% | 23.85% | 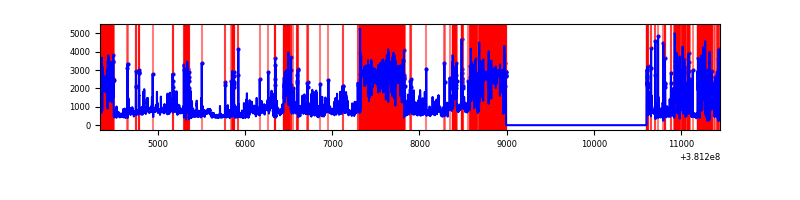 |
Top three noisy pixels from each quadrant. If the there are fewer than three noisy pixels in the level2.evt file, extra rows are filled as -1
| Pixel properties | Quadrant properties | ||||||
|---|---|---|---|---|---|---|---|
| Quadrant | DetID | PixID | Counts | Sigma | Mean | Median | Sigma |
| A | 10 | 83 | 26382 | 201.47 | 634 | 620 | 127.9 |
| A | 13 | 6 | 14005 | 104.68 | 634 | 620 | 127.9 |
| A | 9 | 143 | 11242 | 83.07 | 634 | 620 | 127.9 |
| B | 5 | 172 | 617477 | 5098.66 | 628 | 612 | 121.0 |
| B | 0 | 229 | 182473 | 1503.16 | 628 | 612 | 121.0 |
| B | 4 | 251 | 119015 | 978.65 | 628 | 612 | 121.0 |
| C | 15 | 214 | 242174 | 1670.71 | 628 | 634 | 144.6 |
| C | 14 | 254 | 101140 | 695.19 | 628 | 634 | 144.6 |
| C | 1 | 128 | 72785 | 499.06 | 628 | 634 | 144.6 |
| D | 7 | 223 | 2970397 | 22744.26 | 532 | 517 | 130.6 |
| D | 8 | 195 | 689820 | 5278.9 | 532 | 517 | 130.6 |
| D | 13 | 249 | 632946 | 4843.34 | 532 | 517 | 130.6 |
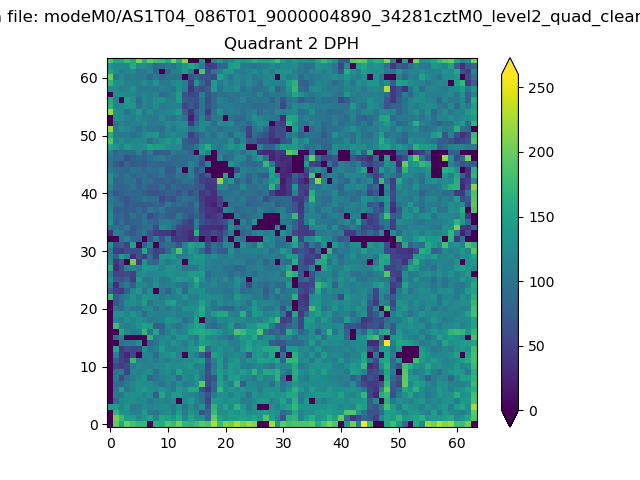
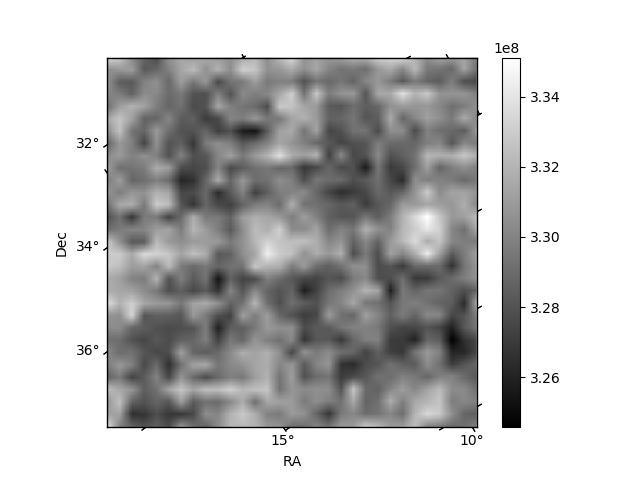
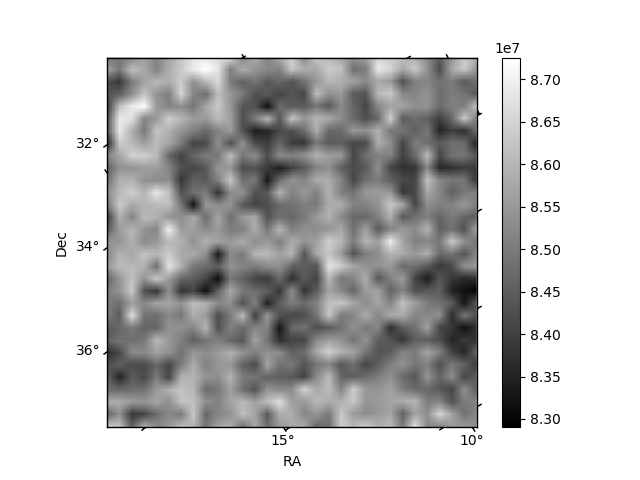
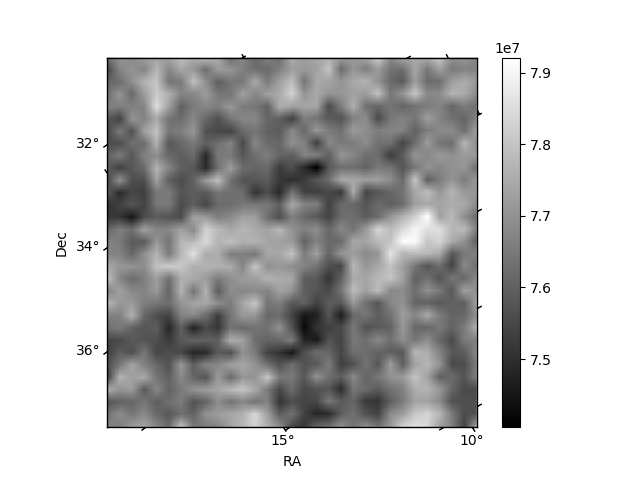
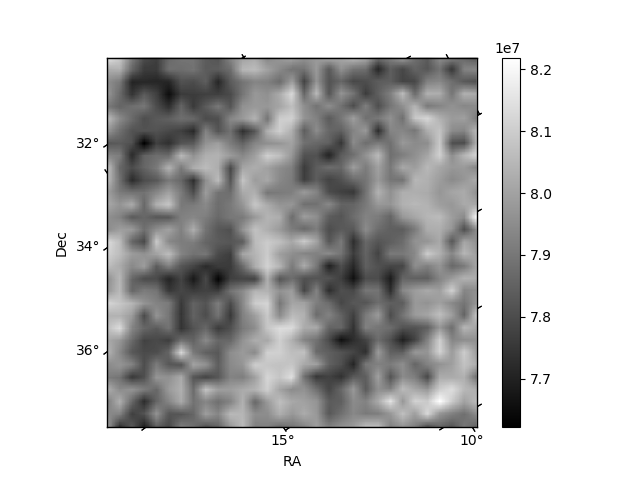
Histogram calculated using DETX and DETY for each event in the final _common_clean file
| Quadrant A | 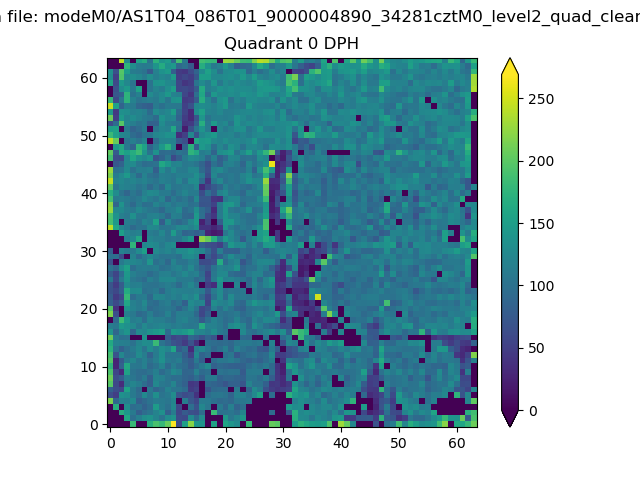 |
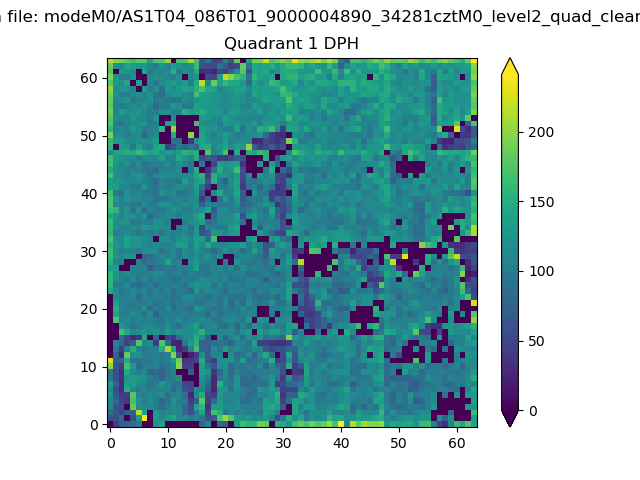 |
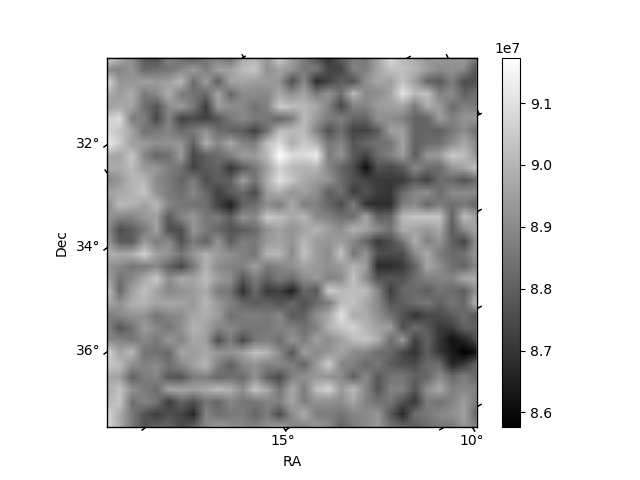
Quadrant B |
|---|---|---|---|
| Quadrant D | 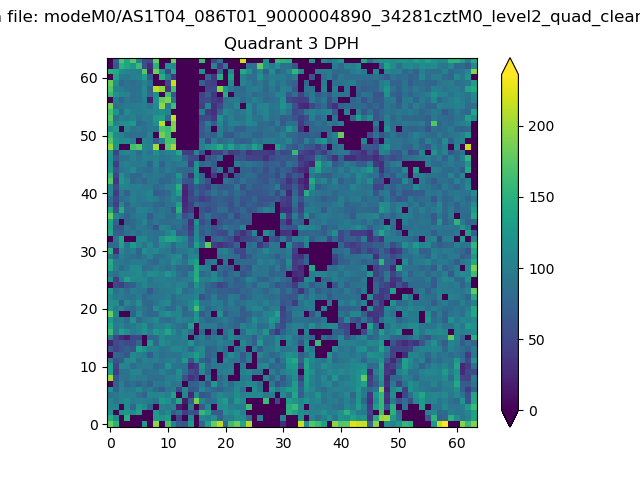 |
 |
Quadrant C |
| Plot type | Count rate plots | Images |
|---|---|---|
| Comparison with Poisson distribution Blue bars denote a histogram of data divided into 1 sec bins. Red curve is a Poisson curve with rate = median count rate of data. |
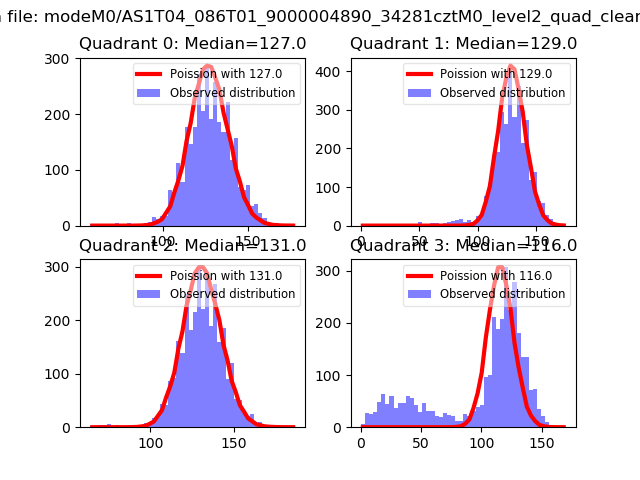 |
 |
| Quadrant-wise count rates Data is divided into 100 sec bins |
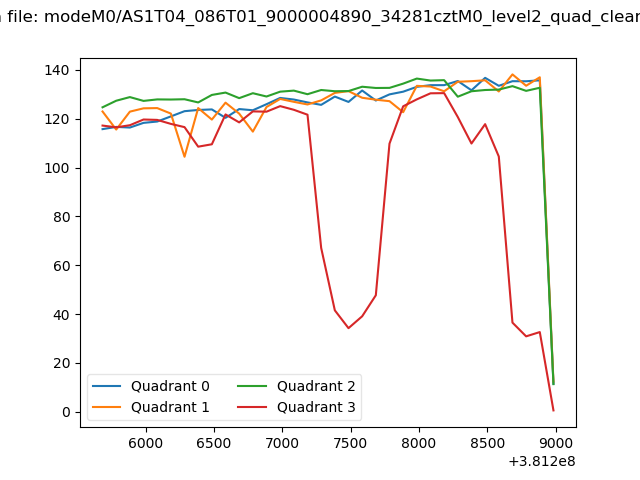 |
|
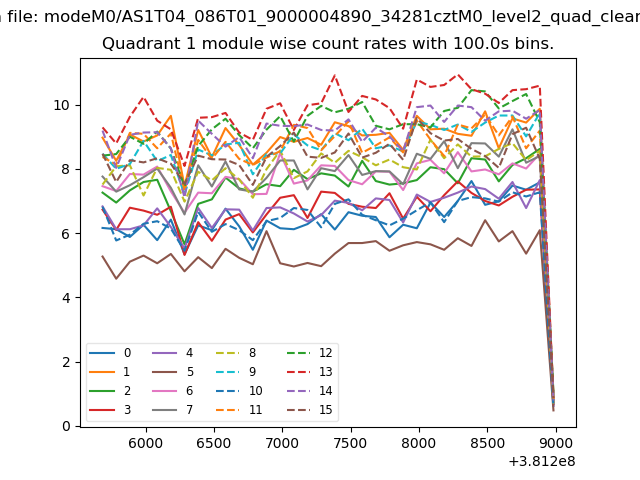
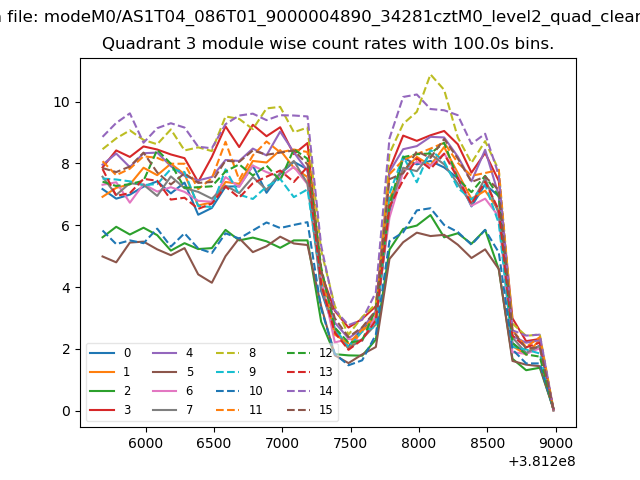
| Module-wise count rates for Quadrant A Data is divided into 100 sec bins |
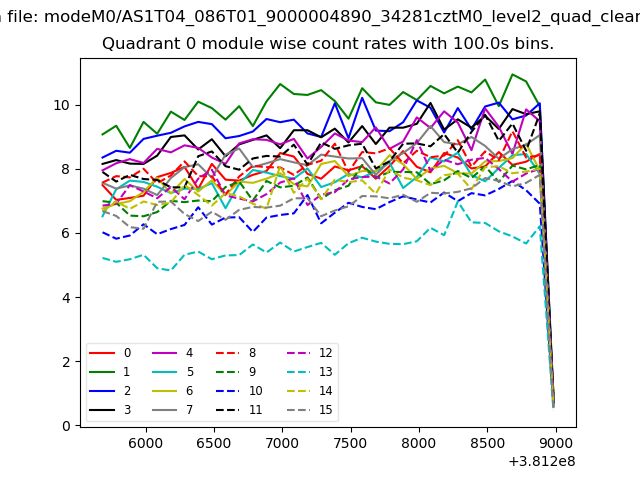 |
 |
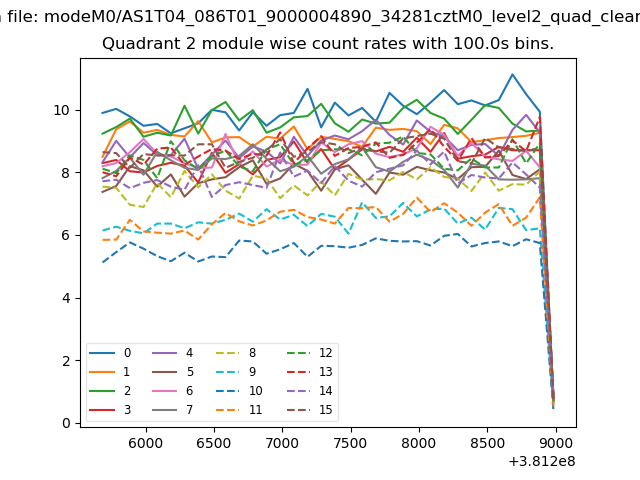
| Module-wise count rates for Quadrant B Data is divided into 100 sec bins |
 |
 |
| Module-wise count rates for Quadrant C Data is divided into 100 sec bins |
 |
 |
| Module-wise count rates for Quadrant D Data is divided into 100 sec bins |
 |
 |
| Parameter | Plot |
|---|---|
| CZT HV Monitor | 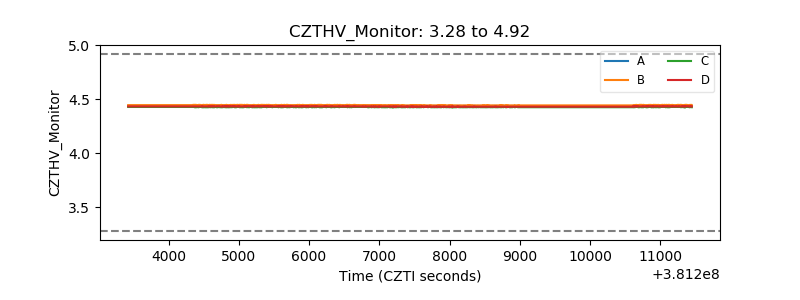 |
| D_VDD | 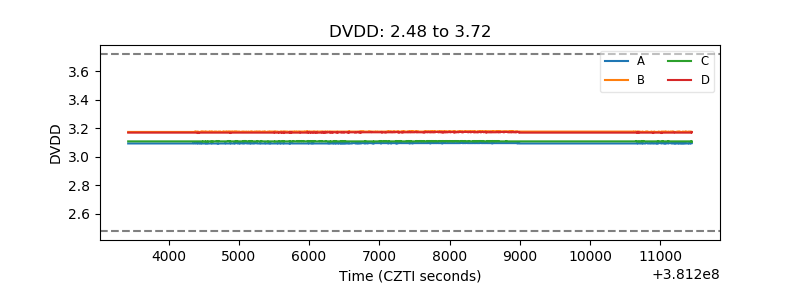 |
| Temperature 1 | 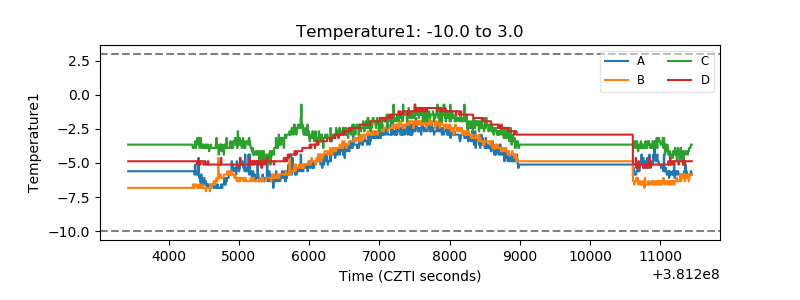 |
| Veto HV Monitor | 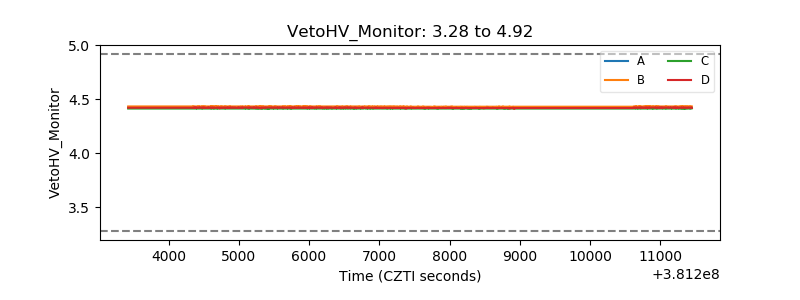 |
| Veto LLD | 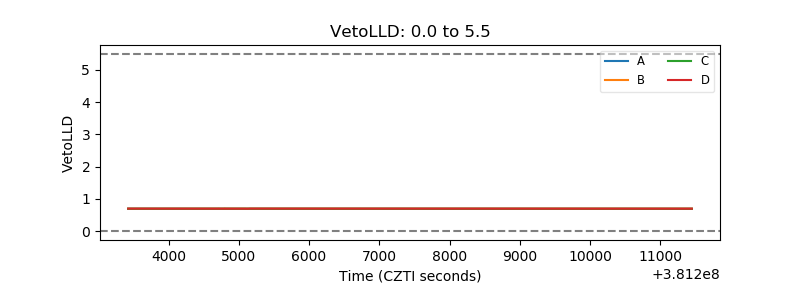 |
| Alpha Counter | 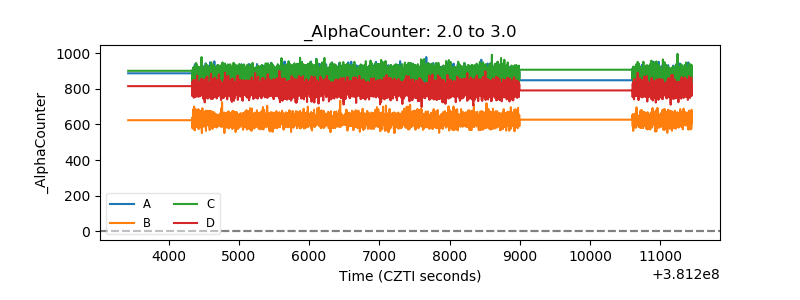 |
| _CPM_Rate | 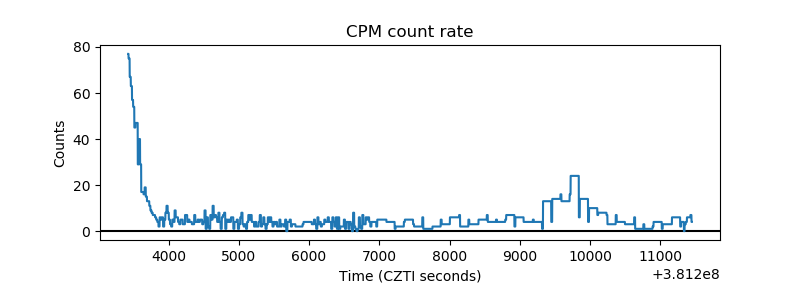 |
| CZT Counter | 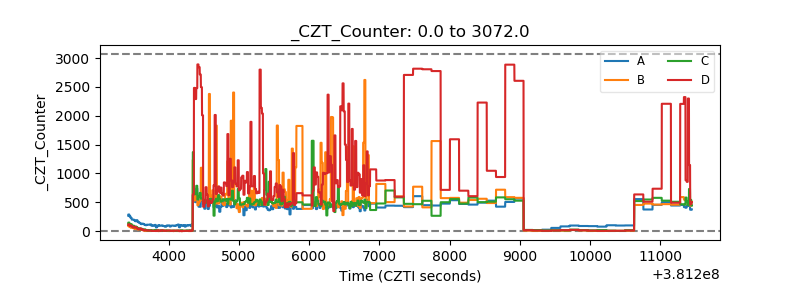 |
| +2.5 Volts monitor | 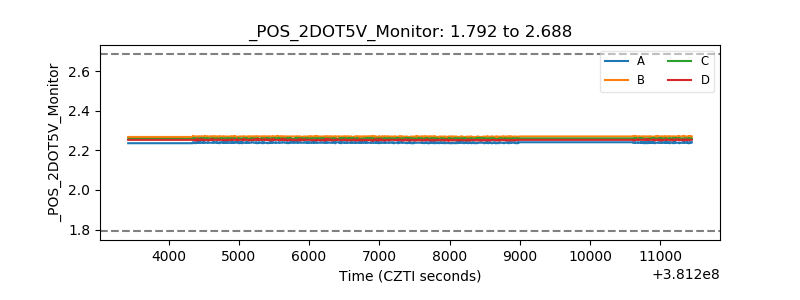 |
| +5 Volts monitor | 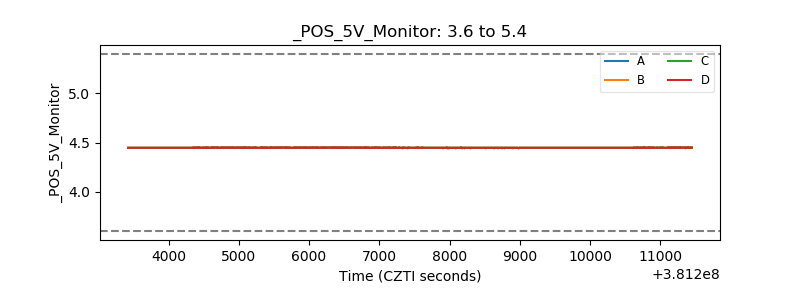 |
| _ROLL_ROT | 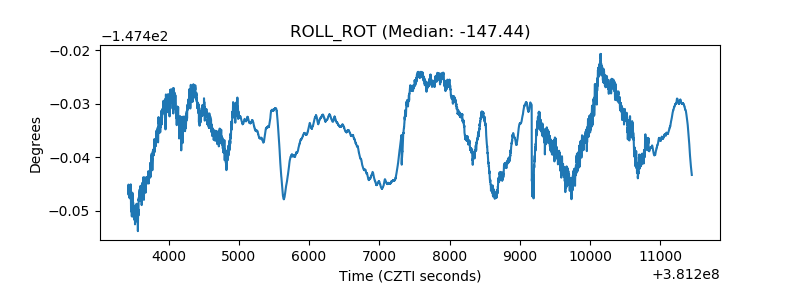 |
| _Roll_DEC | 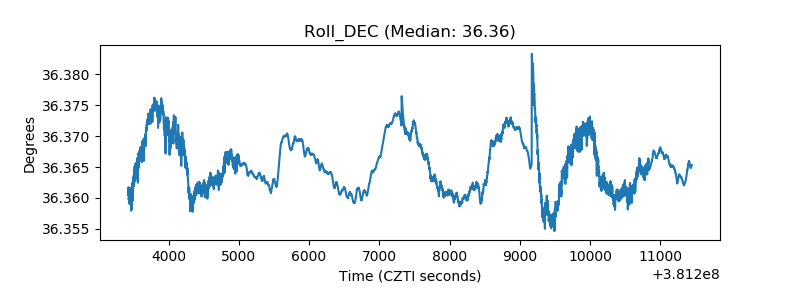 |
| _Roll_RA | 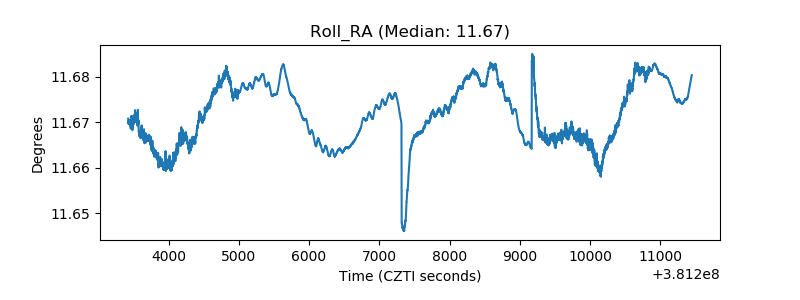 |
| Veto Counter | 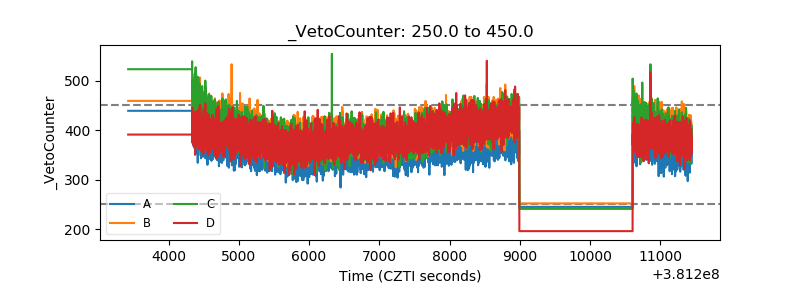 |