| Param | Original file | Final file |
|---|---|---|
| Filename | modeM0/AS1T04_086T01_9000004890_34280cztM0_level2.evt | modeM0/AS1T04_086T01_9000004890_34280cztM0_level2_quad_clean.evt |
| Size (bytes) | 563,068,800 | 52,882,560 |
| Size | 537.0 MB | 50.4 MB |
| Events in quadrant A | 2,418,576 | 333,774 |
| Events in quadrant B | 3,946,994 | 333,962 |
| Events in quadrant C | 2,830,821 | 347,316 |
| Events in quadrant D | 7,501,570 | 218,525 |
| Mode M0 | |||
|---|---|---|---|
| Quadrant | BADHDUFLAG | Total packets | Discarded packets |
| A | 0 | 10607 | 3 |
| B | 0 | 15118 | 2 |
| C | 0 | 11295 | 2 |
| D | 0 | 25778 | 2 |
| Mode SS | |||
|---|---|---|---|
| Quadrant | BADHDUFLAG | Total packets | Discarded packets |
| A | 0 | 106 | 0 |
| B | 0 | 106 | 0 |
| C | 0 | 106 | 0 |
| D | 0 | 106 | 0 |
| Mode M9 | |||
|---|---|---|---|
| Quadrant | BADHDUFLAG | Total packets | Discarded packets |
| A | 0 | 26 | 0 |
| B | 0 | 26 | 0 |
| C | 0 | 26 | 0 |
| D | 0 | 27 | 0 |
| Quadrant | Total seconds | Saturated seconds | Saturation percentage |
|---|---|---|---|
| A | 5239 | 6 | 0.114526% |
| B | 5239 | 434 | 8.284024% |
| C | 5239 | 16 | 0.305402% |
| D | 5239 | 1579 | 30.139340% |
Noise dominated data is calculated using 1-second bins in cleaned event files. If a bin has >2000 counts, and if more than 50% of those come from <1% of pixels, then it is considered to be noise-dominated and hence unusable.
| Quadrant | # 1 sec bins | Bins with >0 counts | Bins with >2000 counts | High rate bins dominated by noise | Noise dominated (total time) | Noise dominated (detector-on time) | Marked lightcurve |
|---|---|---|---|---|---|---|---|
| A | 7182 | 5240 | 1 | 1 | 0.01% | 0.02% | 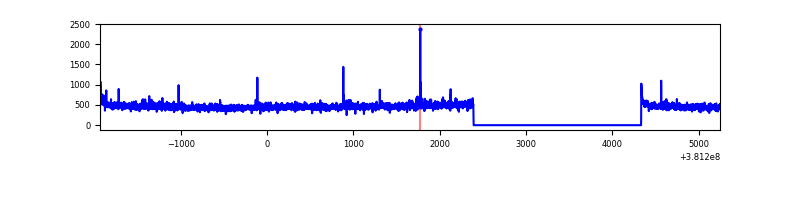 |
| B | 7182 | 5240 | 279 | 279 | 3.88% | 5.32% | 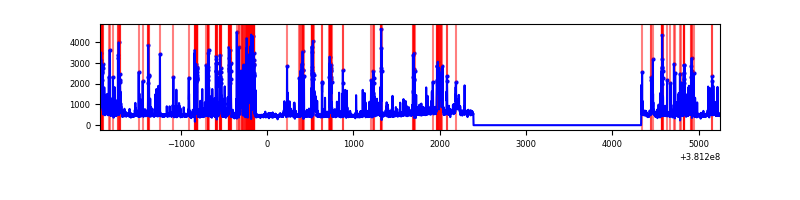 |
| C | 7182 | 5240 | 11 | 11 | 0.15% | 0.21% |  |
| D | 7182 | 5240 | 1447 | 1447 | 20.15% | 27.61% | 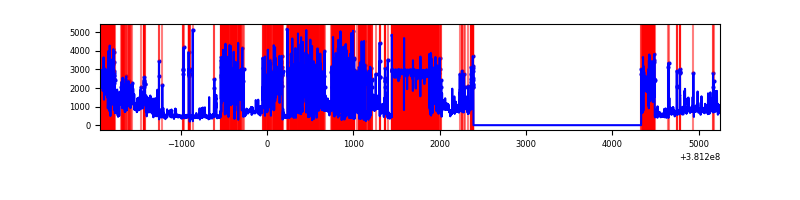 |
Top three noisy pixels from each quadrant. If the there are fewer than three noisy pixels in the level2.evt file, extra rows are filled as -1
| Pixel properties | Quadrant properties | ||||||
|---|---|---|---|---|---|---|---|
| Quadrant | DetID | PixID | Counts | Sigma | Mean | Median | Sigma |
| A | 10 | 83 | 25605 | 203.88 | 609 | 597 | 122.7 |
| A | 9 | 143 | 18390 | 145.06 | 609 | 597 | 122.7 |
| A | 13 | 6 | 13394 | 104.33 | 609 | 597 | 122.7 |
| B | 5 | 172 | 1229498 | 10874.42 | 594 | 579 | 113.0 |
| B | 0 | 229 | 124575 | 1097.21 | 594 | 579 | 113.0 |
| B | 0 | 182 | 63402 | 555.91 | 594 | 579 | 113.0 |
| C | 15 | 214 | 230428 | 1657.68 | 604 | 612 | 138.6 |
| C | 14 | 254 | 64723 | 462.44 | 604 | 612 | 138.6 |
| C | 0 | 10 | 62605 | 447.16 | 604 | 612 | 138.6 |
| D | 7 | 223 | 3818576 | 32146.61 | 491 | 480 | 118.8 |
| D | 8 | 195 | 764931 | 6436.32 | 491 | 480 | 118.8 |
| D | 12 | 235 | 390307 | 3282.16 | 491 | 480 | 118.8 |
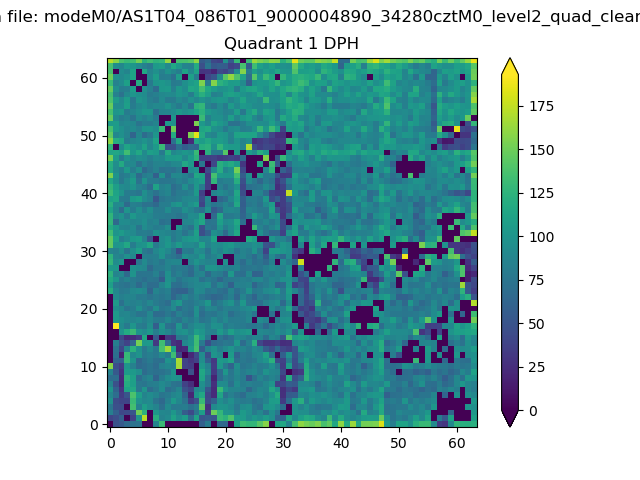
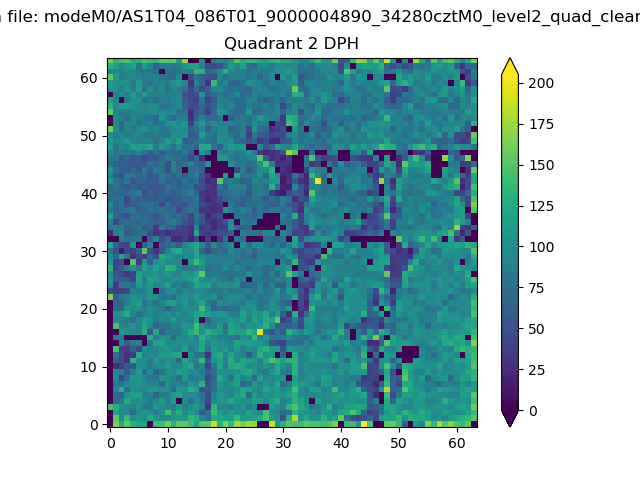
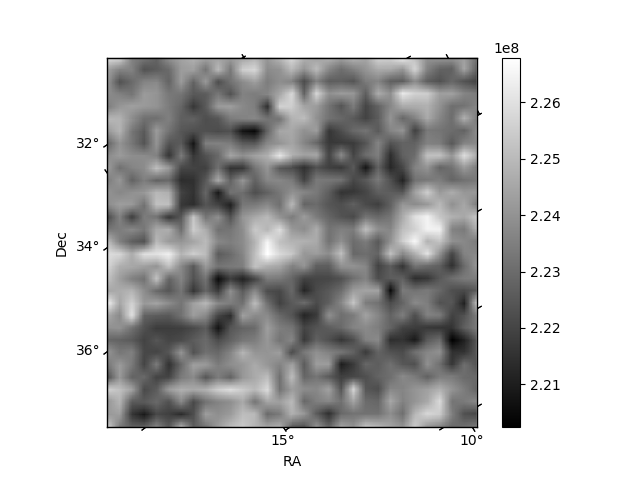
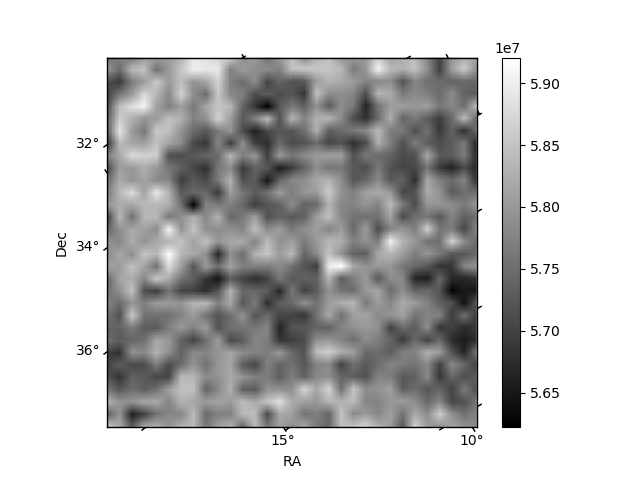
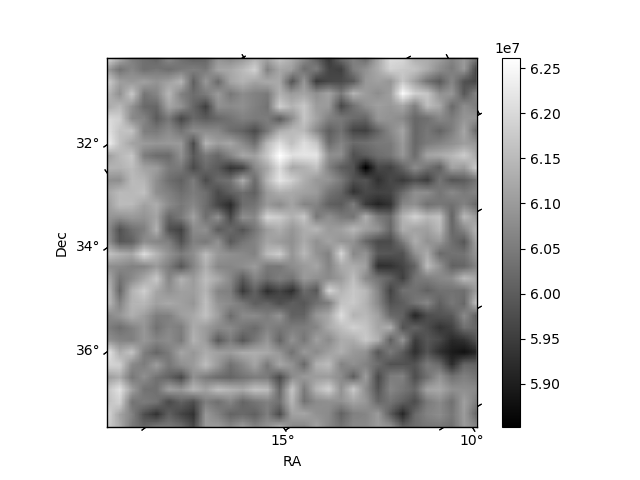
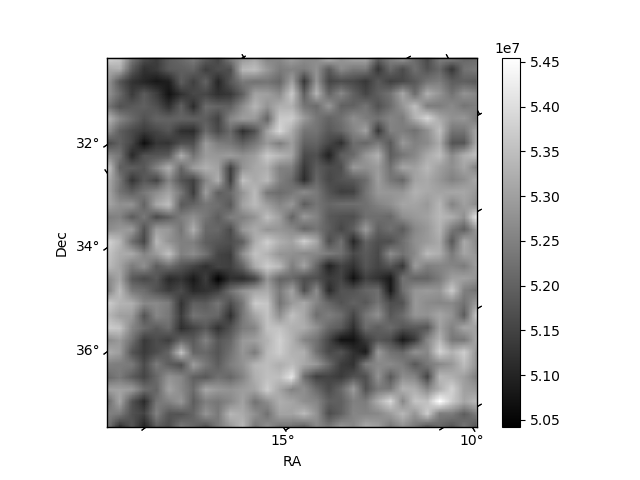
Histogram calculated using DETX and DETY for each event in the final _common_clean file
| Quadrant A | 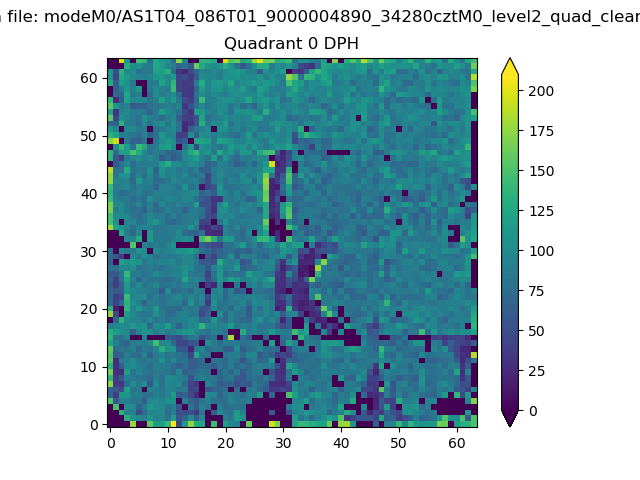 |
 |
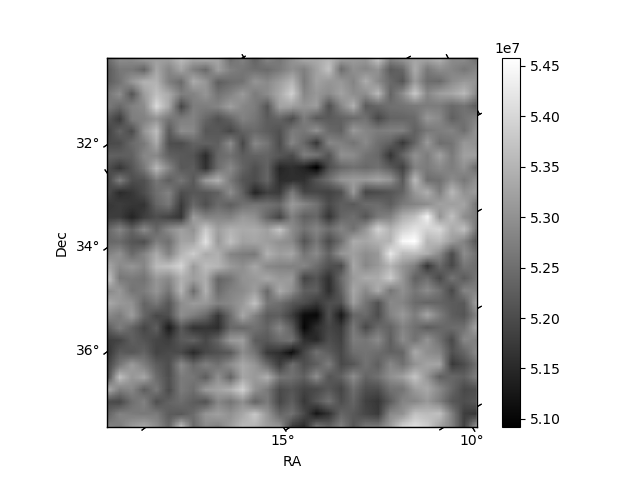
Quadrant B |
|---|---|---|---|
| Quadrant D | 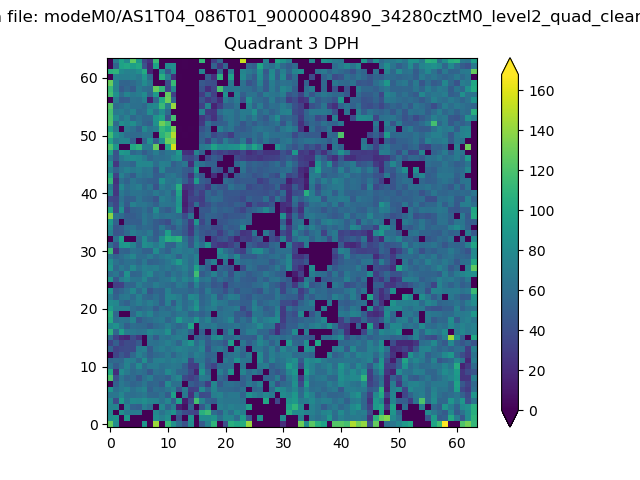 |
 |
Quadrant C |
| Plot type | Count rate plots | Images |
|---|---|---|
| Comparison with Poisson distribution Blue bars denote a histogram of data divided into 1 sec bins. Red curve is a Poisson curve with rate = median count rate of data. |
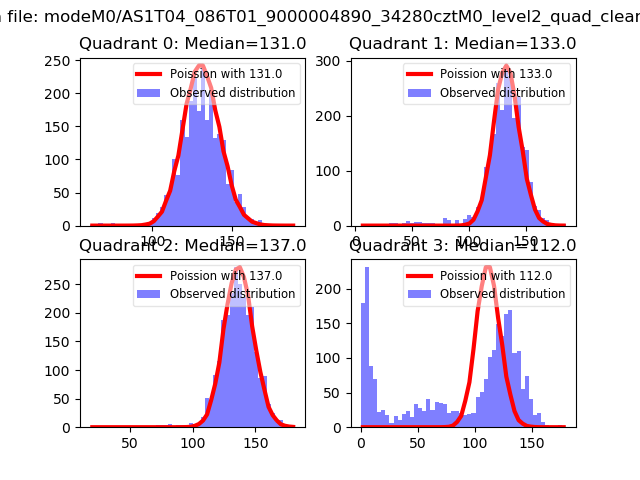 |
 |
| Quadrant-wise count rates Data is divided into 100 sec bins |
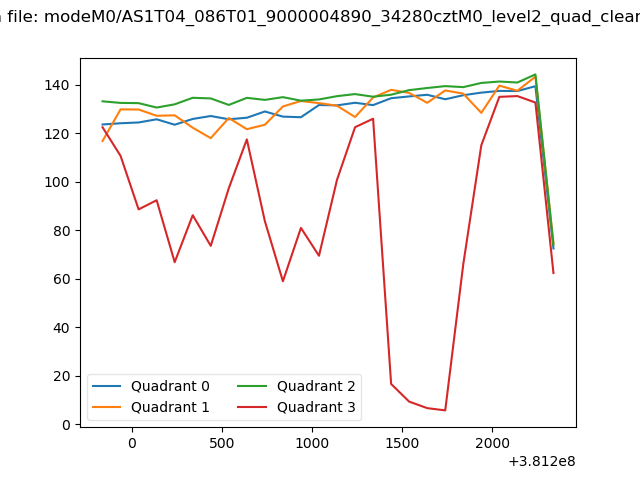 |
|
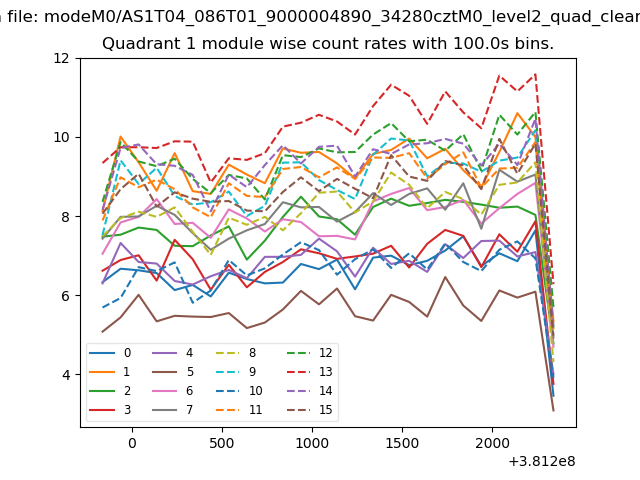
| Module-wise count rates for Quadrant A Data is divided into 100 sec bins |
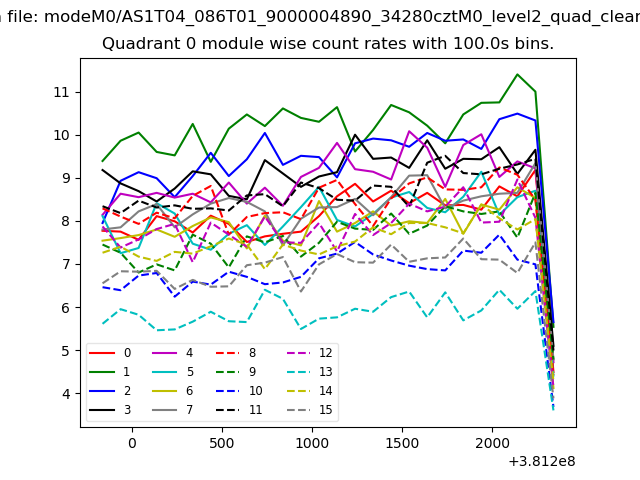 |
 |
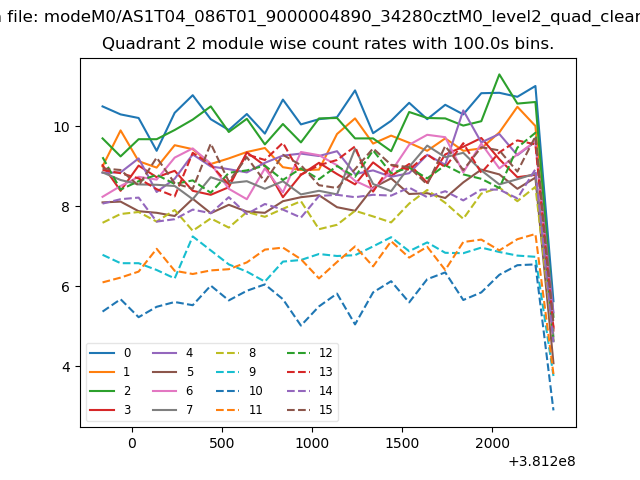
| Module-wise count rates for Quadrant B Data is divided into 100 sec bins |
 |
 |
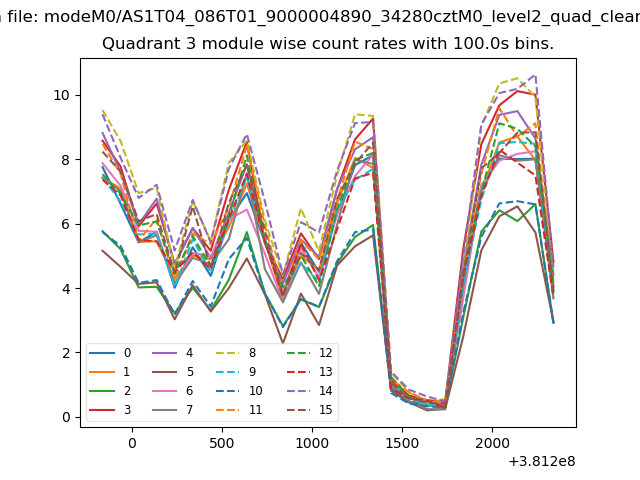
| Module-wise count rates for Quadrant C Data is divided into 100 sec bins |
 |
 |
| Module-wise count rates for Quadrant D Data is divided into 100 sec bins |
 |
 |
| Parameter | Plot |
|---|---|
| CZT HV Monitor | 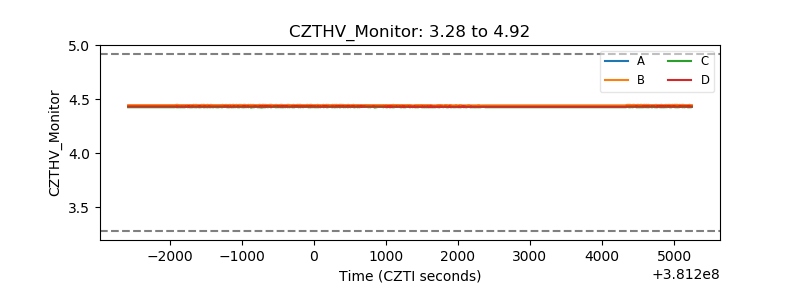 |
| D_VDD | 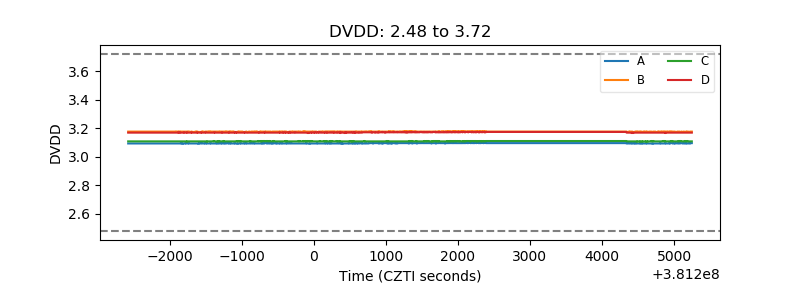 |
| Temperature 1 | 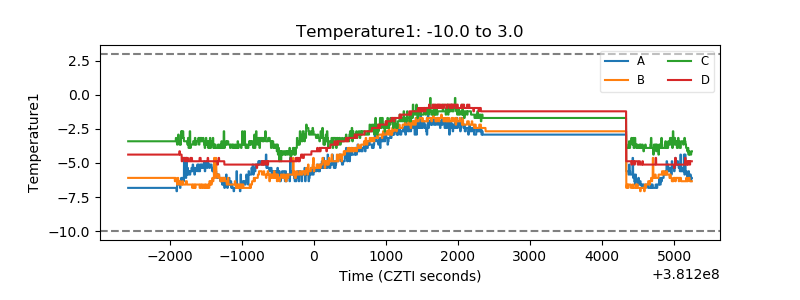 |
| Veto HV Monitor |  |
| Veto LLD | 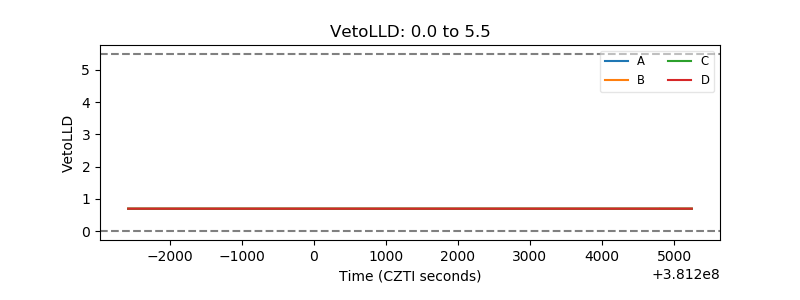 |
| Alpha Counter | 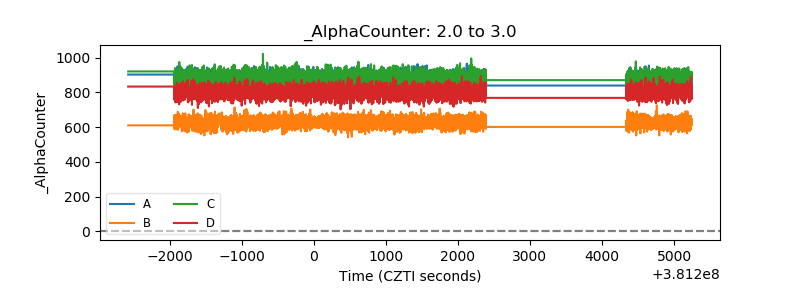 |
| _CPM_Rate |  |
| CZT Counter | 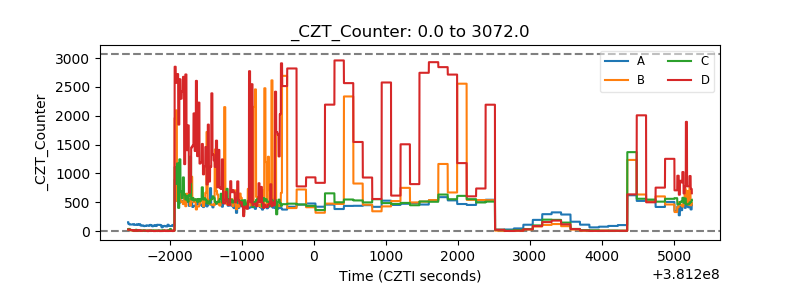 |
| +2.5 Volts monitor | 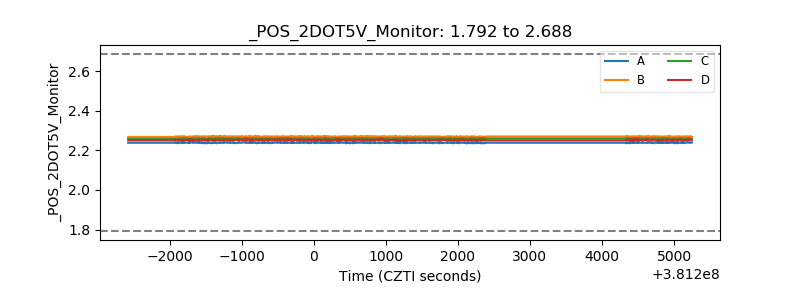 |
| +5 Volts monitor | 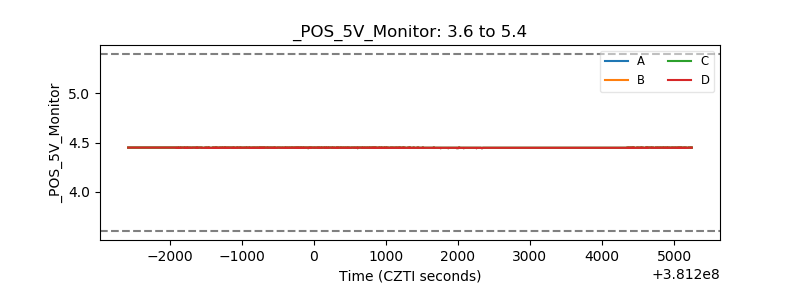 |
| _ROLL_ROT | 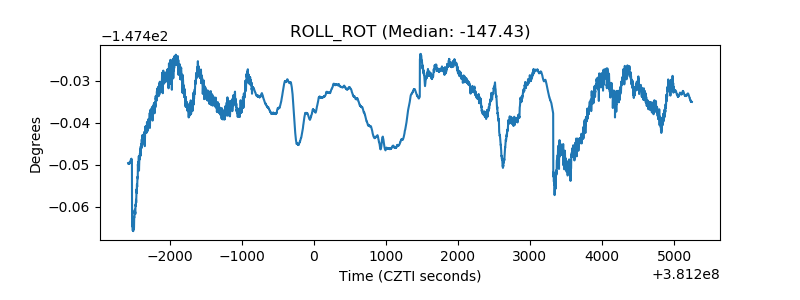 |
| _Roll_DEC | 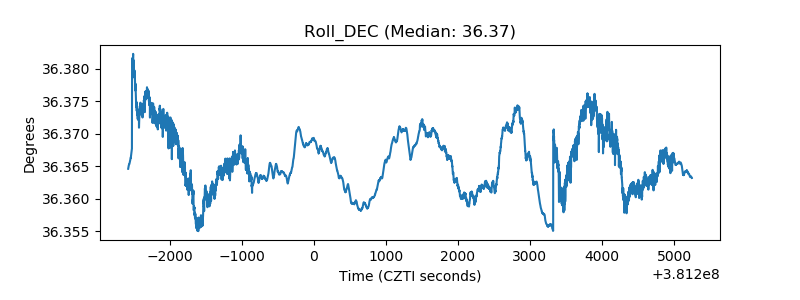 |
| _Roll_RA | 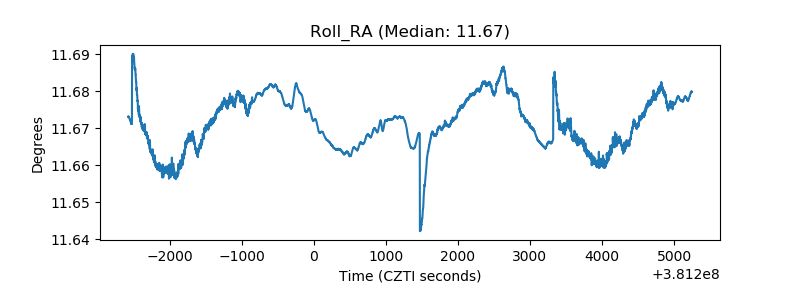 |
| Veto Counter | 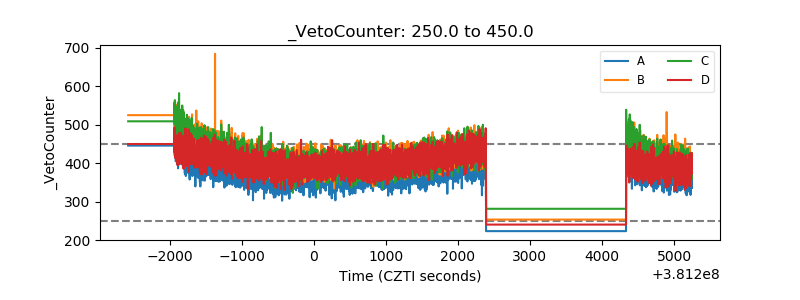 |