| Param | Original file | Final file |
|---|---|---|
| Filename | modeM0/AS1T04_086T01_9000004890_34279cztM0_level2.evt | modeM0/AS1T04_086T01_9000004890_34279cztM0_level2_quad_clean.evt |
| Size (bytes) | 466,902,720 | 49,982,400 |
| Size | 445.3 MB | 47.7 MB |
| Events in quadrant A | 2,462,986 | 287,499 |
| Events in quadrant B | 3,612,815 | 284,558 |
| Events in quadrant C | 2,834,961 | 300,210 |
| Events in quadrant D | 4,877,483 | 277,061 |
| Mode M0 | |||
|---|---|---|---|
| Quadrant | BADHDUFLAG | Total packets | Discarded packets |
| A | 0 | 10589 | 3 |
| B | 0 | 13976 | 2 |
| C | 0 | 11207 | 2 |
| D | 0 | 18121 | 2 |
| Mode SS | |||
|---|---|---|---|
| Quadrant | BADHDUFLAG | Total packets | Discarded packets |
| A | 0 | 106 | 0 |
| B | 0 | 106 | 0 |
| C | 0 | 106 | 0 |
| D | 0 | 106 | 0 |
| Mode M9 | |||
|---|---|---|---|
| Quadrant | BADHDUFLAG | Total packets | Discarded packets |
| A | 0 | 29 | 0 |
| B | 0 | 29 | 0 |
| C | 0 | 29 | 0 |
| D | 0 | 30 | 0 |
| Quadrant | Total seconds | Saturated seconds | Saturation percentage |
|---|---|---|---|
| A | 5189 | 9 | 0.173444% |
| B | 5189 | 352 | 6.783581% |
| C | 5189 | 25 | 0.481788% |
| D | 5189 | 353 | 6.802852% |
Noise dominated data is calculated using 1-second bins in cleaned event files. If a bin has >2000 counts, and if more than 50% of those come from <1% of pixels, then it is considered to be noise-dominated and hence unusable.
| Quadrant | # 1 sec bins | Bins with >0 counts | Bins with >2000 counts | High rate bins dominated by noise | Noise dominated (total time) | Noise dominated (detector-on time) | Marked lightcurve |
|---|---|---|---|---|---|---|---|
| A | 7284 | 5190 | 1 | 1 | 0.01% | 0.02% | 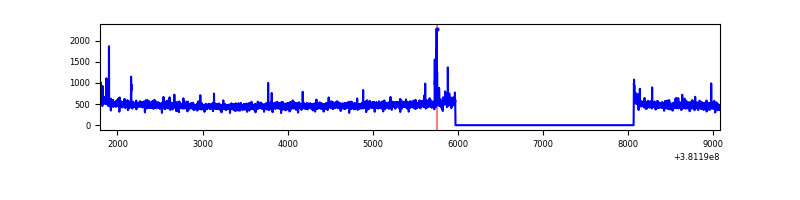 |
| B | 7284 | 5190 | 242 | 242 | 3.32% | 4.66% | 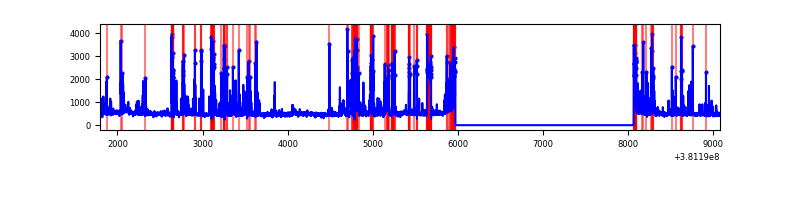 |
| C | 7284 | 5190 | 14 | 14 | 0.19% | 0.27% | 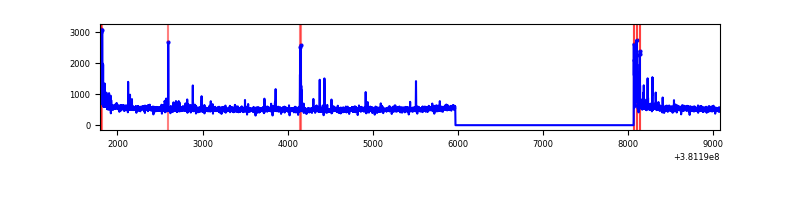 |
| D | 7284 | 5190 | 312 | 312 | 4.28% | 6.01% | 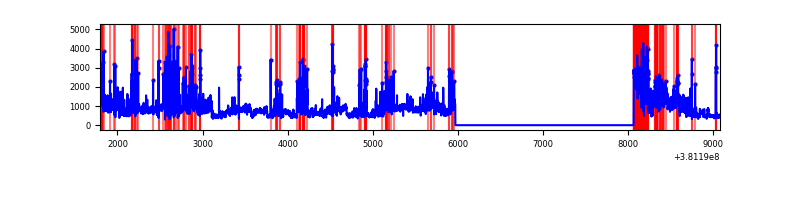 |
Top three noisy pixels from each quadrant. If the there are fewer than three noisy pixels in the level2.evt file, extra rows are filled as -1
| Pixel properties | Quadrant properties | ||||||
|---|---|---|---|---|---|---|---|
| Quadrant | DetID | PixID | Counts | Sigma | Mean | Median | Sigma |
| A | 9 | 143 | 28382 | 224.16 | 618 | 606 | 123.9 |
| A | 10 | 83 | 25001 | 196.88 | 618 | 606 | 123.9 |
| A | 13 | 6 | 12979 | 99.85 | 618 | 606 | 123.9 |
| B | 5 | 172 | 910371 | 7897.21 | 605 | 589 | 115.2 |
| B | 0 | 229 | 220340 | 1907.51 | 605 | 589 | 115.2 |
| B | 15 | 222 | 15618 | 130.46 | 605 | 589 | 115.2 |
| C | 15 | 214 | 225483 | 1583.49 | 617 | 624 | 142.0 |
| C | 0 | 10 | 102880 | 720.1 | 617 | 624 | 142.0 |
| C | 14 | 254 | 48104 | 334.36 | 617 | 624 | 142.0 |
| D | 8 | 195 | 877317 | 5837.41 | 592 | 577 | 150.2 |
| D | 12 | 235 | 437149 | 2906.73 | 592 | 577 | 150.2 |
| D | 7 | 80 | 350044 | 2326.78 | 592 | 577 | 150.2 |
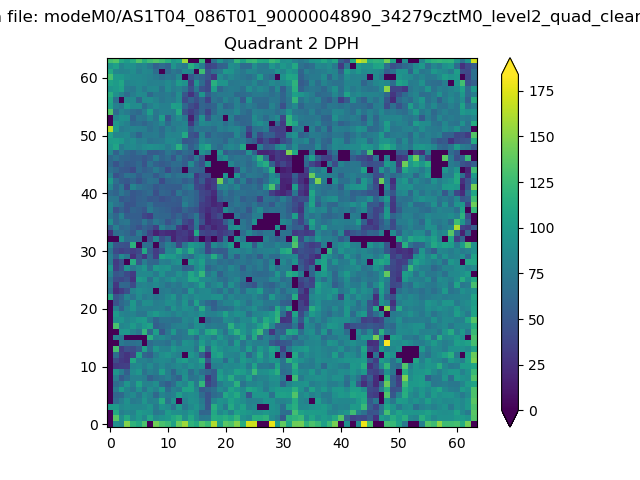
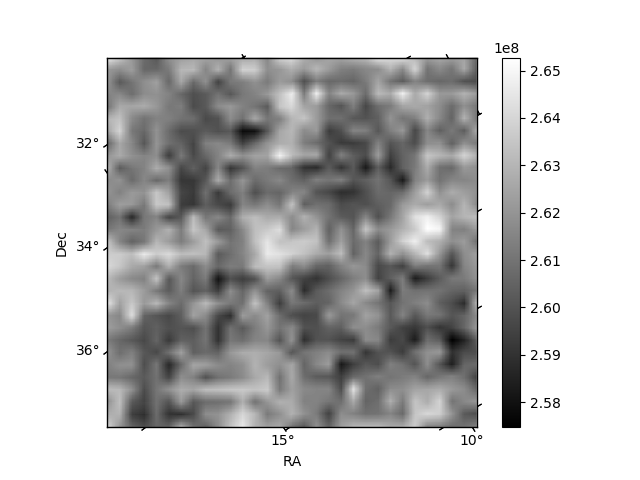
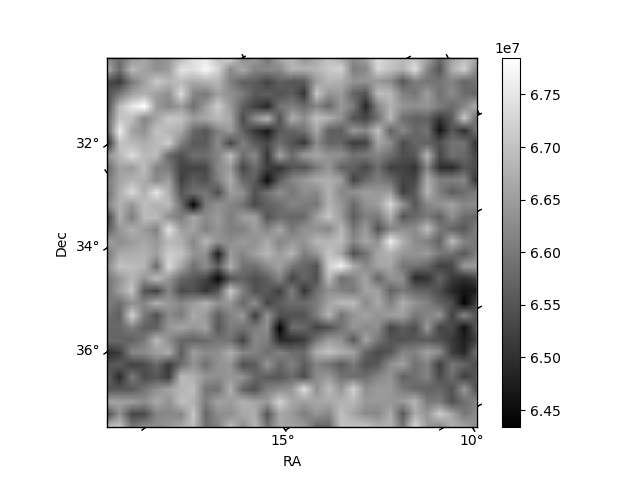
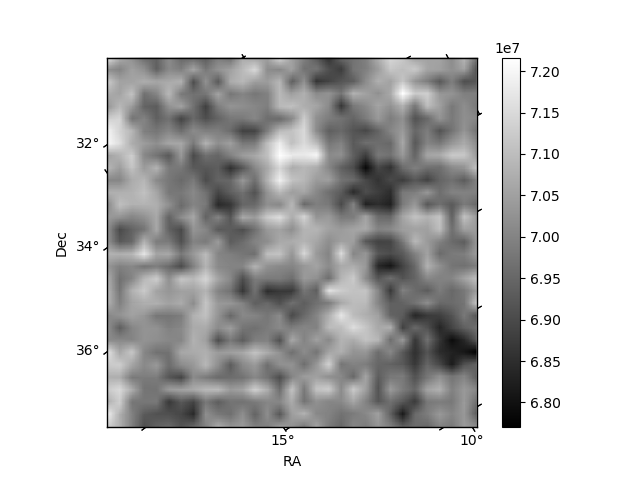
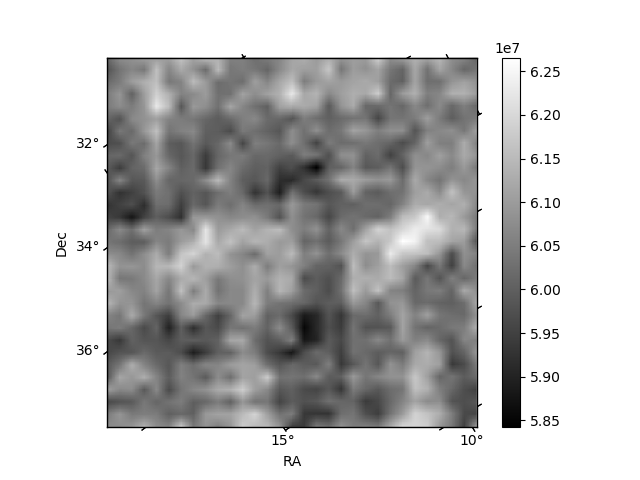
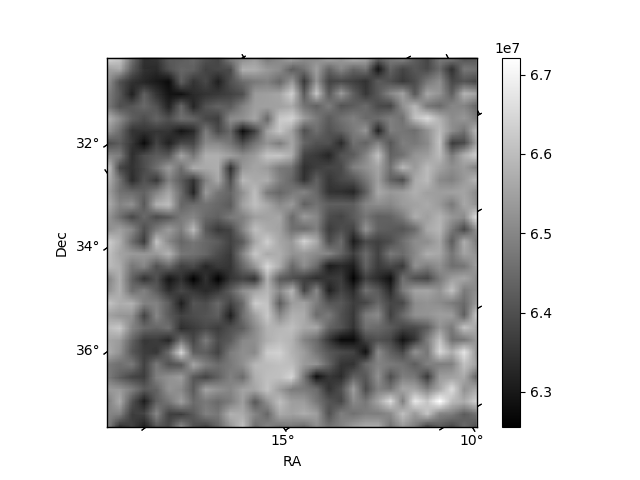
Histogram calculated using DETX and DETY for each event in the final _common_clean file
| Quadrant A | 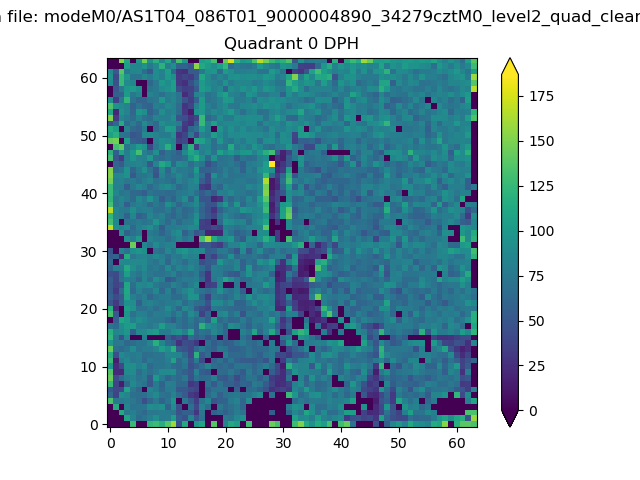 |
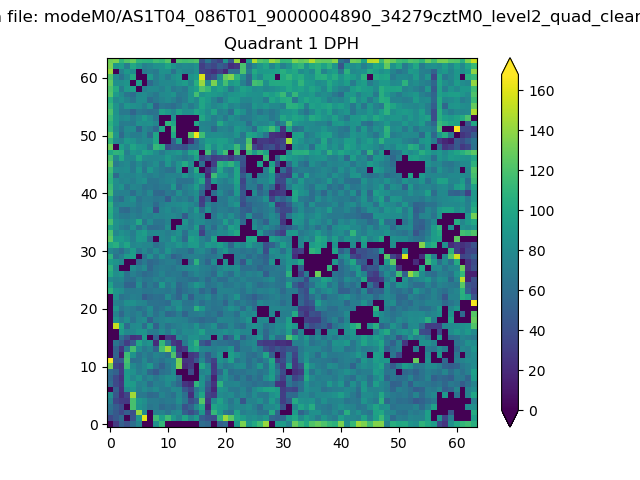 |
Quadrant B |
|---|---|---|---|
| Quadrant D | 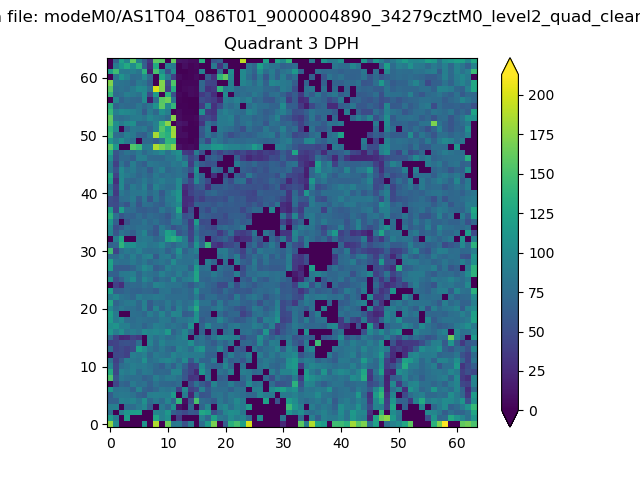 |
 |
Quadrant C |
| Plot type | Count rate plots | Images |
|---|---|---|
| Comparison with Poisson distribution Blue bars denote a histogram of data divided into 1 sec bins. Red curve is a Poisson curve with rate = median count rate of data. |
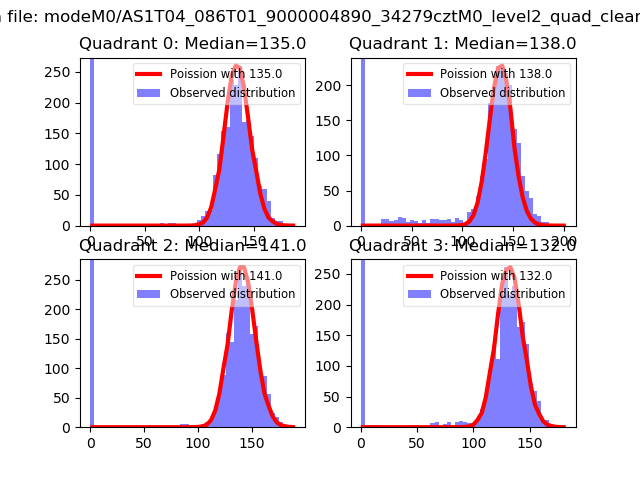 |
 |
| Quadrant-wise count rates Data is divided into 100 sec bins |
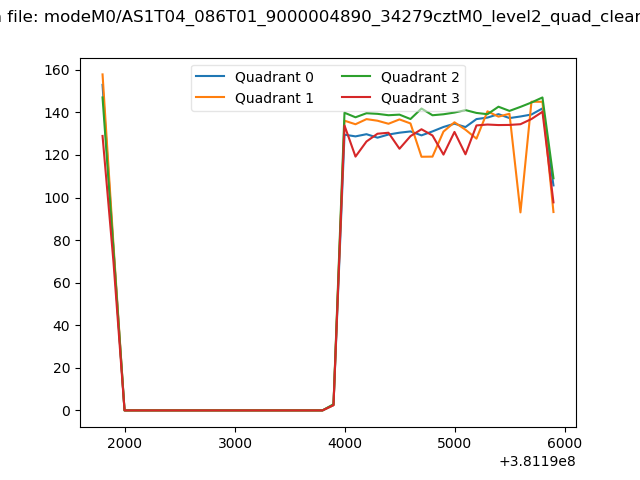 |
|
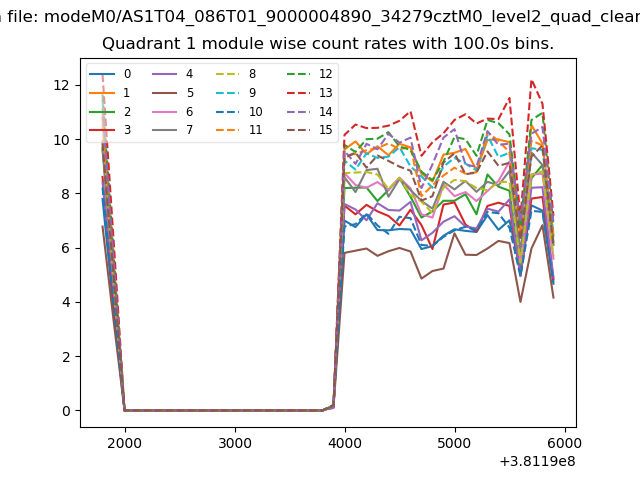
| Module-wise count rates for Quadrant A Data is divided into 100 sec bins |
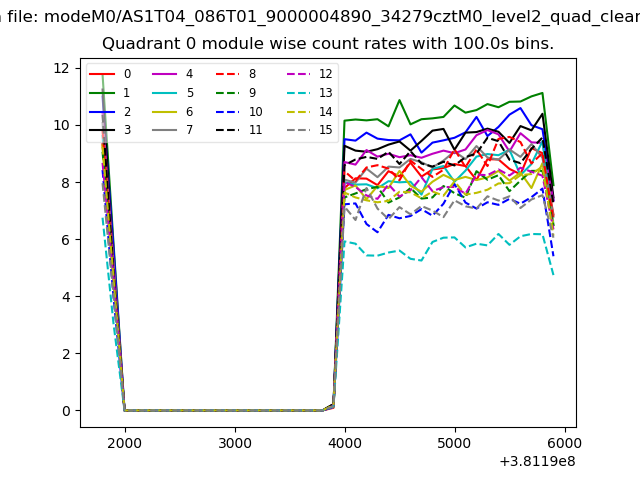 |
 |
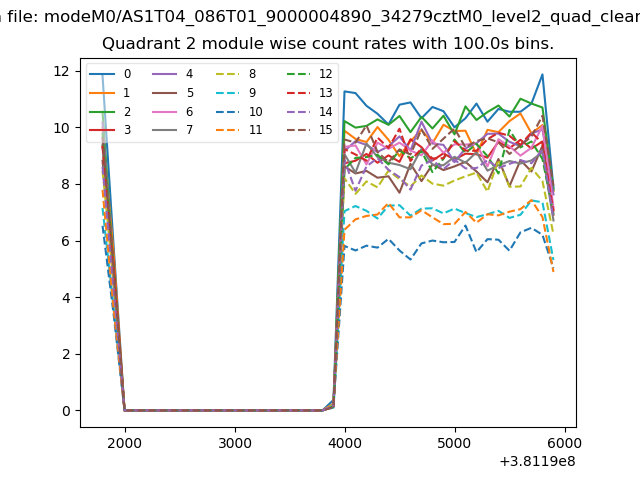
| Module-wise count rates for Quadrant B Data is divided into 100 sec bins |
 |
 |
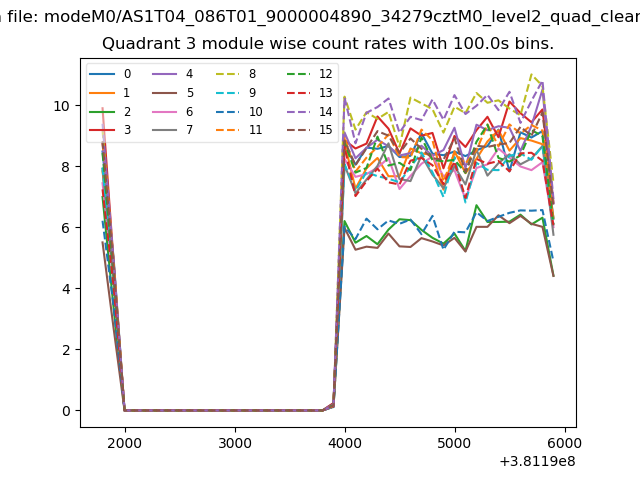
| Module-wise count rates for Quadrant C Data is divided into 100 sec bins |
 |
 |
| Module-wise count rates for Quadrant D Data is divided into 100 sec bins |
 |
 |
| Parameter | Plot |
|---|---|
| CZT HV Monitor | 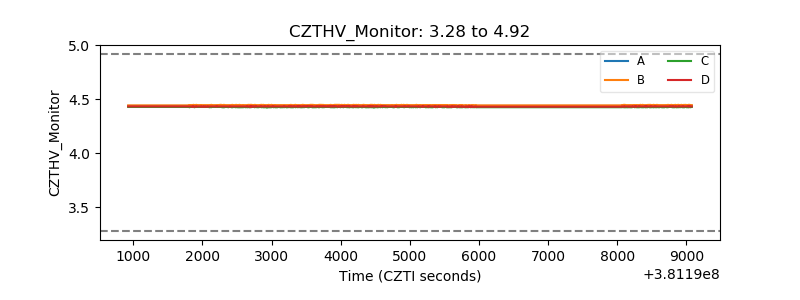 |
| D_VDD | 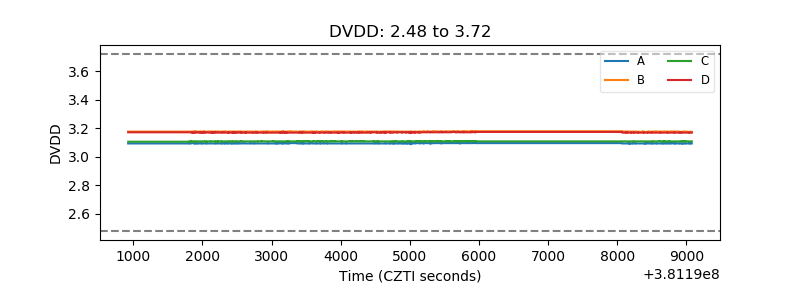 |
| Temperature 1 | 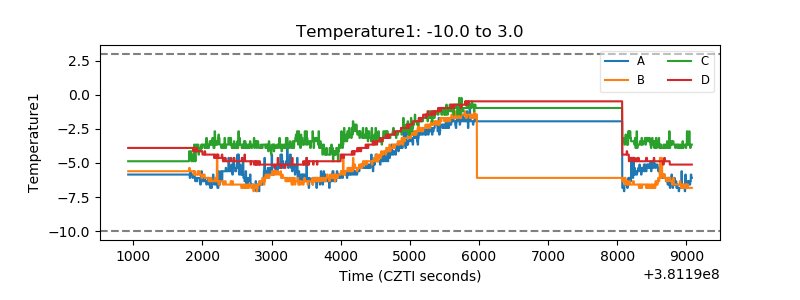 |
| Veto HV Monitor | 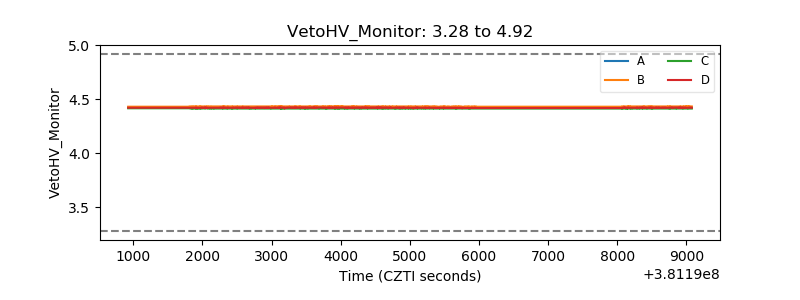 |
| Veto LLD | 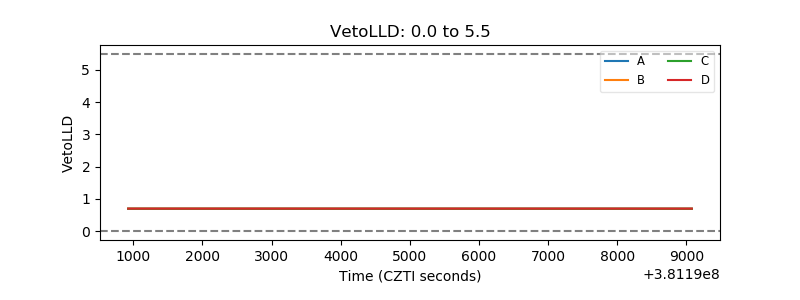 |
| Alpha Counter | 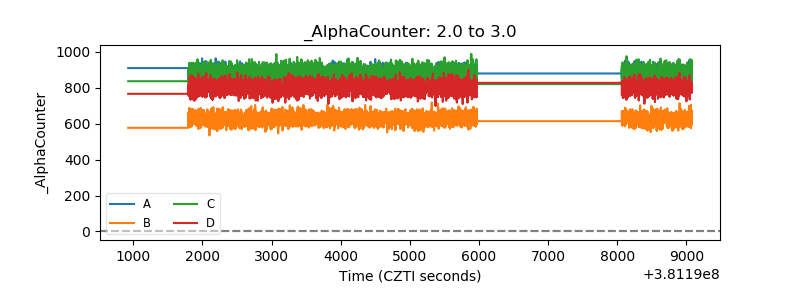 |
| _CPM_Rate | 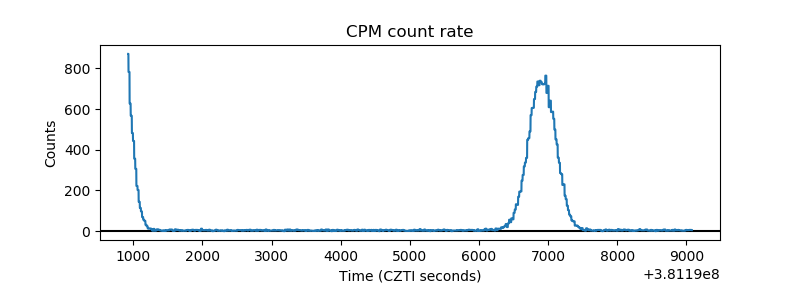 |
| CZT Counter | 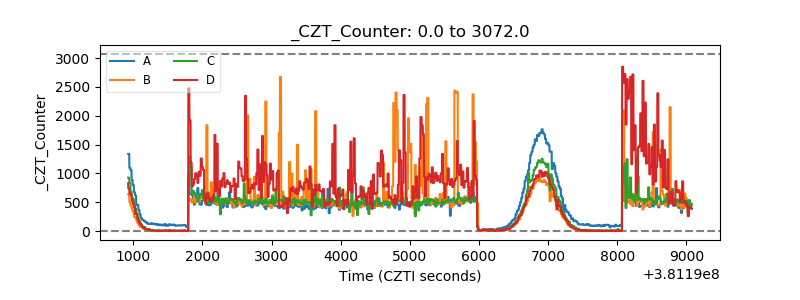 |
| +2.5 Volts monitor | 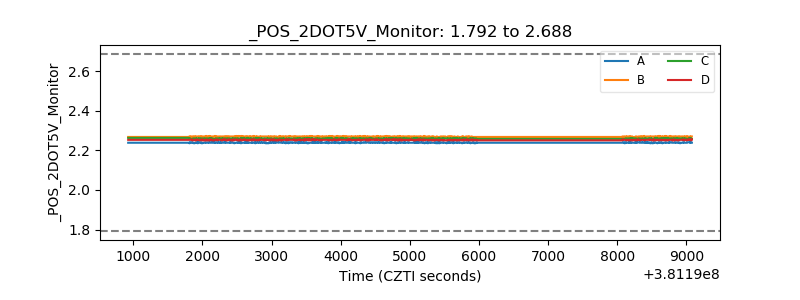 |
| +5 Volts monitor | 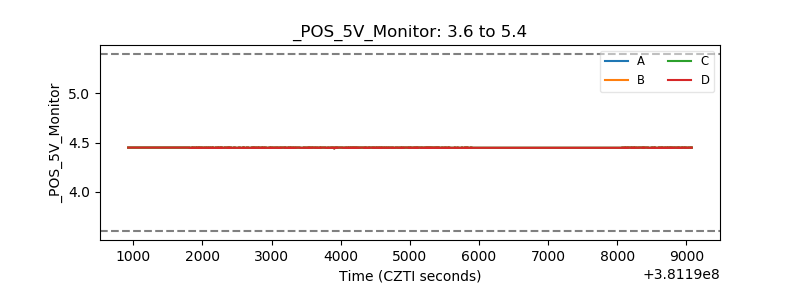 |
| _ROLL_ROT | 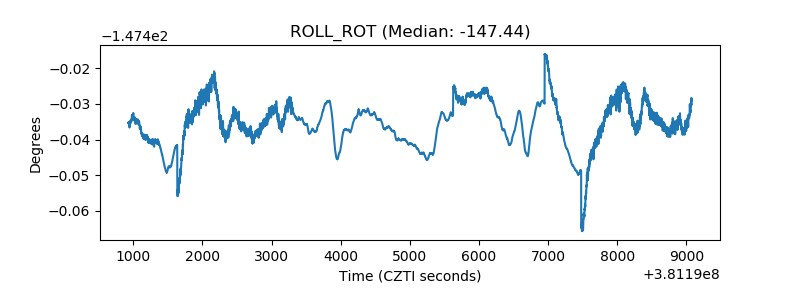 |
| _Roll_DEC | 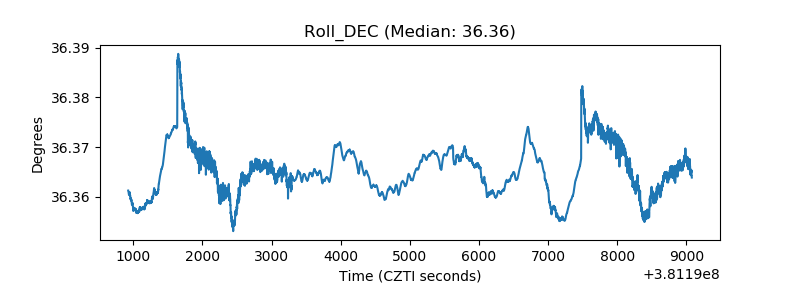 |
| _Roll_RA | 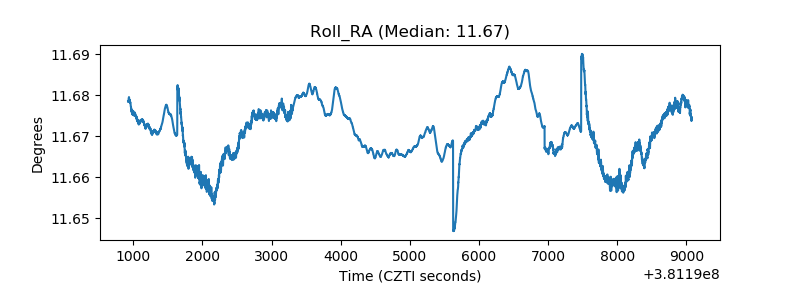 |
| Veto Counter | 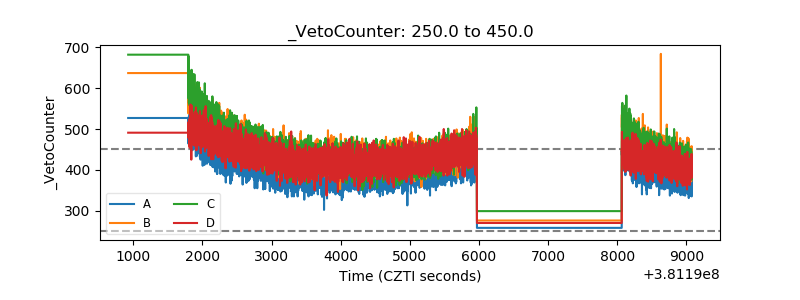 |