| Param | Original file | Final file |
|---|---|---|
| Filename | modeM0/AS1T04_086T01_9000004890_34278cztM0_level2.evt | modeM0/AS1T04_086T01_9000004890_34278cztM0_level2_quad_clean.evt |
| Size (bytes) | 482,823,360 | 53,637,120 |
| Size | 460.5 MB | 51.2 MB |
| Events in quadrant A | 2,589,957 | 321,253 |
| Events in quadrant B | 4,136,205 | 301,343 |
| Events in quadrant C | 3,187,938 | 330,847 |
| Events in quadrant D | 4,357,893 | 308,073 |
| Mode M0 | |||
|---|---|---|---|
| Quadrant | BADHDUFLAG | Total packets | Discarded packets |
| A | 0 | 10884 | 3 |
| B | 0 | 15531 | 2 |
| C | 0 | 12519 | 2 |
| D | 0 | 16640 | 2 |
| Mode SS | |||
|---|---|---|---|
| Quadrant | BADHDUFLAG | Total packets | Discarded packets |
| A | 0 | 104 | 0 |
| B | 0 | 104 | 0 |
| C | 0 | 104 | 0 |
| D | 0 | 104 | 0 |
| Mode M9 | |||
|---|---|---|---|
| Quadrant | BADHDUFLAG | Total packets | Discarded packets |
| A | 0 | 29 | 0 |
| B | 0 | 29 | 0 |
| C | 0 | 29 | 0 |
| D | 0 | 30 | 0 |
| Quadrant | Total seconds | Saturated seconds | Saturation percentage |
|---|---|---|---|
| A | 5172 | 6 | 0.116009% |
| B | 5172 | 573 | 11.078886% |
| C | 5172 | 76 | 1.469451% |
| D | 5172 | 166 | 3.209590% |
Noise dominated data is calculated using 1-second bins in cleaned event files. If a bin has >2000 counts, and if more than 50% of those come from <1% of pixels, then it is considered to be noise-dominated and hence unusable.
| Quadrant | # 1 sec bins | Bins with >0 counts | Bins with >2000 counts | High rate bins dominated by noise | Noise dominated (total time) | Noise dominated (detector-on time) | Marked lightcurve |
|---|---|---|---|---|---|---|---|
| A | 7295 | 5173 | 0 | 0 | 0.00% | 0.00% | 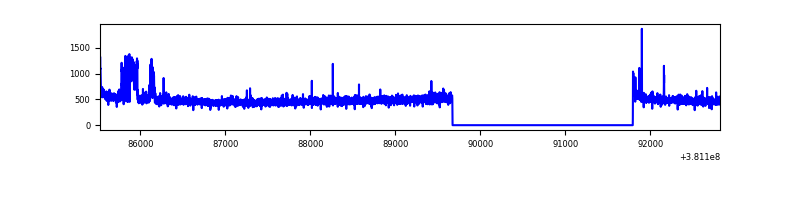 |
| B | 7295 | 5173 | 379 | 379 | 5.20% | 7.33% | 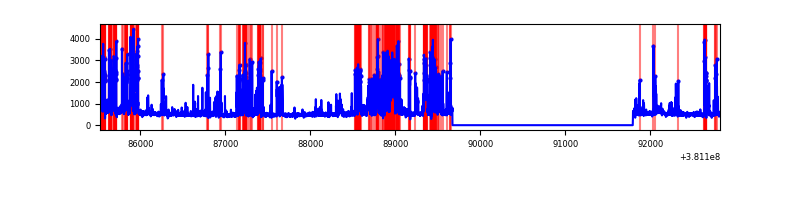 |
| C | 7295 | 5173 | 54 | 54 | 0.74% | 1.04% | 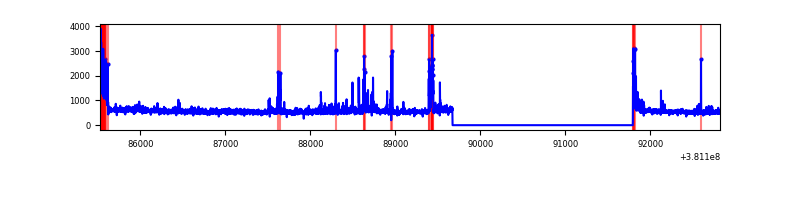 |
| D | 7295 | 5173 | 140 | 140 | 1.92% | 2.71% | 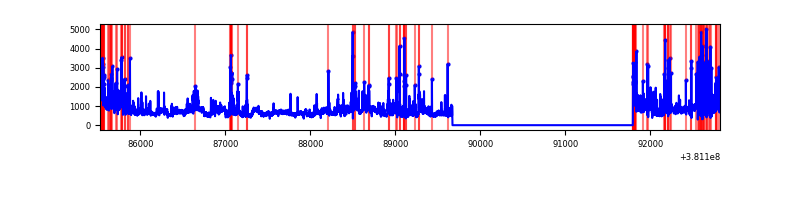 |
Top three noisy pixels from each quadrant. If the there are fewer than three noisy pixels in the level2.evt file, extra rows are filled as -1
| Pixel properties | Quadrant properties | ||||||
|---|---|---|---|---|---|---|---|
| Quadrant | DetID | PixID | Counts | Sigma | Mean | Median | Sigma |
| A | 15 | 47 | 101086 | 798.99 | 632 | 621 | 125.7 |
| A | 10 | 83 | 25737 | 199.74 | 632 | 621 | 125.7 |
| A | 9 | 143 | 11346 | 85.29 | 632 | 621 | 125.7 |
| B | 5 | 172 | 1556656 | 13397.76 | 612 | 597 | 116.1 |
| B | 0 | 229 | 102249 | 875.23 | 612 | 597 | 116.1 |
| B | 0 | 182 | 25488 | 214.31 | 612 | 597 | 116.1 |
| C | 15 | 214 | 226332 | 1553.08 | 632 | 639 | 145.3 |
| C | 14 | 254 | 186682 | 1280.24 | 632 | 639 | 145.3 |
| C | 0 | 10 | 162806 | 1115.94 | 632 | 639 | 145.3 |
| D | 8 | 195 | 768244 | 4687.37 | 615 | 602 | 163.8 |
| D | 12 | 235 | 527263 | 3215.9 | 615 | 602 | 163.8 |
| D | 7 | 80 | 190980 | 1162.49 | 615 | 602 | 163.8 |
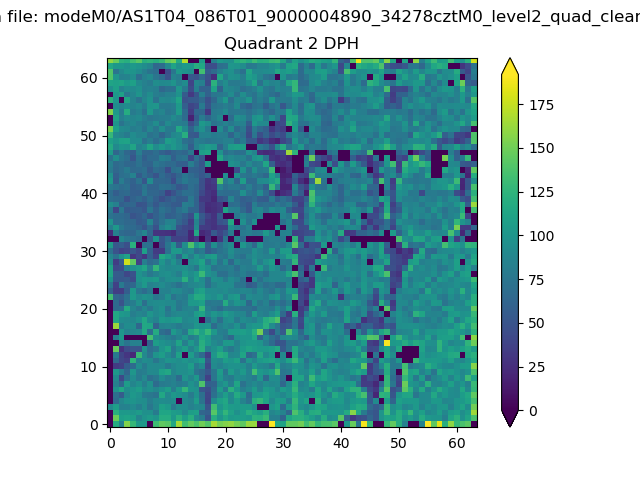
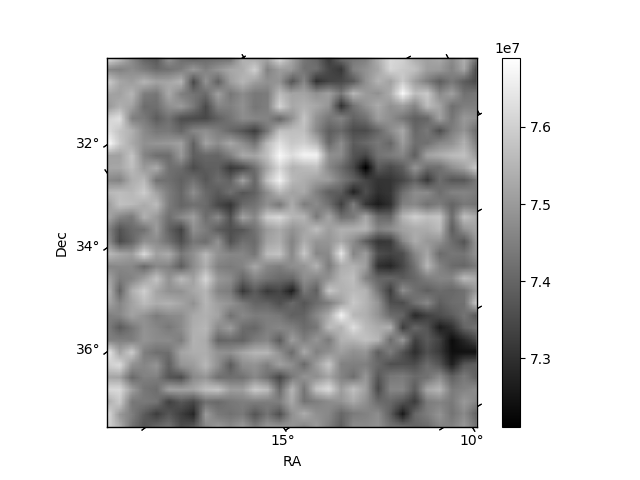
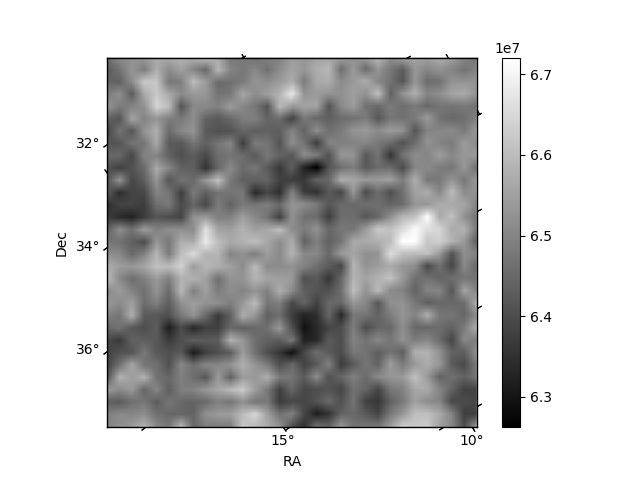
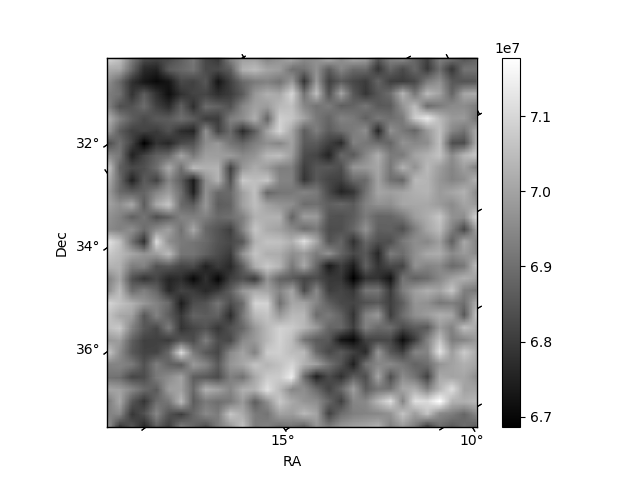
Histogram calculated using DETX and DETY for each event in the final _common_clean file
| Quadrant A | 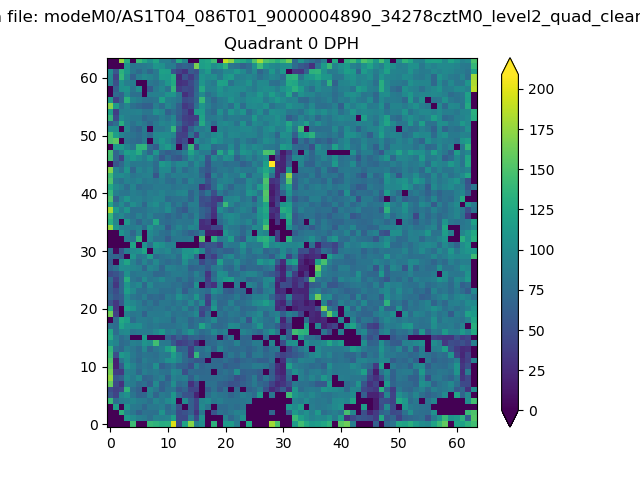 |
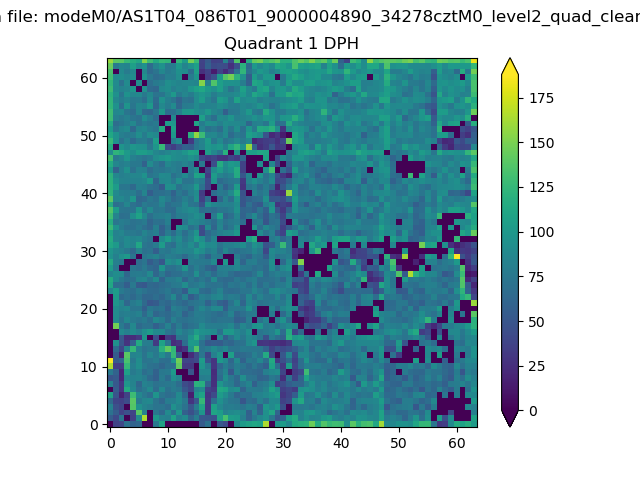 |
Quadrant B |
|---|---|---|---|
| Quadrant D | 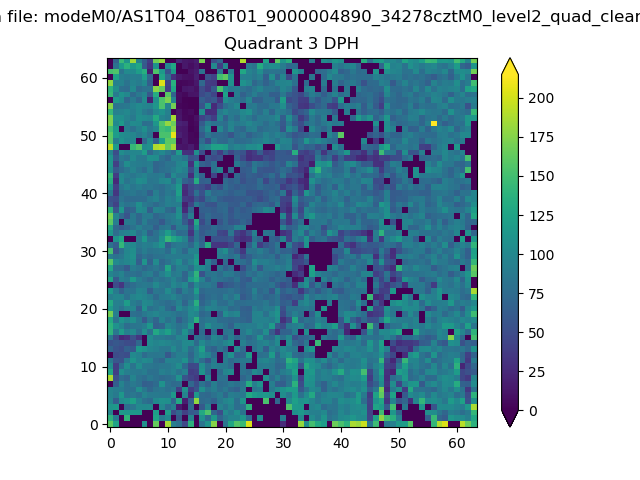 |
 |
Quadrant C |
| Plot type | Count rate plots | Images |
|---|---|---|
| Comparison with Poisson distribution Blue bars denote a histogram of data divided into 1 sec bins. Red curve is a Poisson curve with rate = median count rate of data. |
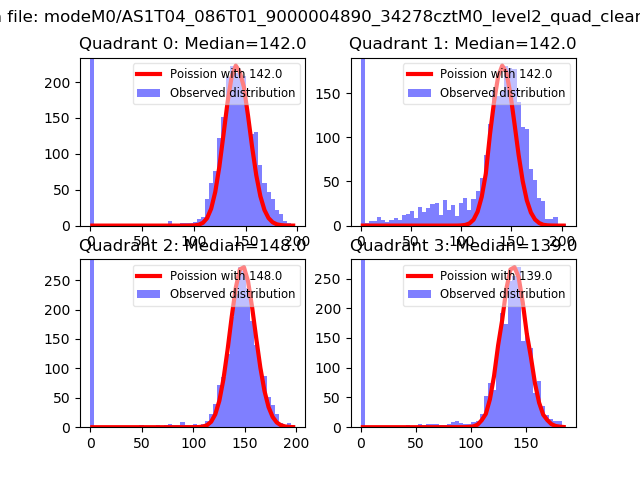 |
 |
| Quadrant-wise count rates Data is divided into 100 sec bins |
 |
|
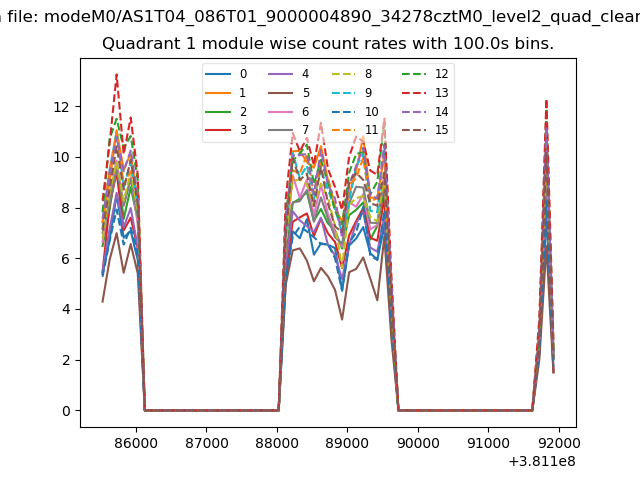
| Module-wise count rates for Quadrant A Data is divided into 100 sec bins |
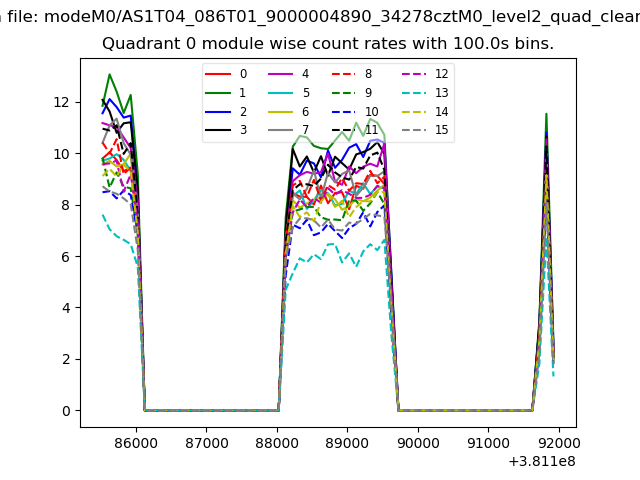 |
 |
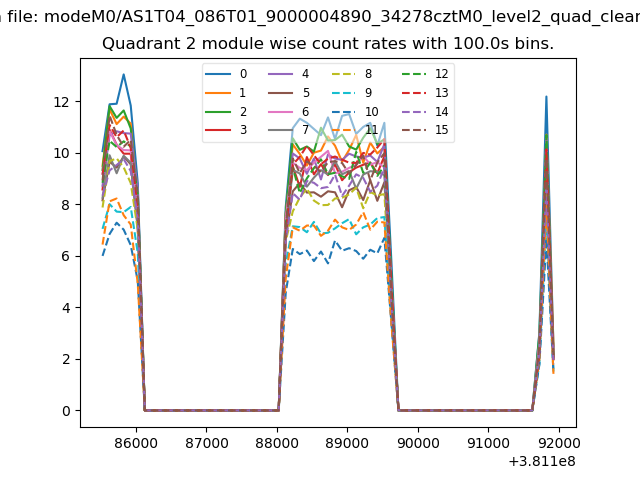
| Module-wise count rates for Quadrant B Data is divided into 100 sec bins |
 |
 |
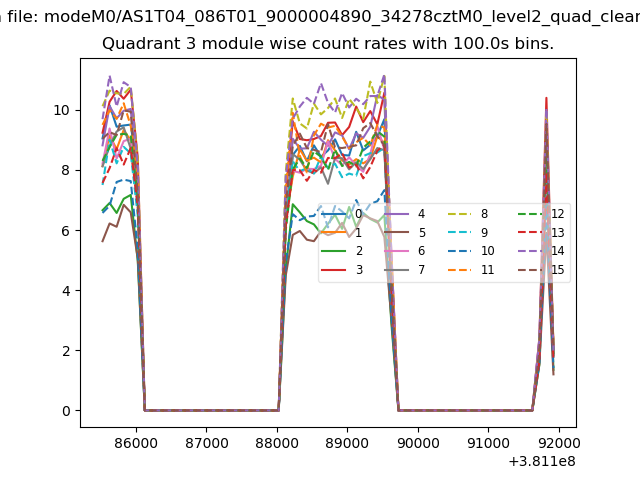
| Module-wise count rates for Quadrant C Data is divided into 100 sec bins |
 |
 |
| Module-wise count rates for Quadrant D Data is divided into 100 sec bins |
 |
 |
| Parameter | Plot |
|---|---|
| CZT HV Monitor | 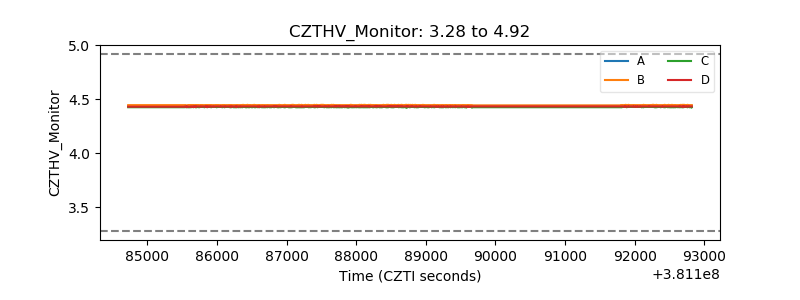 |
| D_VDD | 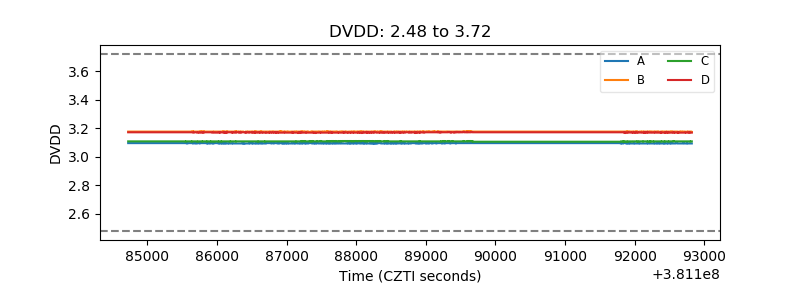 |
| Temperature 1 | 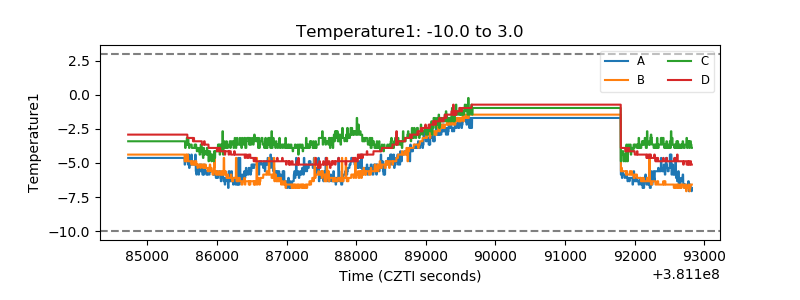 |
| Veto HV Monitor | 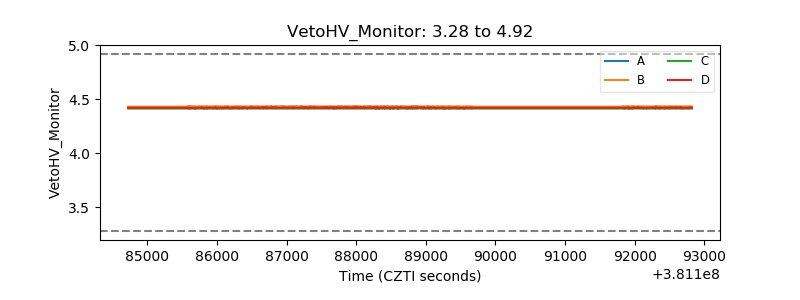 |
| Veto LLD | 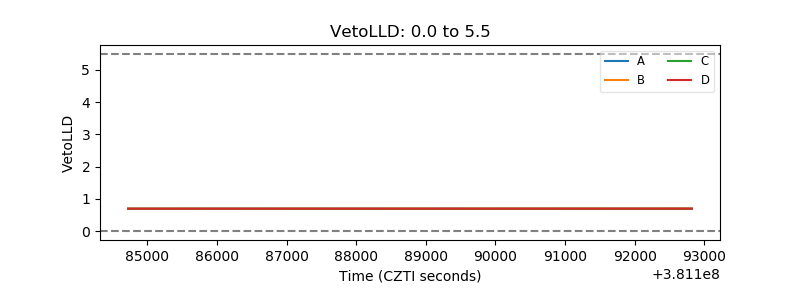 |
| Alpha Counter | 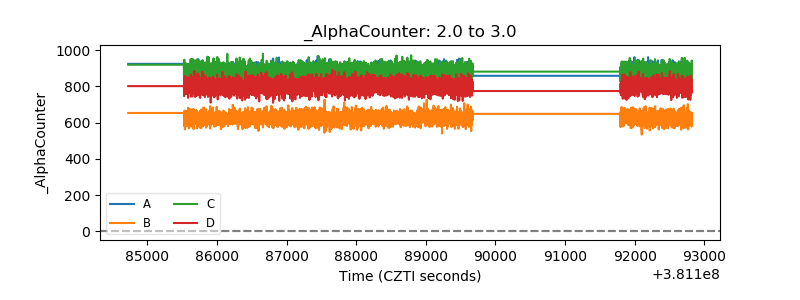 |
| _CPM_Rate | 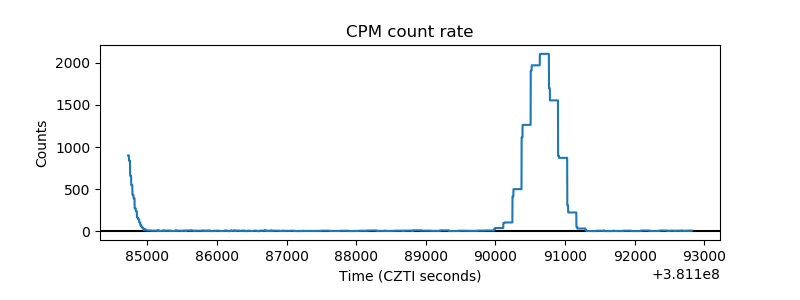 |
| CZT Counter | 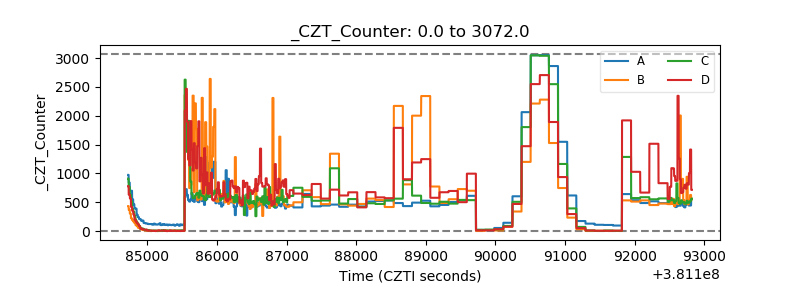 |
| +2.5 Volts monitor | 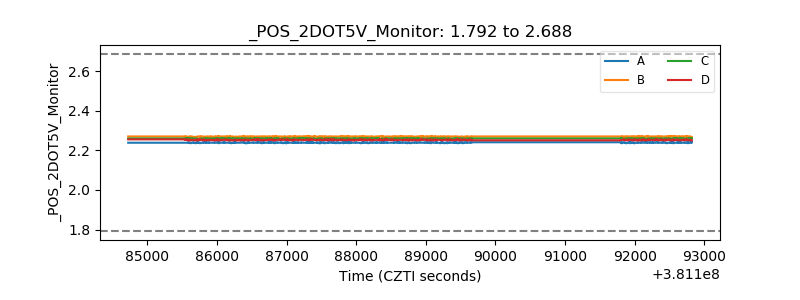 |
| +5 Volts monitor | 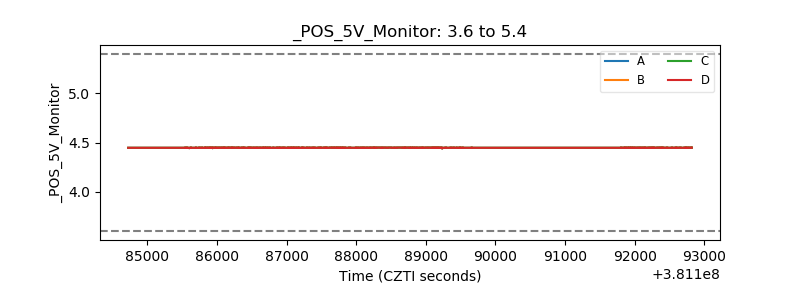 |
| _ROLL_ROT | 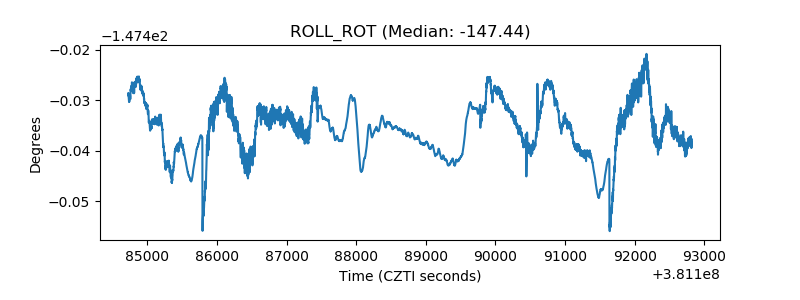 |
| _Roll_DEC | 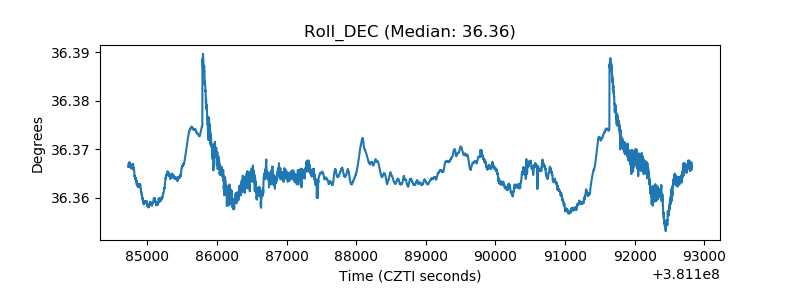 |
| _Roll_RA | 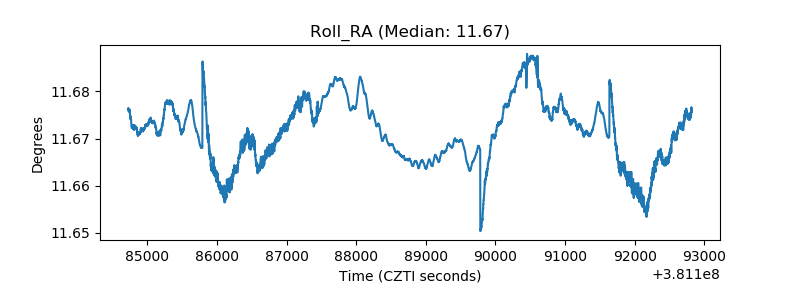 |
| Veto Counter | 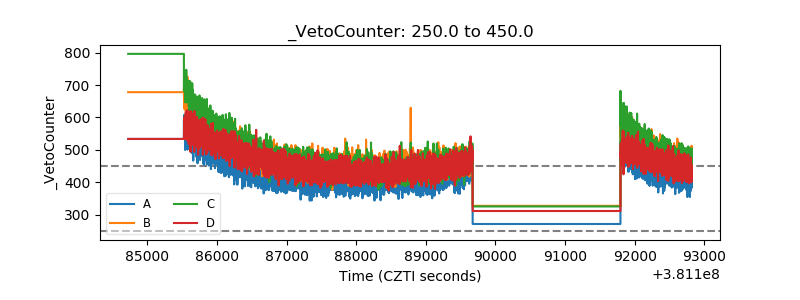 |