| Param | Original file | Final file |
|---|---|---|
| Filename | modeM0/AS1T04_086T01_9000004890_34276cztM0_level2.evt | modeM0/AS1T04_086T01_9000004890_34276cztM0_level2_quad_clean.evt |
| Size (bytes) | 425,704,320 | 71,190,720 |
| Size | 406.0 MB | 67.9 MB |
| Events in quadrant A | 2,496,235 | 454,699 |
| Events in quadrant B | 3,129,657 | 458,400 |
| Events in quadrant C | 2,838,878 | 462,859 |
| Events in quadrant D | 4,080,021 | 420,776 |
| Mode M0 | |||
|---|---|---|---|
| Quadrant | BADHDUFLAG | Total packets | Discarded packets |
| A | 0 | 10554 | 3 |
| B | 0 | 12396 | 2 |
| C | 0 | 11321 | 2 |
| D | 0 | 15517 | 2 |
| Mode SS | |||
|---|---|---|---|
| Quadrant | BADHDUFLAG | Total packets | Discarded packets |
| A | 0 | 104 | 0 |
| B | 0 | 104 | 0 |
| C | 0 | 104 | 0 |
| D | 0 | 104 | 0 |
| Mode M9 | |||
|---|---|---|---|
| Quadrant | BADHDUFLAG | Total packets | Discarded packets |
| A | 0 | 28 | 0 |
| B | 0 | 28 | 0 |
| C | 0 | 28 | 0 |
| D | 0 | 29 | 0 |
| Quadrant | Total seconds | Saturated seconds | Saturation percentage |
|---|---|---|---|
| A | 5121 | 13 | 0.253857% |
| B | 5121 | 167 | 3.261082% |
| C | 5121 | 20 | 0.390549% |
| D | 5121 | 272 | 5.311463% |
Noise dominated data is calculated using 1-second bins in cleaned event files. If a bin has >2000 counts, and if more than 50% of those come from <1% of pixels, then it is considered to be noise-dominated and hence unusable.
| Quadrant | # 1 sec bins | Bins with >0 counts | Bins with >2000 counts | High rate bins dominated by noise | Noise dominated (total time) | Noise dominated (detector-on time) | Marked lightcurve |
|---|---|---|---|---|---|---|---|
| A | 7095 | 5122 | 2 | 2 | 0.03% | 0.04% | 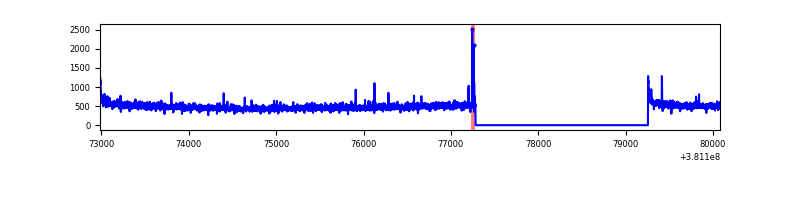 |
| B | 7095 | 5122 | 125 | 125 | 1.76% | 2.44% | 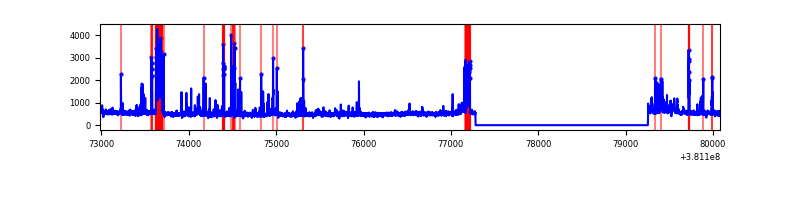 |
| C | 7095 | 5122 | 11 | 11 | 0.16% | 0.21% | 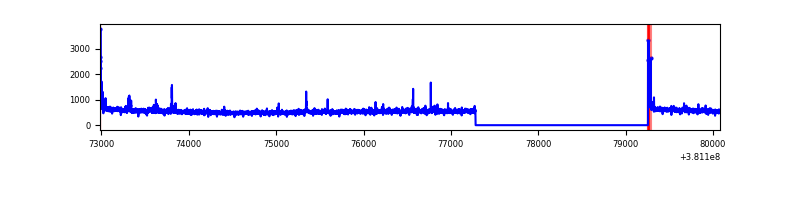 |
| D | 7095 | 5122 | 274 | 274 | 3.86% | 5.35% | 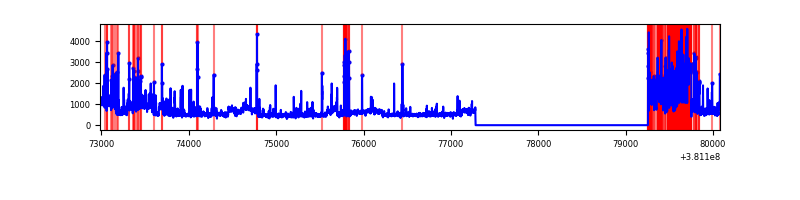 |
Top three noisy pixels from each quadrant. If the there are fewer than three noisy pixels in the level2.evt file, extra rows are filled as -1
| Pixel properties | Quadrant properties | ||||||
|---|---|---|---|---|---|---|---|
| Quadrant | DetID | PixID | Counts | Sigma | Mean | Median | Sigma |
| A | 10 | 83 | 27101 | 210.99 | 630 | 619 | 125.5 |
| A | 9 | 143 | 24203 | 187.9 | 630 | 619 | 125.5 |
| A | 13 | 6 | 9438 | 70.26 | 630 | 619 | 125.5 |
| B | 5 | 172 | 408854 | 3513.23 | 626 | 611 | 116.2 |
| B | 15 | 201 | 84782 | 724.35 | 626 | 611 | 116.2 |
| B | 0 | 182 | 55706 | 474.13 | 626 | 611 | 116.2 |
| C | 15 | 214 | 221381 | 1532.1 | 630 | 637 | 144.1 |
| C | 0 | 10 | 57715 | 396.16 | 630 | 637 | 144.1 |
| C | 14 | 254 | 43521 | 297.64 | 630 | 637 | 144.1 |
| D | 7 | 223 | 677630 | 4594.48 | 612 | 599 | 147.4 |
| D | 8 | 195 | 574348 | 3893.58 | 612 | 599 | 147.4 |
| D | 2 | 250 | 120943 | 816.68 | 612 | 599 | 147.4 |
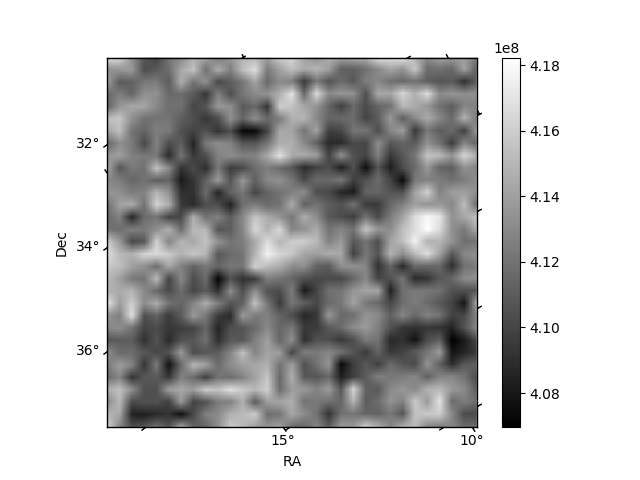
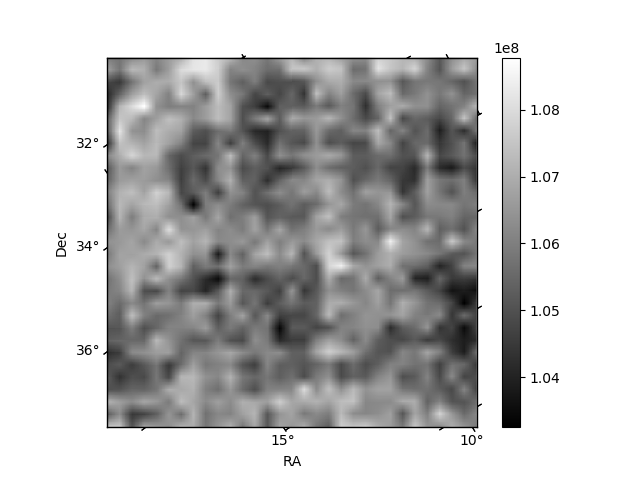
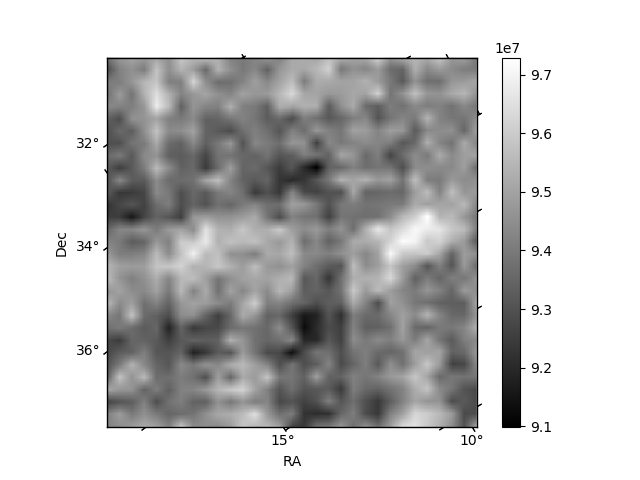
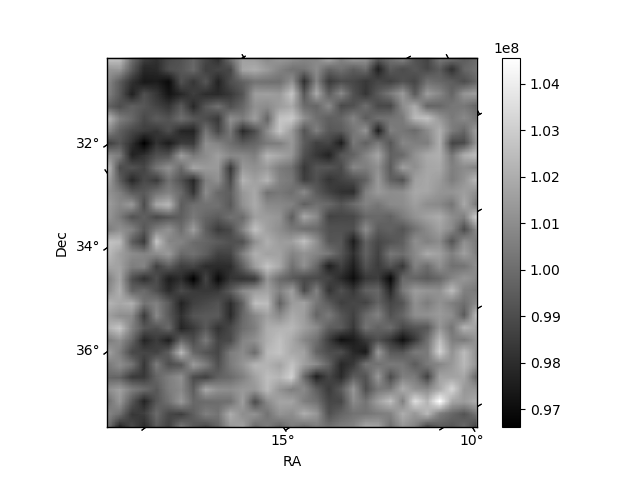
Histogram calculated using DETX and DETY for each event in the final _common_clean file
| Quadrant A | 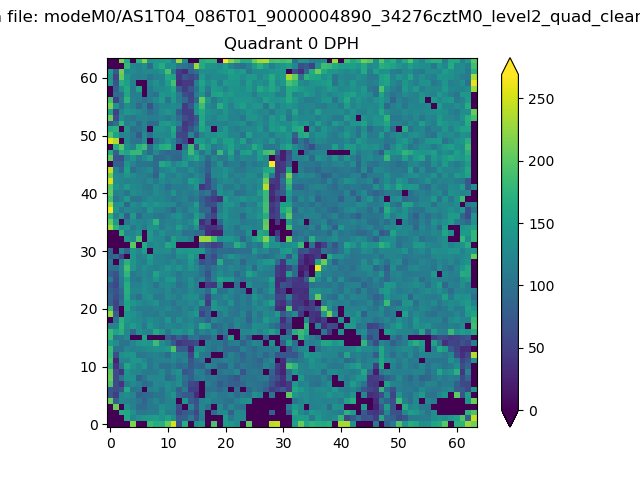 |
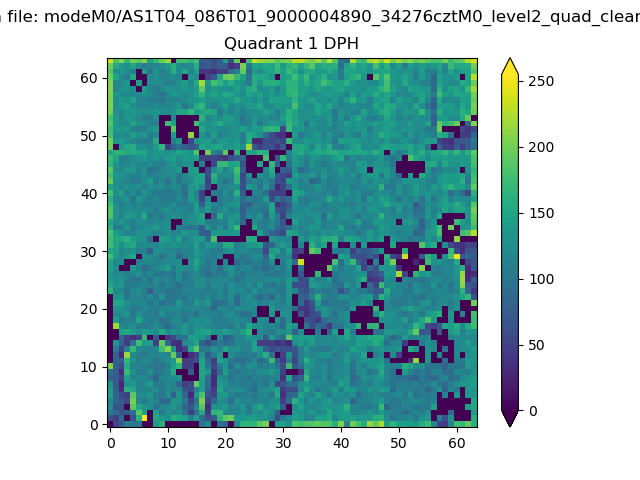 |
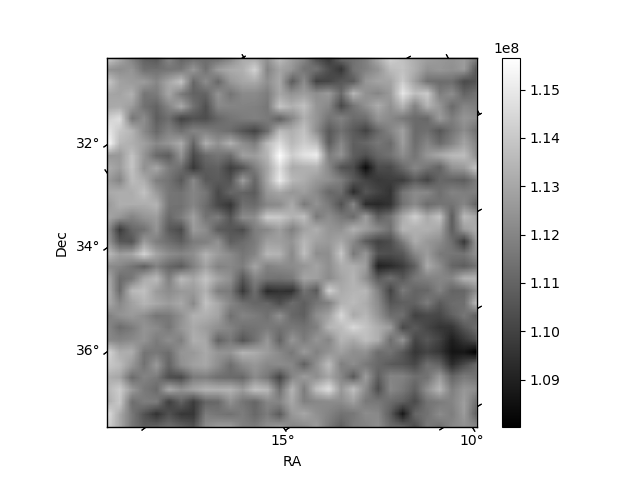
Quadrant B |
|---|---|---|---|
| Quadrant D | 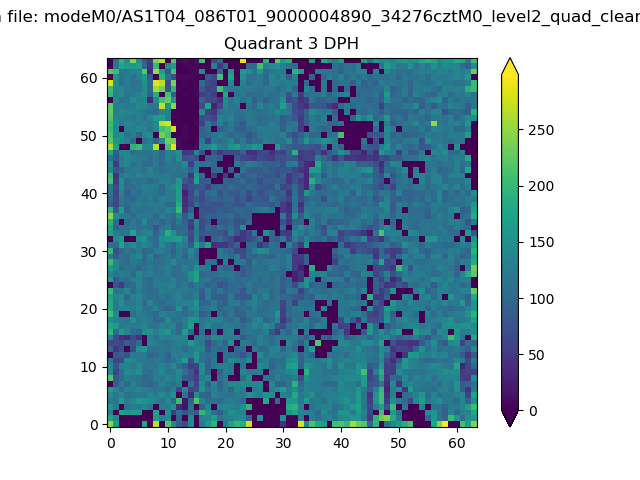 |
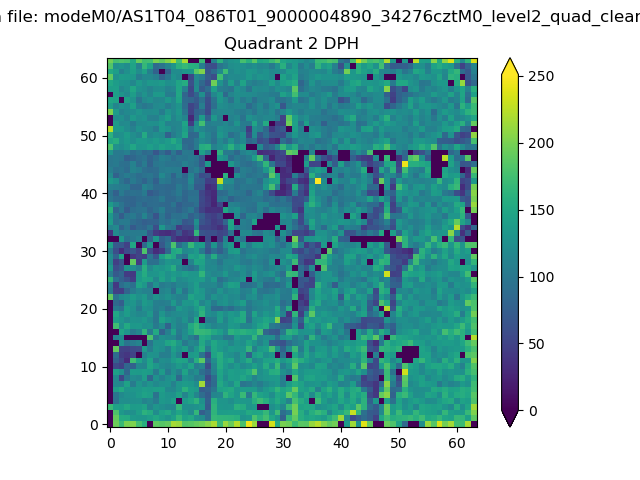 |
Quadrant C |
| Plot type | Count rate plots | Images |
|---|---|---|
| Comparison with Poisson distribution Blue bars denote a histogram of data divided into 1 sec bins. Red curve is a Poisson curve with rate = median count rate of data. |
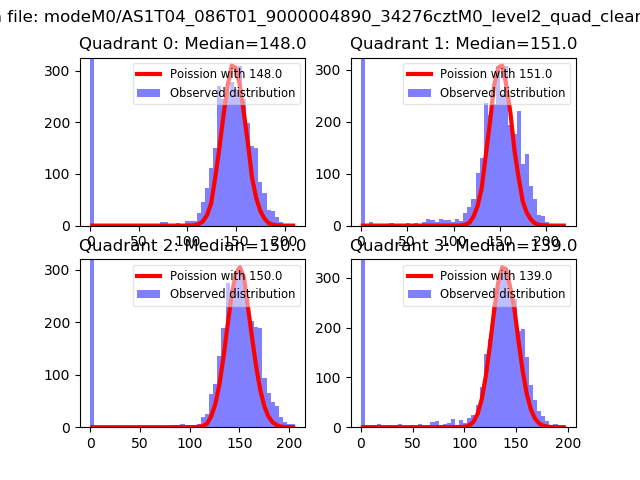 |
 |
| Quadrant-wise count rates Data is divided into 100 sec bins |
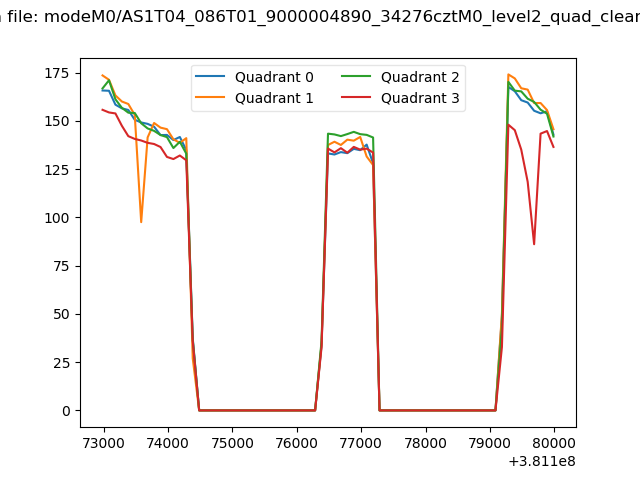 |
|
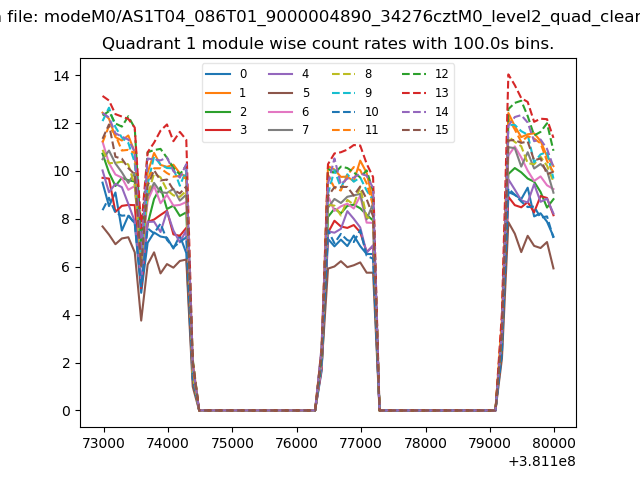
| Module-wise count rates for Quadrant A Data is divided into 100 sec bins |
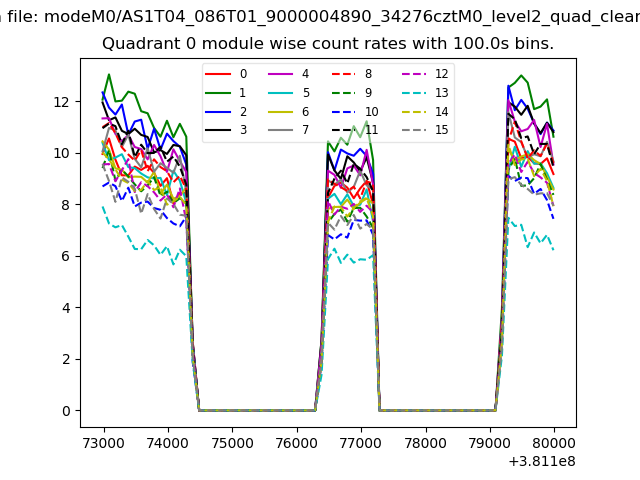 |
 |
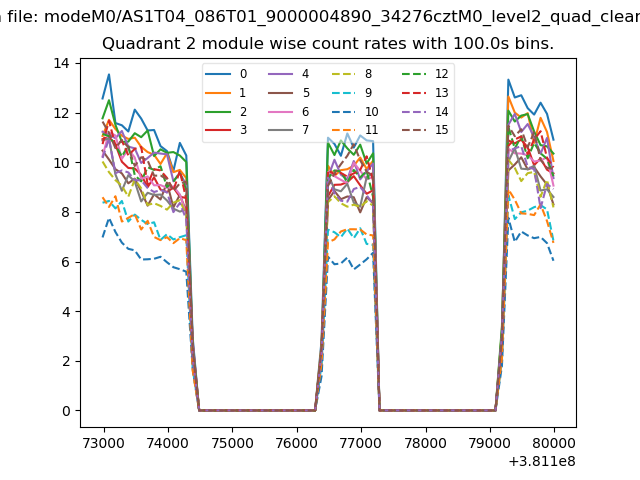
| Module-wise count rates for Quadrant B Data is divided into 100 sec bins |
 |
 |
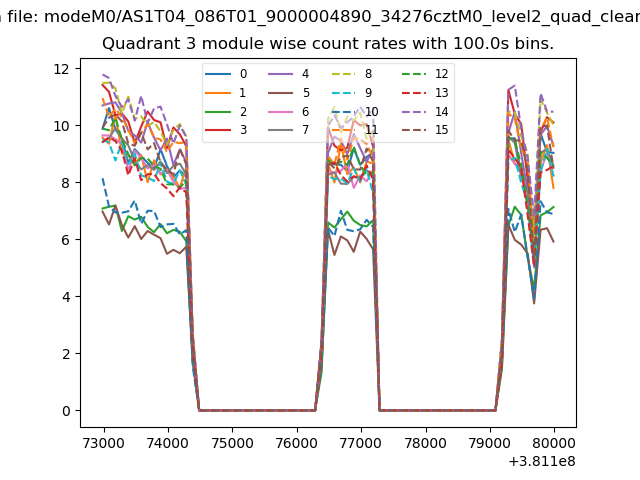
| Module-wise count rates for Quadrant C Data is divided into 100 sec bins |
 |
 |
| Module-wise count rates for Quadrant D Data is divided into 100 sec bins |
 |
 |
| Parameter | Plot |
|---|---|
| CZT HV Monitor | 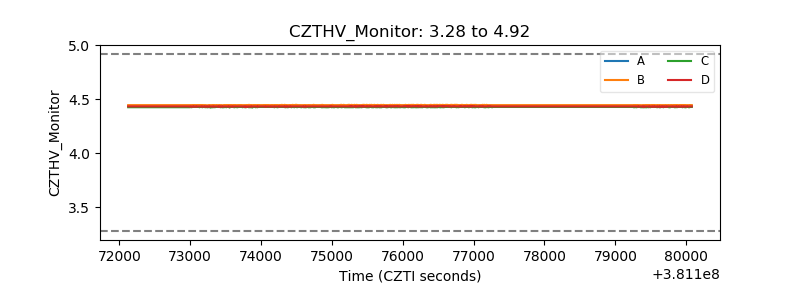 |
| D_VDD | 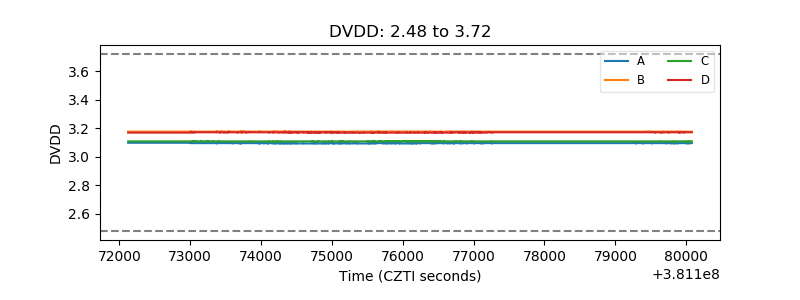 |
| Temperature 1 | 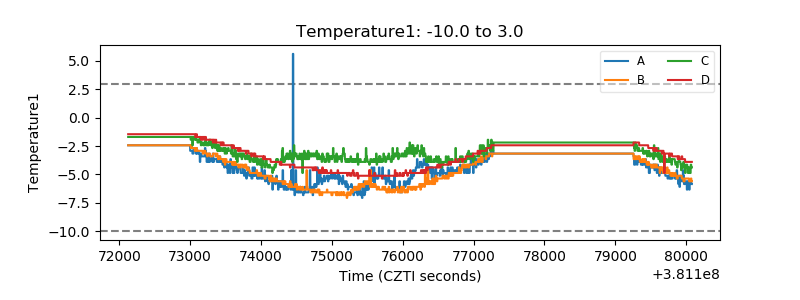 |
| Veto HV Monitor | 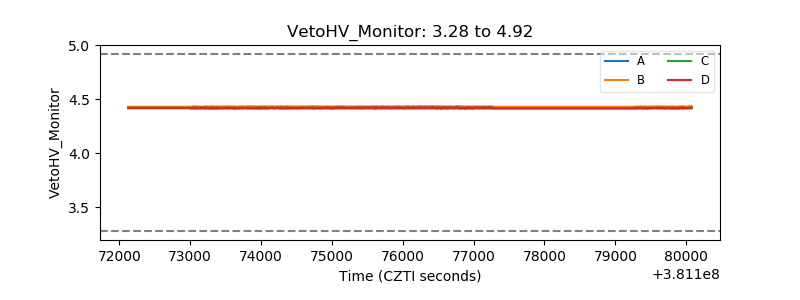 |
| Veto LLD | 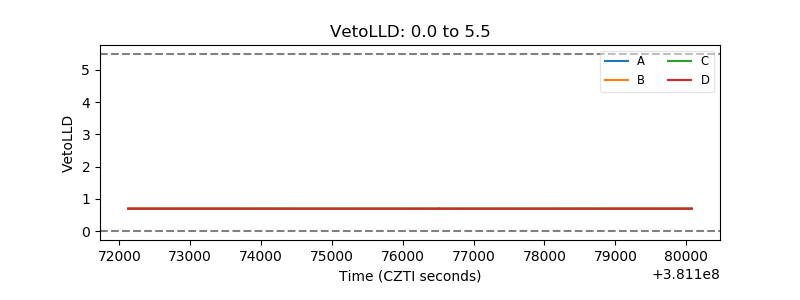 |
| Alpha Counter | 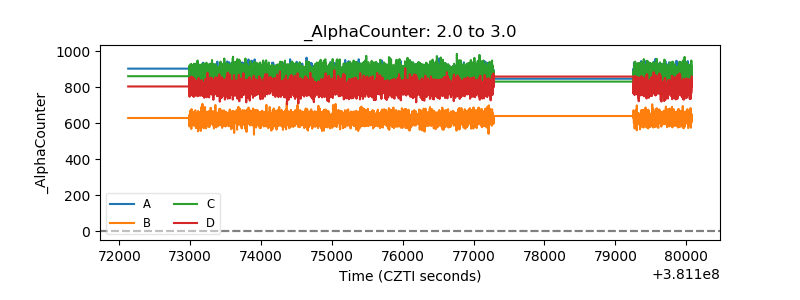 |
| _CPM_Rate | 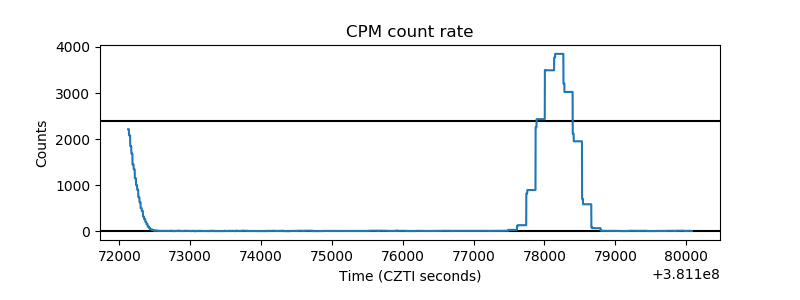 |
| CZT Counter | 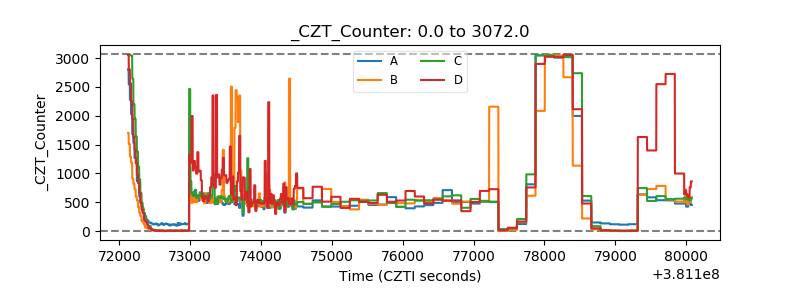 |
| +2.5 Volts monitor | 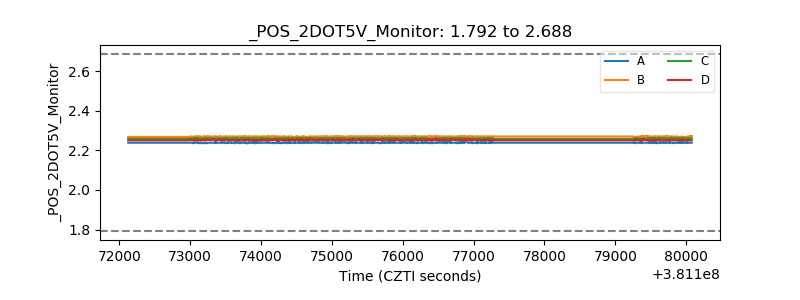 |
| +5 Volts monitor | 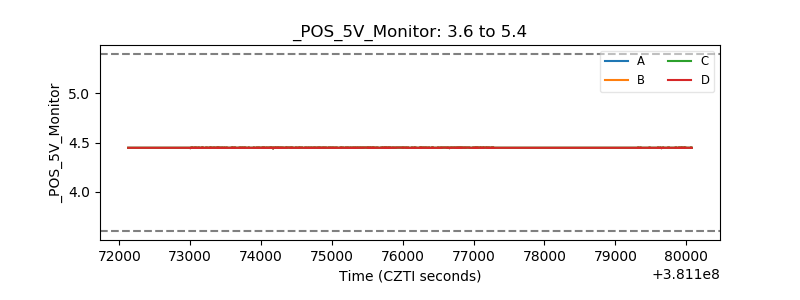 |
| _ROLL_ROT | 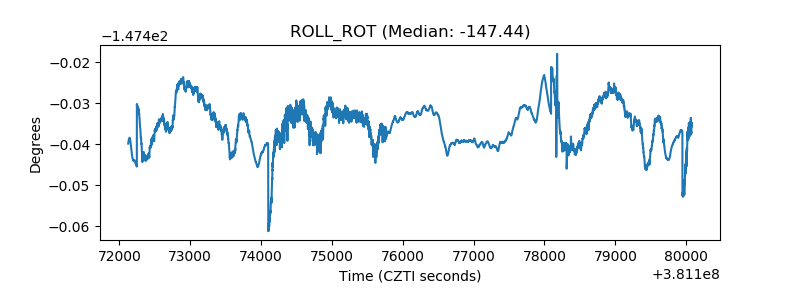 |
| _Roll_DEC | 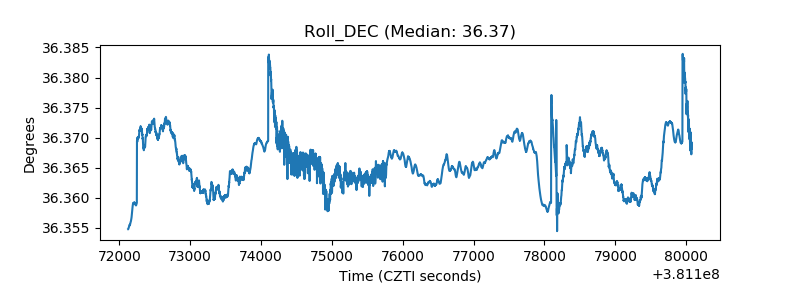 |
| _Roll_RA | 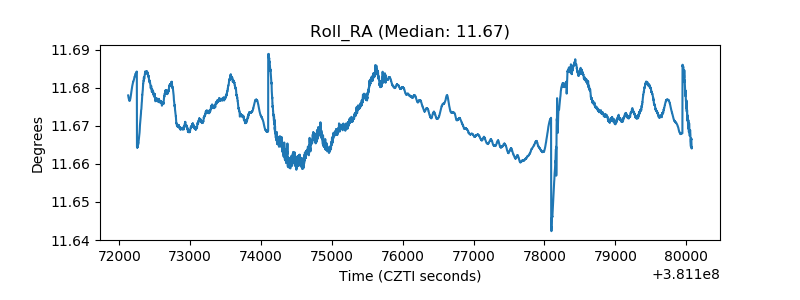 |
| Veto Counter | 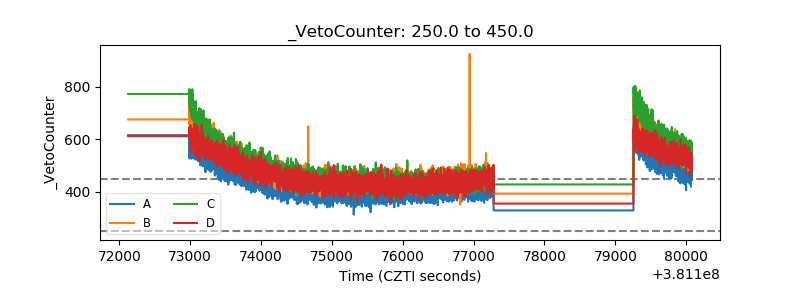 |