| Param | Original file | Final file |
|---|---|---|
| Filename | modeM0/AS1T04_086T01_9000004890_34273cztM0_level2.evt | modeM0/AS1T04_086T01_9000004890_34273cztM0_level2_quad_clean.evt |
| Size (bytes) | 489,499,200 | 72,587,520 |
| Size | 466.8 MB | 69.2 MB |
| Events in quadrant A | 2,518,684 | 465,430 |
| Events in quadrant B | 4,053,908 | 451,514 |
| Events in quadrant C | 2,923,999 | 467,685 |
| Events in quadrant D | 4,952,170 | 425,568 |
| Mode M0 | |||
|---|---|---|---|
| Quadrant | BADHDUFLAG | Total packets | Discarded packets |
| A | 0 | 11211 | 2 |
| B | 0 | 15538 | 1 |
| C | 0 | 11822 | 1 |
| D | 0 | 18406 | 1 |
| Mode SS | |||
|---|---|---|---|
| Quadrant | BADHDUFLAG | Total packets | Discarded packets |
| A | 0 | 112 | 0 |
| B | 0 | 112 | 0 |
| C | 0 | 112 | 0 |
| D | 0 | 112 | 0 |
| Mode M9 | |||
|---|---|---|---|
| Quadrant | BADHDUFLAG | Total packets | Discarded packets |
| A | 0 | 17 | 0 |
| B | 0 | 17 | 0 |
| C | 0 | 17 | 0 |
| D | 0 | 17 | 0 |
| Quadrant | Total seconds | Saturated seconds | Saturation percentage |
|---|---|---|---|
| A | 5542 | 4 | 0.072176% |
| B | 5542 | 363 | 6.549982% |
| C | 5542 | 37 | 0.667629% |
| D | 5542 | 452 | 8.155900% |
Noise dominated data is calculated using 1-second bins in cleaned event files. If a bin has >2000 counts, and if more than 50% of those come from <1% of pixels, then it is considered to be noise-dominated and hence unusable.
| Quadrant | # 1 sec bins | Bins with >0 counts | Bins with >2000 counts | High rate bins dominated by noise | Noise dominated (total time) | Noise dominated (detector-on time) | Marked lightcurve |
|---|---|---|---|---|---|---|---|
| A | 7244 | 5543 | 0 | 0 | 0.00% | 0.00% | 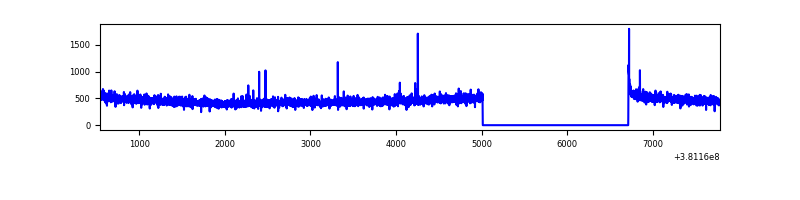 |
| B | 7244 | 5543 | 265 | 265 | 3.66% | 4.78% | 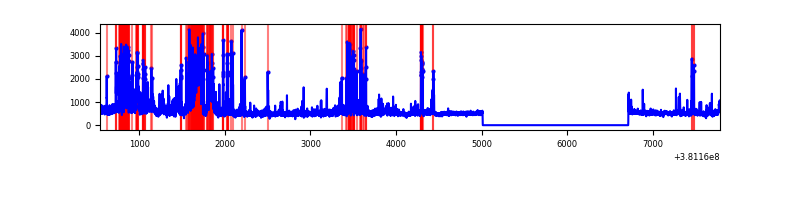 |
| C | 7244 | 5543 | 27 | 27 | 0.37% | 0.49% | 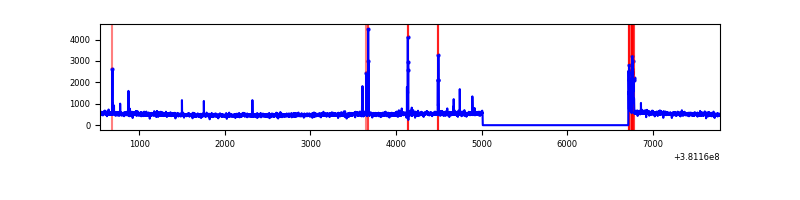 |
| D | 7244 | 5543 | 382 | 382 | 5.27% | 6.89% | 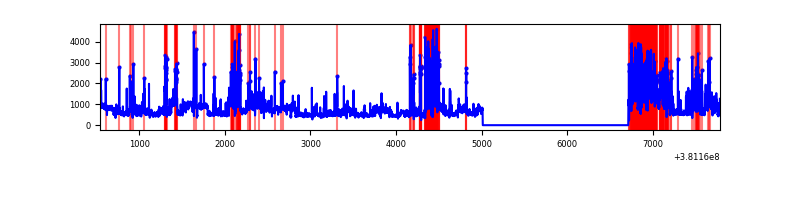 |
Top three noisy pixels from each quadrant. If the there are fewer than three noisy pixels in the level2.evt file, extra rows are filled as -1
| Pixel properties | Quadrant properties | ||||||
|---|---|---|---|---|---|---|---|
| Quadrant | DetID | PixID | Counts | Sigma | Mean | Median | Sigma |
| A | 10 | 83 | 19879 | 150.82 | 643 | 631 | 127.6 |
| A | 9 | 143 | 10473 | 77.11 | 643 | 631 | 127.6 |
| A | 13 | 254 | 8606 | 62.49 | 643 | 631 | 127.6 |
| B | 5 | 172 | 1226166 | 10283.01 | 627 | 610 | 119.2 |
| B | 4 | 251 | 268519 | 2247.89 | 627 | 610 | 119.2 |
| B | 5 | 173 | 27120 | 222.43 | 627 | 610 | 119.2 |
| C | 15 | 214 | 240224 | 1640.43 | 635 | 642 | 146.0 |
| C | 0 | 10 | 73588 | 499.46 | 635 | 642 | 146.0 |
| C | 0 | 207 | 55610 | 376.37 | 635 | 642 | 146.0 |
| D | 8 | 195 | 879507 | 5916.86 | 615 | 600 | 148.5 |
| D | 2 | 250 | 815557 | 5486.35 | 615 | 600 | 148.5 |
| D | 13 | 249 | 383153 | 2575.37 | 615 | 600 | 148.5 |
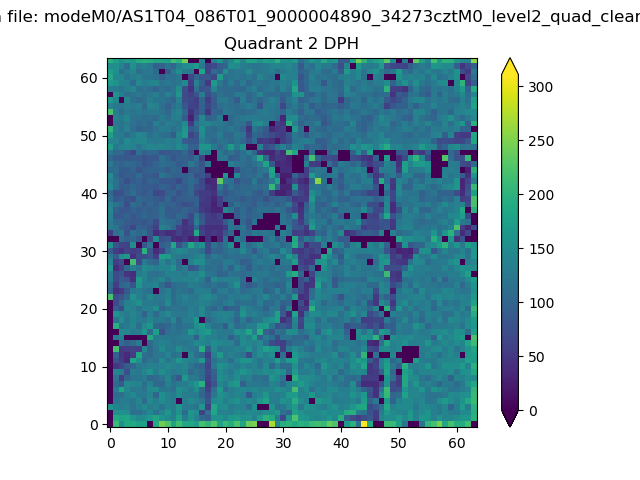
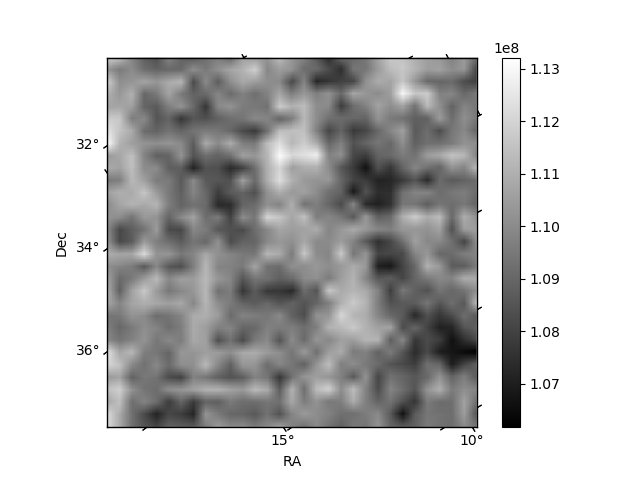
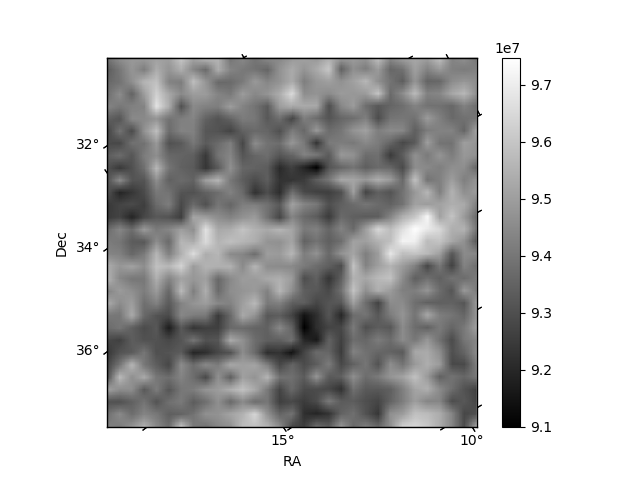
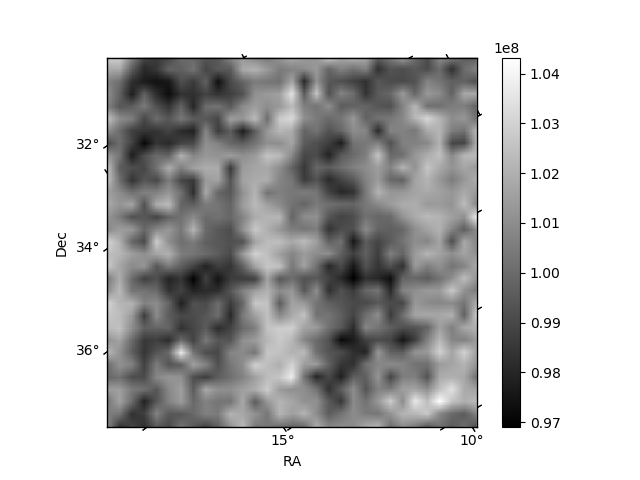
Histogram calculated using DETX and DETY for each event in the final _common_clean file
| Quadrant A | 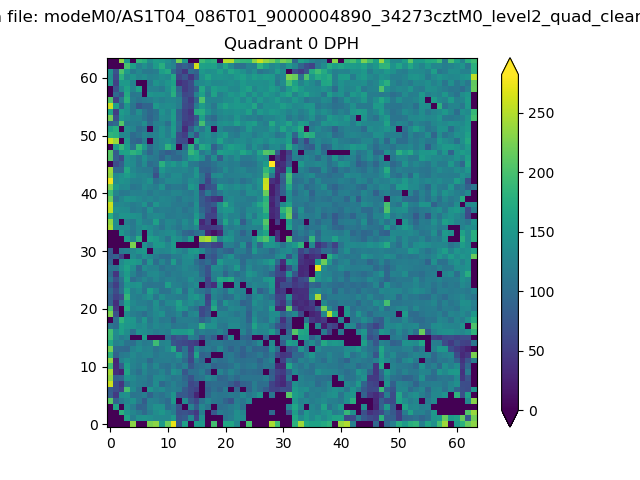 |
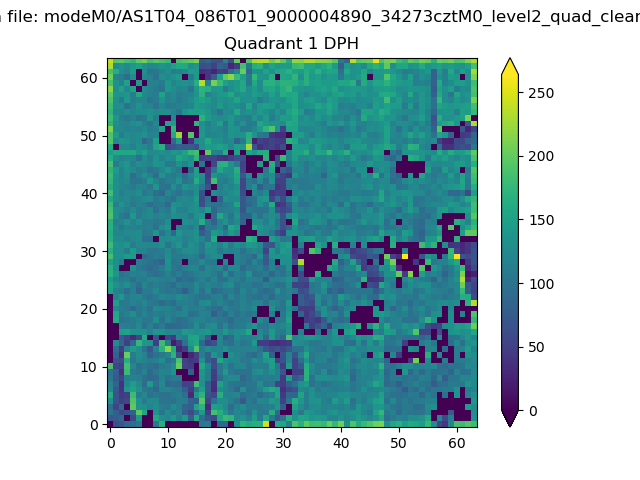 |
Quadrant B |
|---|---|---|---|
| Quadrant D | 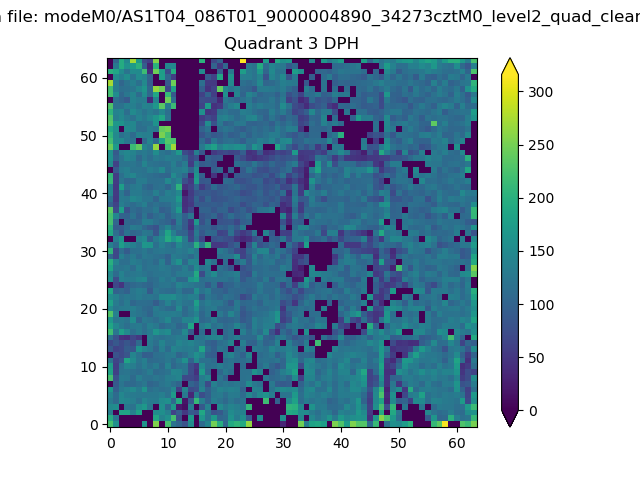 |
 |
Quadrant C |
| Plot type | Count rate plots | Images |
|---|---|---|
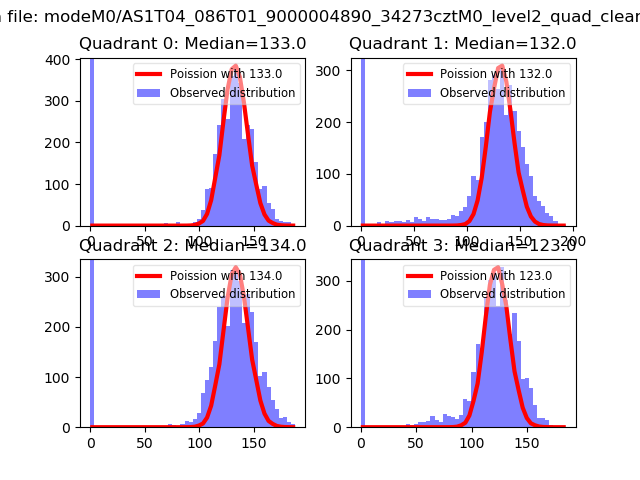
| Comparison with Poisson distribution Blue bars denote a histogram of data divided into 1 sec bins. Red curve is a Poisson curve with rate = median count rate of data. |
 |
 |
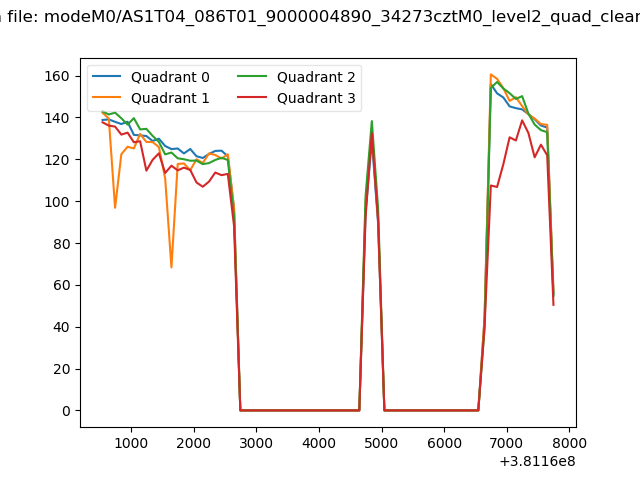
| Quadrant-wise count rates Data is divided into 100 sec bins |
 |
|
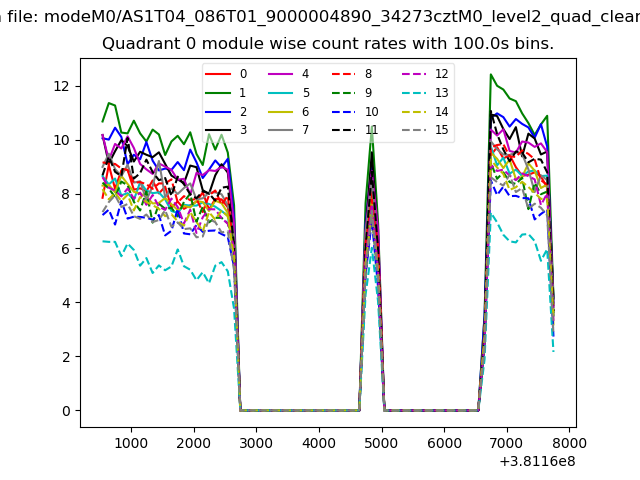
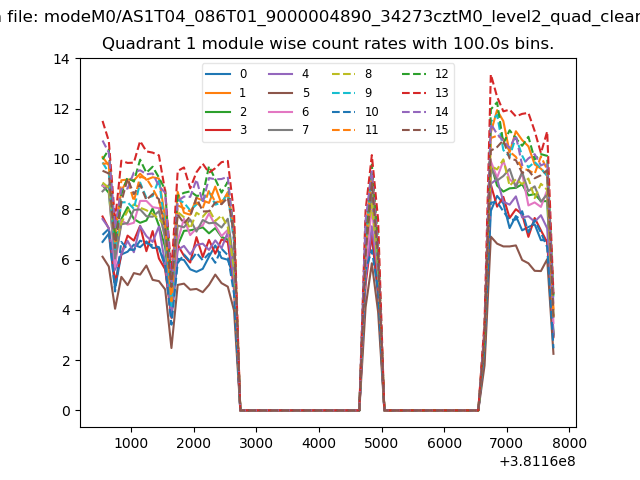
| Module-wise count rates for Quadrant A Data is divided into 100 sec bins |
 |
 |
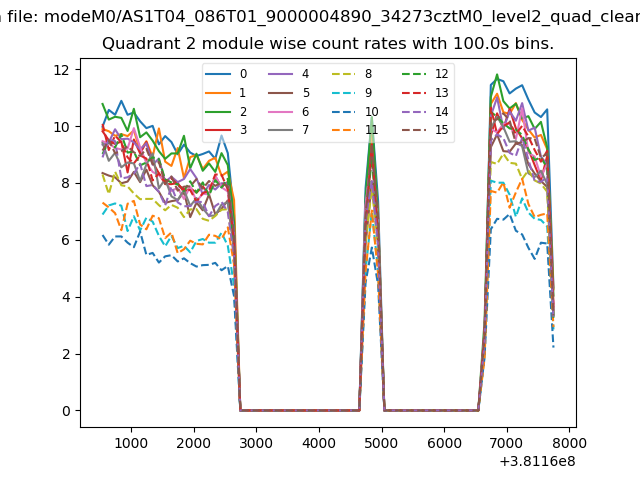
| Module-wise count rates for Quadrant B Data is divided into 100 sec bins |
 |
 |
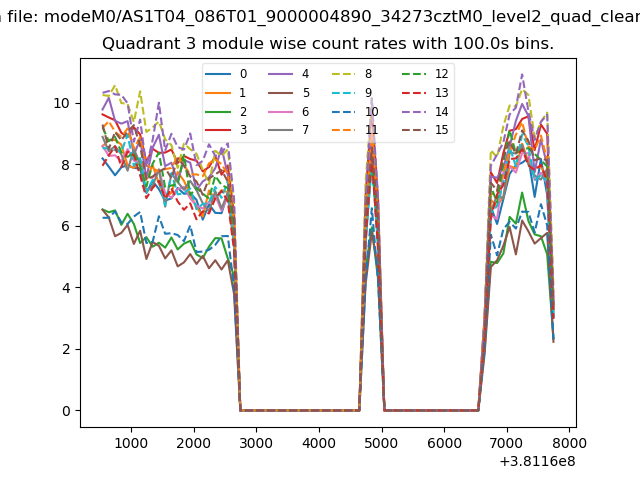
| Module-wise count rates for Quadrant C Data is divided into 100 sec bins |
 |
 |
| Module-wise count rates for Quadrant D Data is divided into 100 sec bins |
 |
 |
| Parameter | Plot |
|---|---|
| CZT HV Monitor | 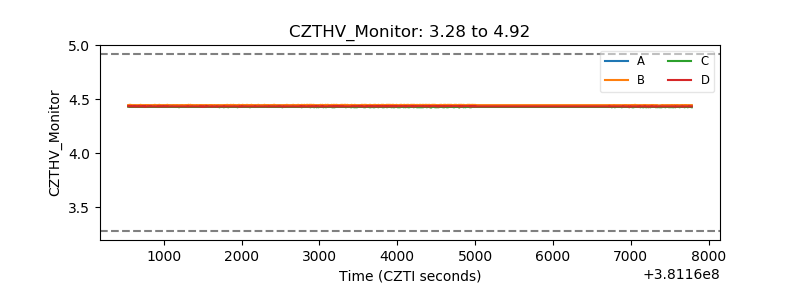 |
| D_VDD | 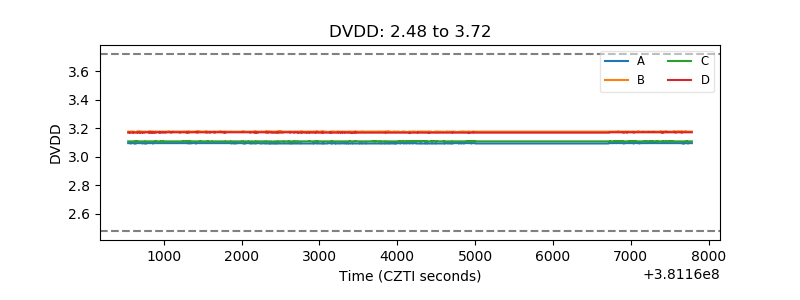 |
| Temperature 1 | 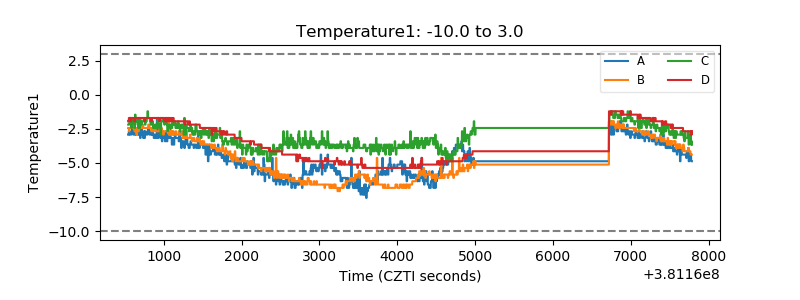 |
| Veto HV Monitor | 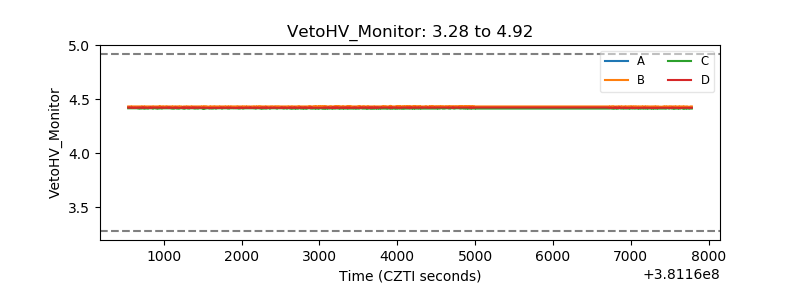 |
| Veto LLD | 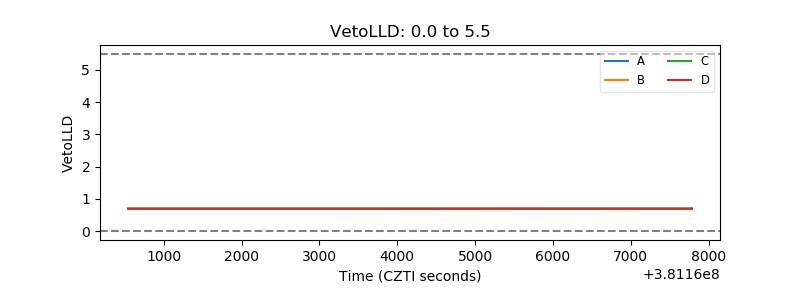 |
| Alpha Counter | 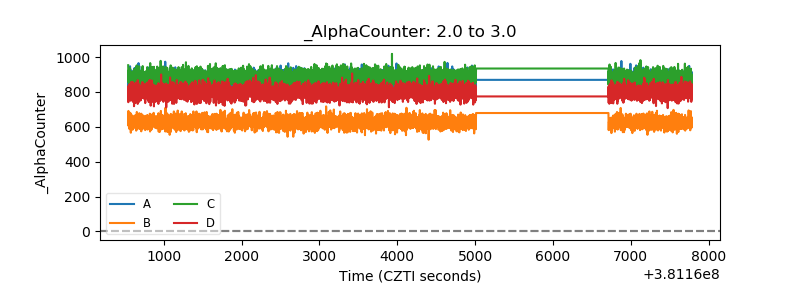 |
| _CPM_Rate | 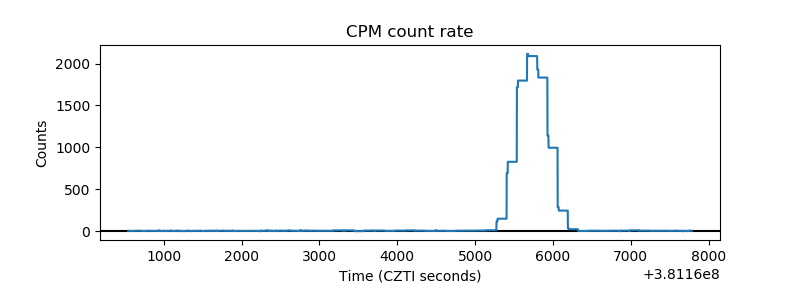 |
| CZT Counter | 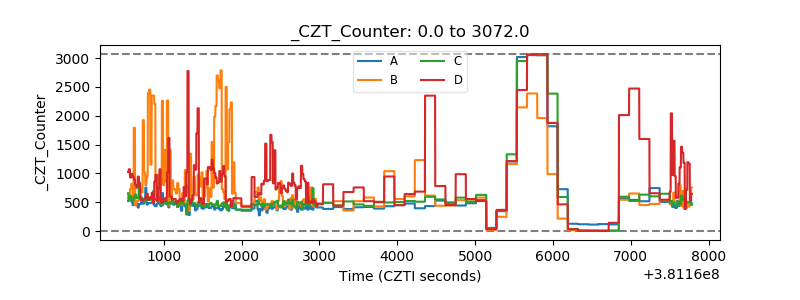 |
| +2.5 Volts monitor | 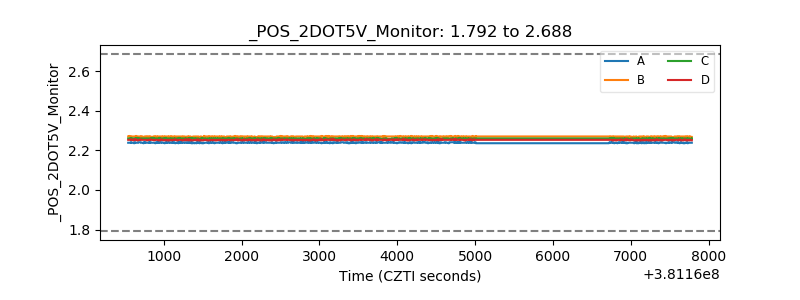 |
| +5 Volts monitor | 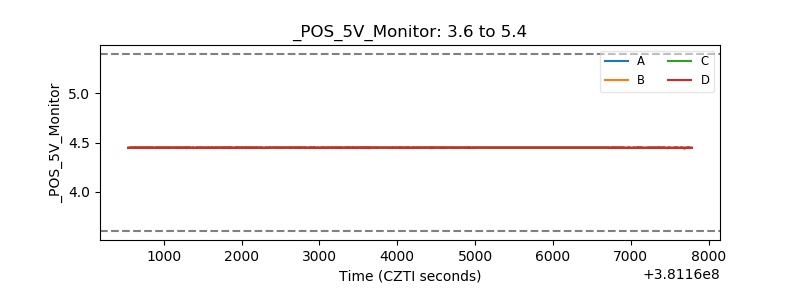 |
| _ROLL_ROT | 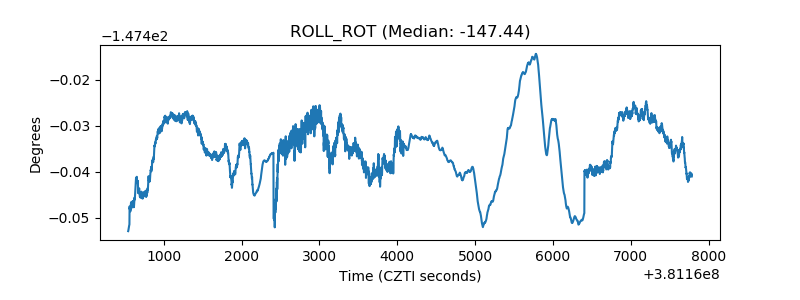 |
| _Roll_DEC | 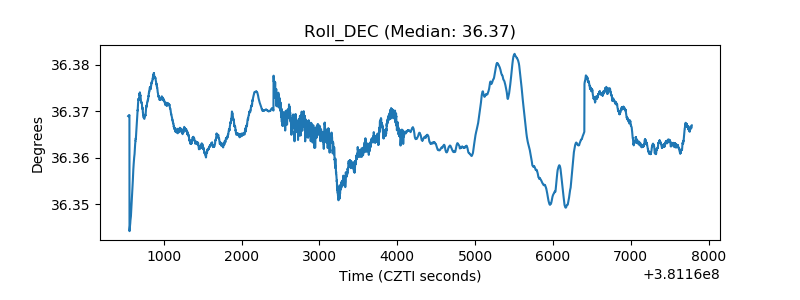 |
| _Roll_RA | 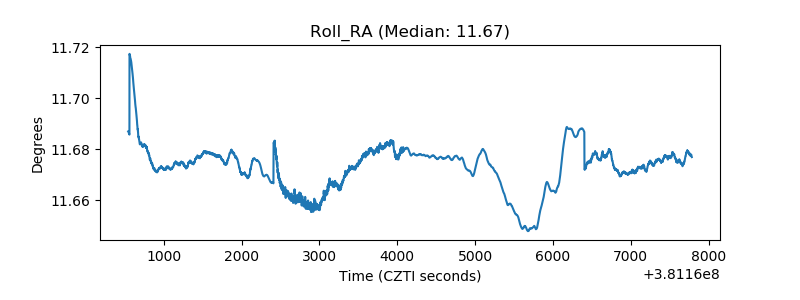 |
| Veto Counter | 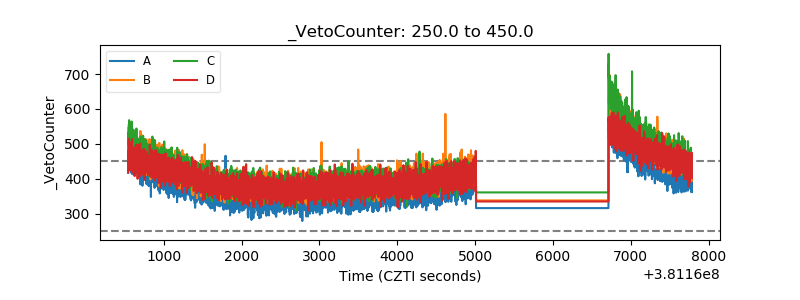 |