| Param | Original file | Final file |
|---|---|---|
| Filename | modeM0/AS1T05_003T01_9000004886_34233cztM0_level2.evt | modeM0/AS1T05_003T01_9000004886_34233cztM0_level2_quad_clean.evt |
| Size (bytes) | 450,633,600 | 55,117,440 |
| Size | 429.8 MB | 52.6 MB |
| Events in quadrant A | 2,651,710 | 323,778 |
| Events in quadrant B | 3,052,360 | 337,756 |
| Events in quadrant C | 3,539,336 | 325,221 |
| Events in quadrant D | 4,042,551 | 308,720 |
| Mode M9 | |||
|---|---|---|---|
| Quadrant | BADHDUFLAG | Total packets | Discarded packets |
| A | 0 | 23 | 0 |
| B | 0 | 23 | 0 |
| C | 0 | 23 | 0 |
| D | 0 | 24 | 0 |
| Mode SS | |||
|---|---|---|---|
| Quadrant | BADHDUFLAG | Total packets | Discarded packets |
| A | 0 | 110 | 0 |
| B | 0 | 110 | 0 |
| C | 0 | 110 | 0 |
| D | 0 | 110 | 0 |
| Mode M0 | |||
|---|---|---|---|
| Quadrant | BADHDUFLAG | Total packets | Discarded packets |
| A | 0 | 10971 | 3 |
| B | 0 | 12282 | 2 |
| C | 0 | 13787 | 2 |
| D | 0 | 15563 | 2 |
| Quadrant | Total seconds | Saturated seconds | Saturation percentage |
|---|---|---|---|
| A | 5322 | 9 | 0.169109% |
| B | 5322 | 59 | 1.108606% |
| C | 5322 | 153 | 2.874859% |
| D | 5322 | 148 | 2.780909% |
Noise dominated data is calculated using 1-second bins in cleaned event files. If a bin has >2000 counts, and if more than 50% of those come from <1% of pixels, then it is considered to be noise-dominated and hence unusable.
| Quadrant | # 1 sec bins | Bins with >0 counts | Bins with >2000 counts | High rate bins dominated by noise | Noise dominated (total time) | Noise dominated (detector-on time) | Marked lightcurve |
|---|---|---|---|---|---|---|---|
| A | 7325 | 5323 | 5 | 5 | 0.07% | 0.09% | 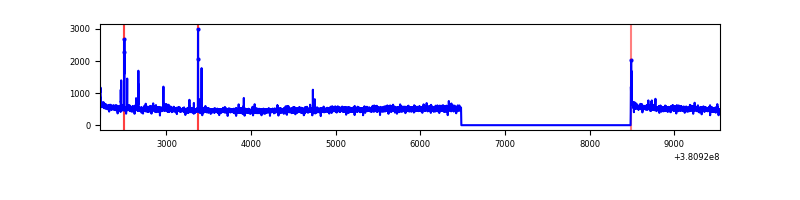 |
| B | 7325 | 5323 | 32 | 32 | 0.44% | 0.60% | 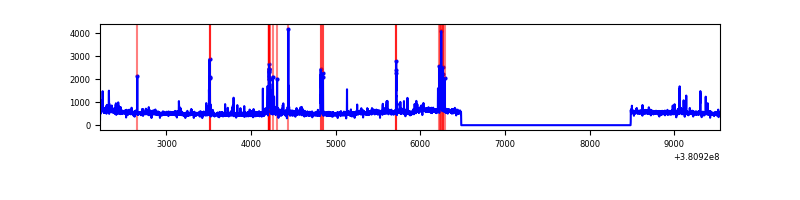 |
| C | 7325 | 5323 | 107 | 107 | 1.46% | 2.01% | 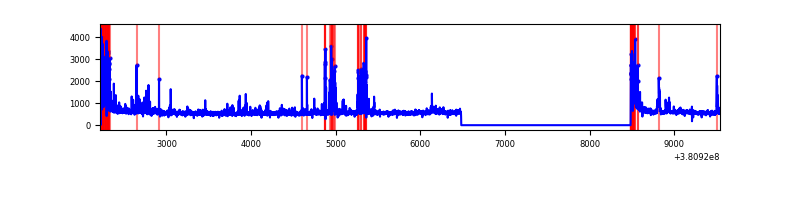 |
| D | 7325 | 5323 | 118 | 118 | 1.61% | 2.22% | 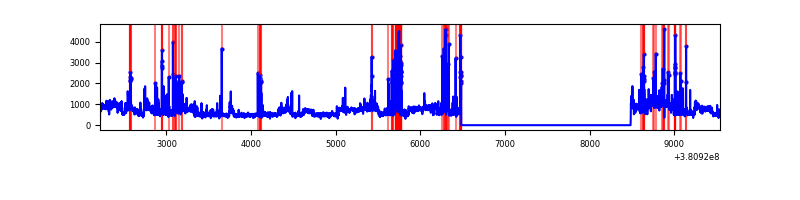 |
Top three noisy pixels from each quadrant. If the there are fewer than three noisy pixels in the level2.evt file, extra rows are filled as -1
| Pixel properties | Quadrant properties | ||||||
|---|---|---|---|---|---|---|---|
| Quadrant | DetID | PixID | Counts | Sigma | Mean | Median | Sigma |
| A | 9 | 143 | 33855 | 247.67 | 666 | 654 | 134.1 |
| A | 10 | 83 | 23118 | 167.57 | 666 | 654 | 134.1 |
| A | 13 | 6 | 15964 | 114.21 | 666 | 654 | 134.1 |
| B | 5 | 172 | 164830 | 1295.25 | 675 | 658 | 126.7 |
| B | 0 | 183 | 81101 | 634.66 | 675 | 658 | 126.7 |
| B | 0 | 189 | 50743 | 395.15 | 675 | 658 | 126.7 |
| C | 0 | 10 | 306003 | 2031.66 | 659 | 667 | 150.3 |
| C | 15 | 214 | 229240 | 1520.89 | 659 | 667 | 150.3 |
| C | 0 | 207 | 159724 | 1058.34 | 659 | 667 | 150.3 |
| D | 8 | 195 | 870054 | 5493.17 | 653 | 638 | 158.3 |
| D | 12 | 6 | 337092 | 2125.79 | 653 | 638 | 158.3 |
| D | 1 | 52 | 105027 | 659.55 | 653 | 638 | 158.3 |
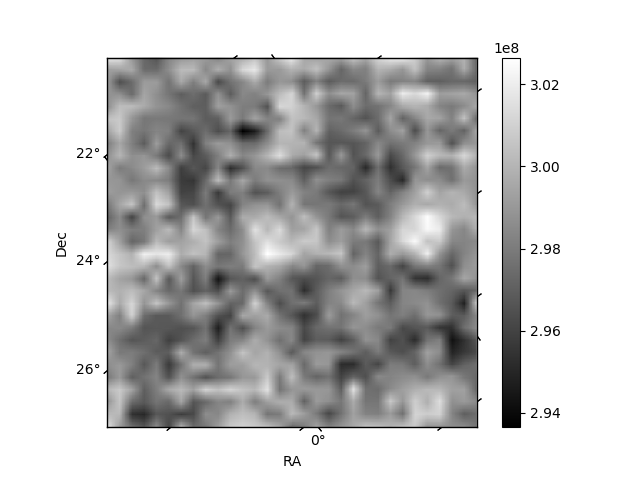
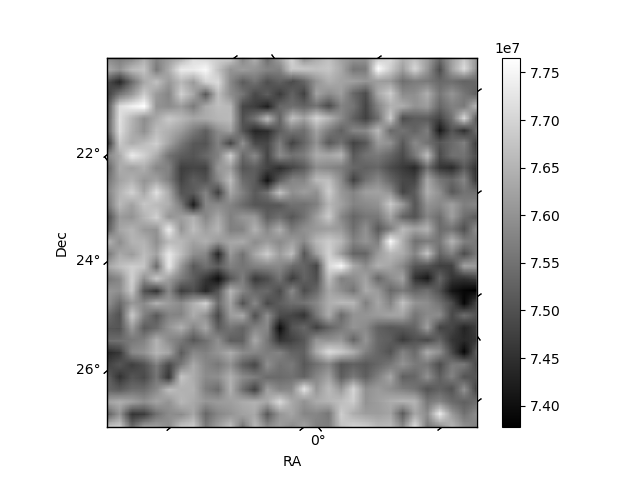
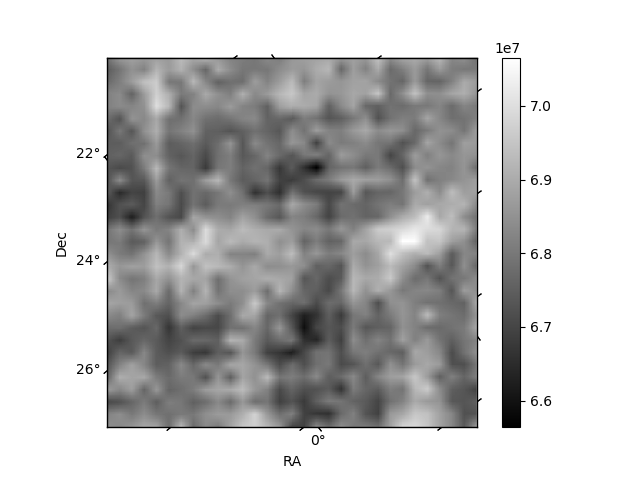
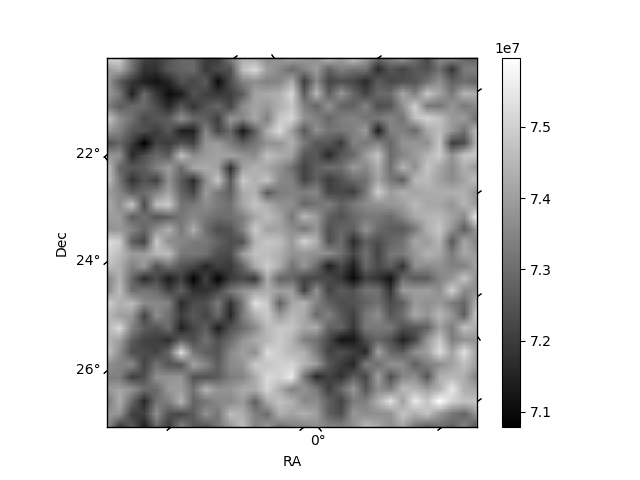
Histogram calculated using DETX and DETY for each event in the final _common_clean file
| Quadrant A | 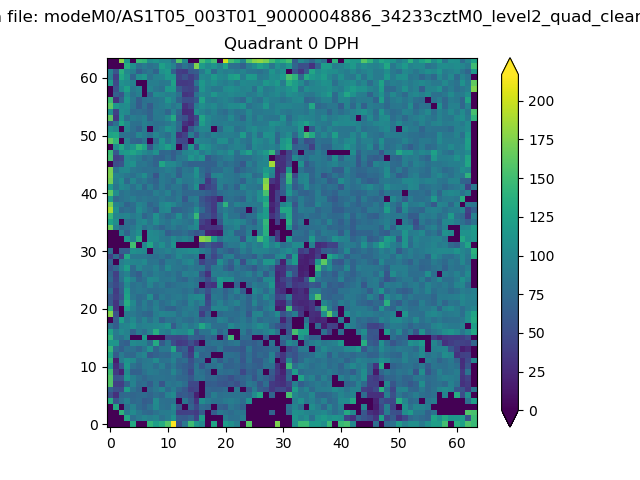 |
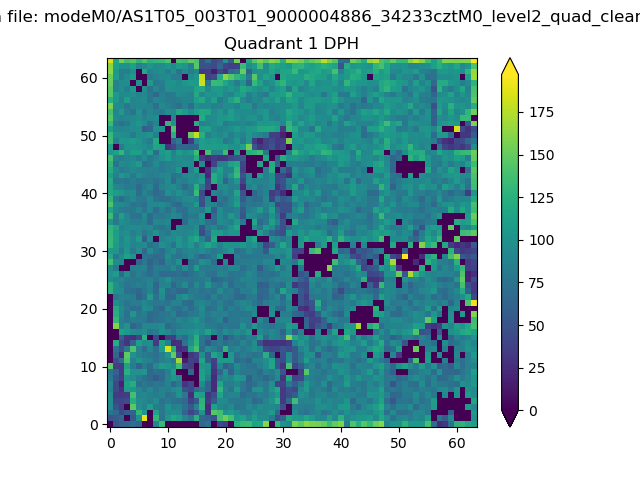 |
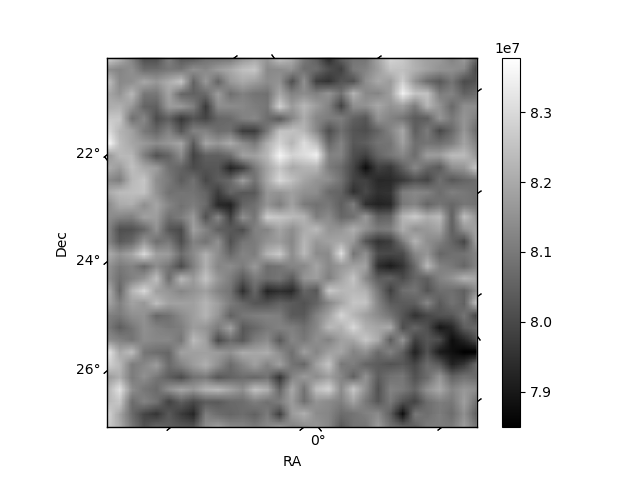
Quadrant B |
|---|---|---|---|
| Quadrant D | 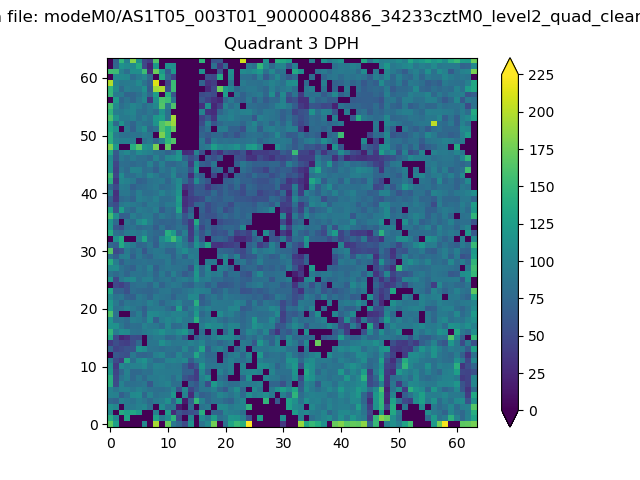 |
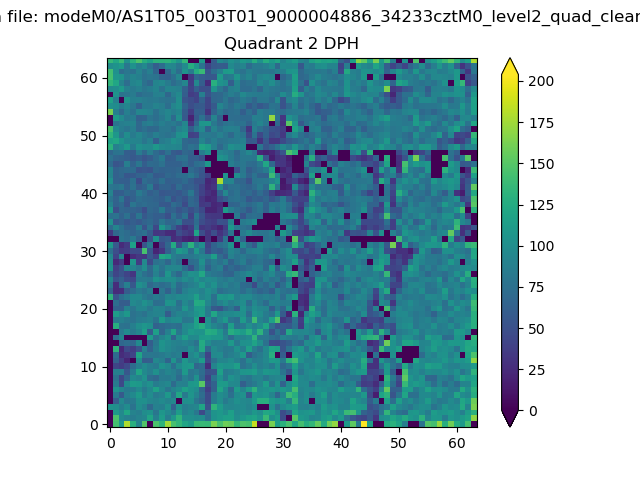 |
Quadrant C |
| Plot type | Count rate plots | Images |
|---|---|---|
| Comparison with Poisson distribution Blue bars denote a histogram of data divided into 1 sec bins. Red curve is a Poisson curve with rate = median count rate of data. |
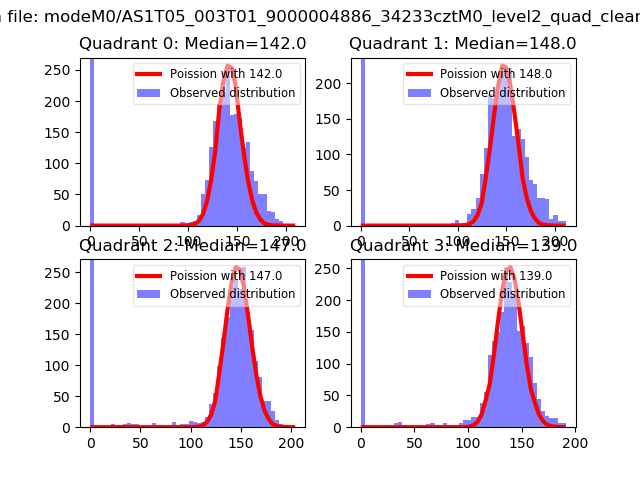 |
 |
| Quadrant-wise count rates Data is divided into 100 sec bins |
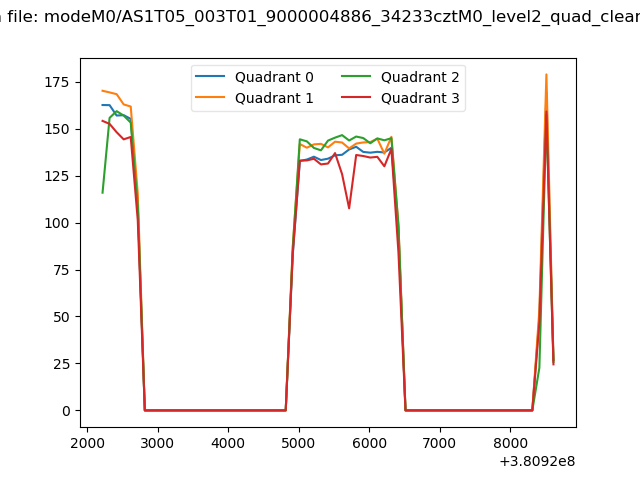 |
|
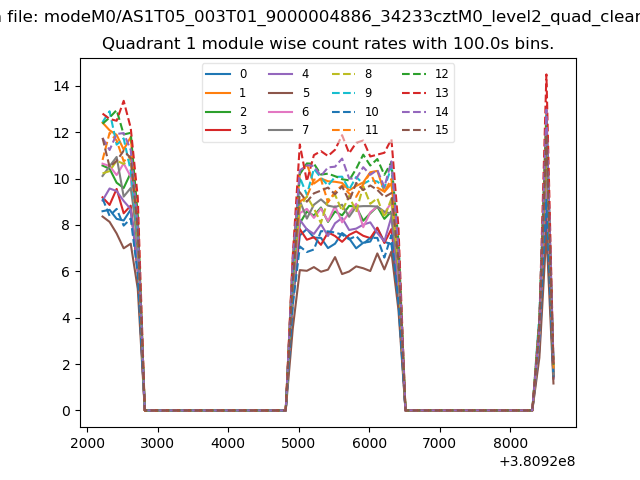
| Module-wise count rates for Quadrant A Data is divided into 100 sec bins |
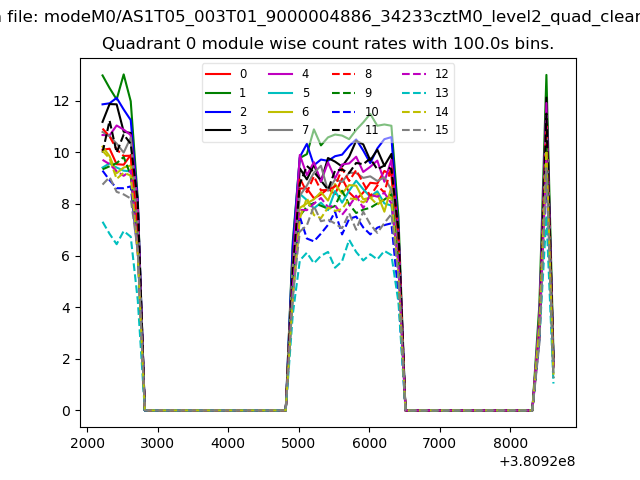 |
 |
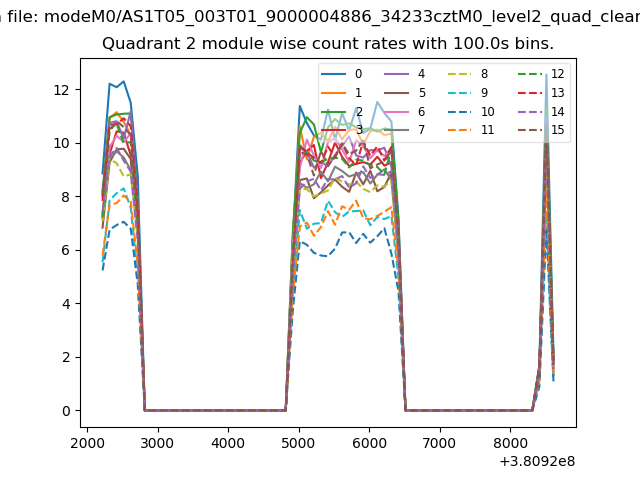
| Module-wise count rates for Quadrant B Data is divided into 100 sec bins |
 |
 |
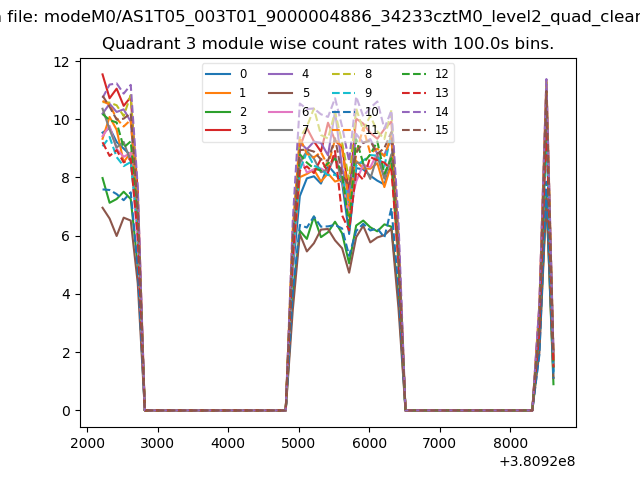
| Module-wise count rates for Quadrant C Data is divided into 100 sec bins |
 |
 |
| Module-wise count rates for Quadrant D Data is divided into 100 sec bins |
 |
 |
| Parameter | Plot |
|---|---|
| CZT HV Monitor | 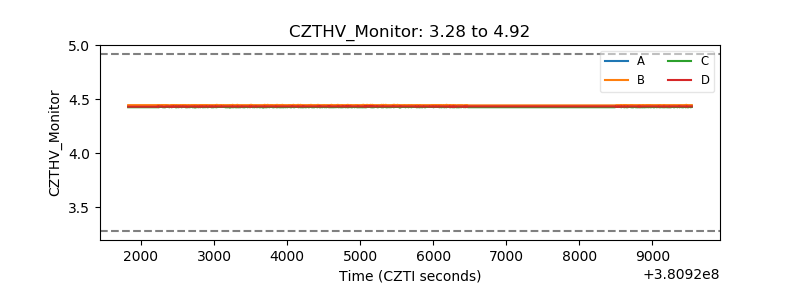 |
| D_VDD | 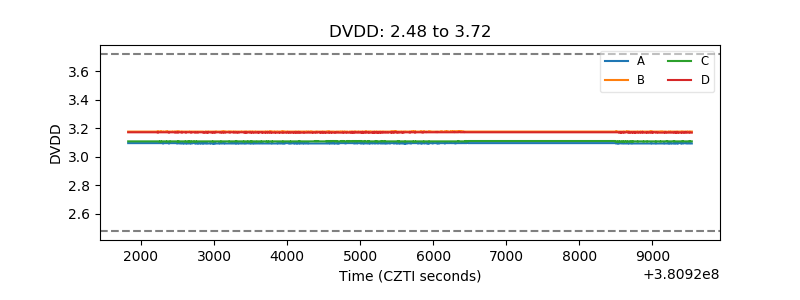 |
| Temperature 1 | 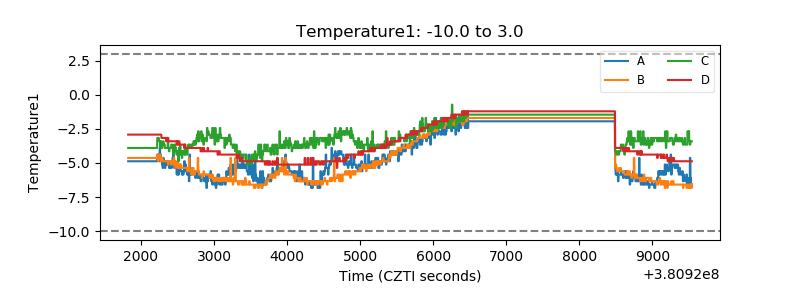 |
| Veto HV Monitor | 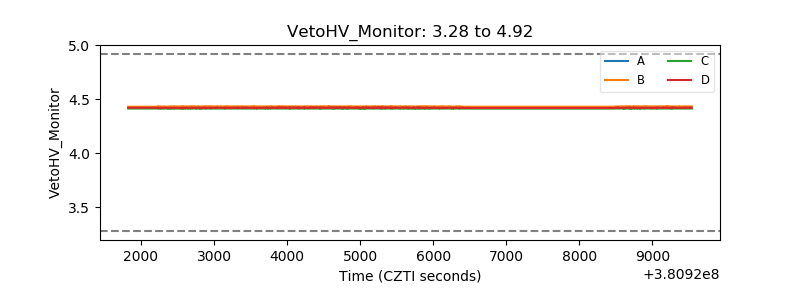 |
| Veto LLD | 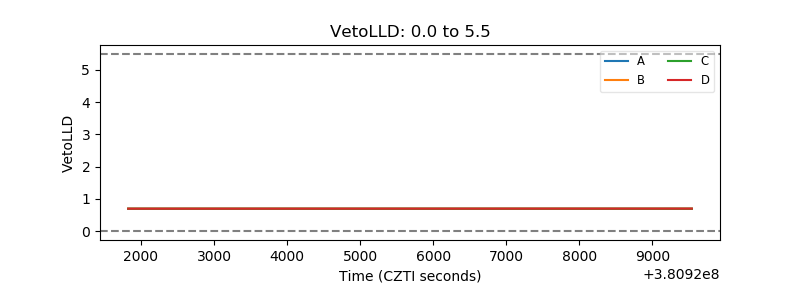 |
| Alpha Counter | 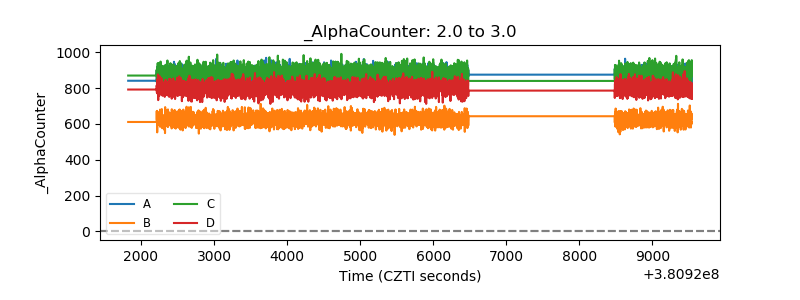 |
| _CPM_Rate | 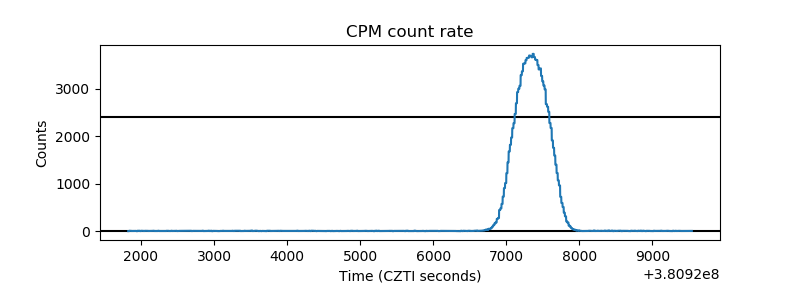 |
| CZT Counter |  |
| +2.5 Volts monitor | 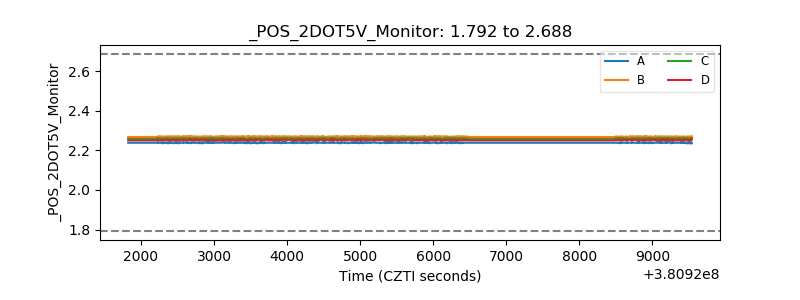 |
| +5 Volts monitor | 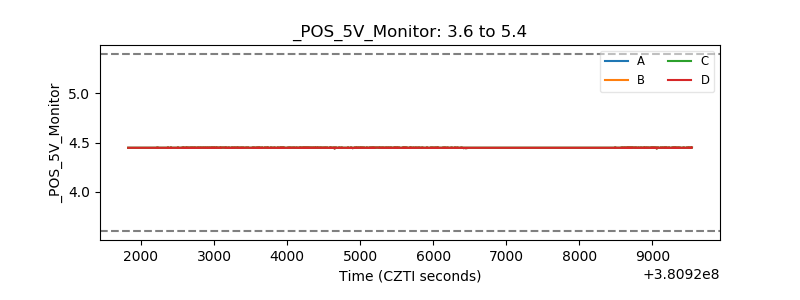 |
| _ROLL_ROT | 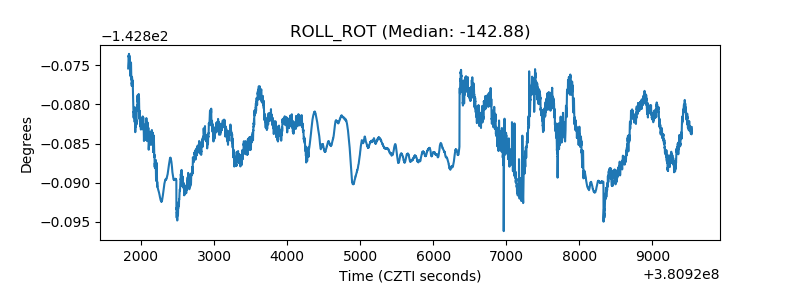 |
| _Roll_DEC | 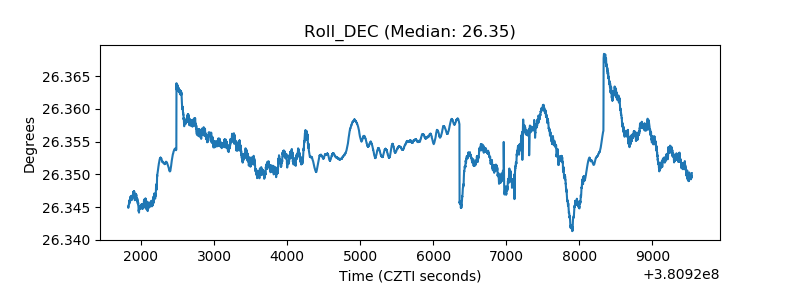 |
| _Roll_RA | 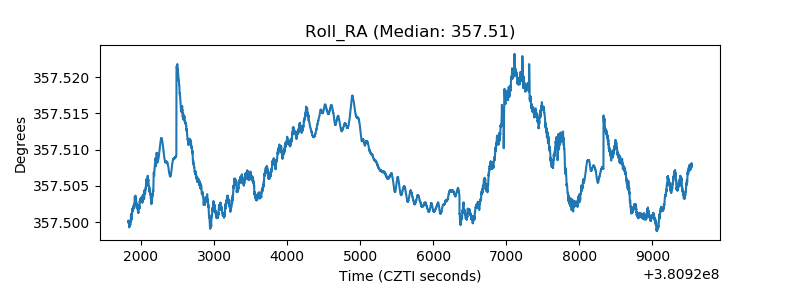 |
| Veto Counter | 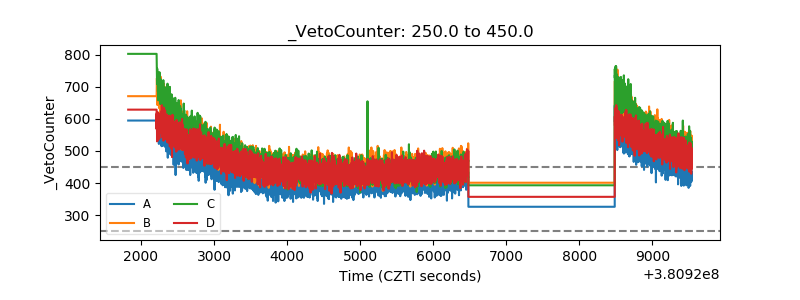 |