| Param | Original file | Final file |
|---|---|---|
| Filename | modeM0/AS1T05_003T01_9000004886_34231cztM0_level2.evt | modeM0/AS1T05_003T01_9000004886_34231cztM0_level2_quad_clean.evt |
| Size (bytes) | 414,040,320 | 68,313,600 |
| Size | 394.9 MB | 65.1 MB |
| Events in quadrant A | 2,497,160 | 423,808 |
| Events in quadrant B | 2,818,262 | 438,112 |
| Events in quadrant C | 3,342,372 | 425,263 |
| Events in quadrant D | 3,520,798 | 409,649 |
| Mode M9 | |||
|---|---|---|---|
| Quadrant | BADHDUFLAG | Total packets | Discarded packets |
| A | 0 | 20 | 0 |
| B | 0 | 20 | 0 |
| C | 0 | 20 | 0 |
| D | 0 | 21 | 0 |
| Mode SS | |||
|---|---|---|---|
| Quadrant | BADHDUFLAG | Total packets | Discarded packets |
| A | 0 | 108 | 0 |
| B | 0 | 108 | 0 |
| C | 0 | 108 | 0 |
| D | 0 | 108 | 0 |
| Mode M0 | |||
|---|---|---|---|
| Quadrant | BADHDUFLAG | Total packets | Discarded packets |
| A | 0 | 10880 | 3 |
| B | 0 | 11642 | 2 |
| C | 0 | 13108 | 2 |
| D | 0 | 13914 | 2 |
| Quadrant | Total seconds | Saturated seconds | Saturation percentage |
|---|---|---|---|
| A | 5307 | 7 | 0.131901% |
| B | 5307 | 66 | 1.243640% |
| C | 5307 | 142 | 2.675711% |
| D | 5307 | 84 | 1.582815% |
Noise dominated data is calculated using 1-second bins in cleaned event files. If a bin has >2000 counts, and if more than 50% of those come from <1% of pixels, then it is considered to be noise-dominated and hence unusable.
| Quadrant | # 1 sec bins | Bins with >0 counts | Bins with >2000 counts | High rate bins dominated by noise | Noise dominated (total time) | Noise dominated (detector-on time) | Marked lightcurve |
|---|---|---|---|---|---|---|---|
| A | 7069 | 5308 | 2 | 2 | 0.03% | 0.04% | 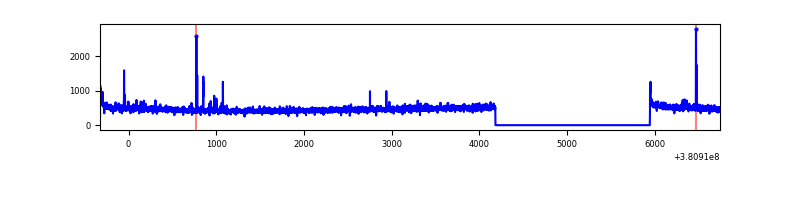 |
| B | 7069 | 5308 | 44 | 44 | 0.62% | 0.83% | 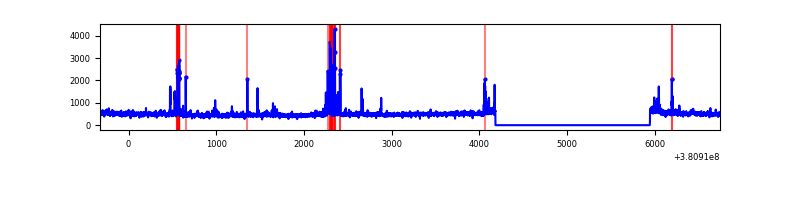 |
| C | 7069 | 5308 | 95 | 95 | 1.34% | 1.79% | 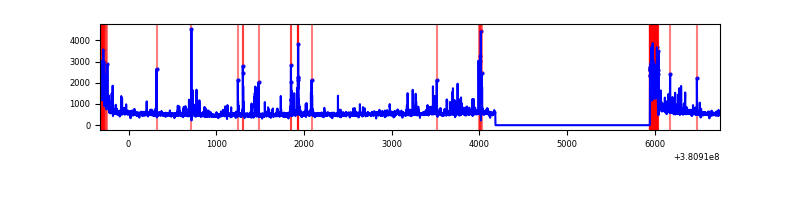 |
| D | 7069 | 5308 | 67 | 67 | 0.95% | 1.26% | 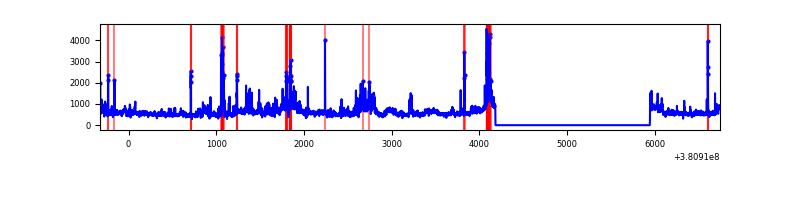 |
Top three noisy pixels from each quadrant. If the there are fewer than three noisy pixels in the level2.evt file, extra rows are filled as -1
| Pixel properties | Quadrant properties | ||||||
|---|---|---|---|---|---|---|---|
| Quadrant | DetID | PixID | Counts | Sigma | Mean | Median | Sigma |
| A | 9 | 143 | 31216 | 245.53 | 624 | 612 | 124.6 |
| A | 10 | 83 | 23643 | 184.77 | 624 | 612 | 124.6 |
| A | 13 | 6 | 14275 | 109.62 | 624 | 612 | 124.6 |
| B | 5 | 172 | 213498 | 1789.57 | 628 | 613 | 119.0 |
| B | 0 | 189 | 44869 | 372.03 | 628 | 613 | 119.0 |
| B | 3 | 112 | 28722 | 236.29 | 628 | 613 | 119.0 |
| C | 0 | 10 | 279818 | 1952.41 | 616 | 623 | 143.0 |
| C | 14 | 254 | 271976 | 1897.57 | 616 | 623 | 143.0 |
| C | 15 | 214 | 230469 | 1607.31 | 616 | 623 | 143.0 |
| D | 8 | 195 | 623863 | 4072.55 | 620 | 605 | 153.0 |
| D | 2 | 249 | 210213 | 1369.64 | 620 | 605 | 153.0 |
| D | 12 | 6 | 163973 | 1067.49 | 620 | 605 | 153.0 |
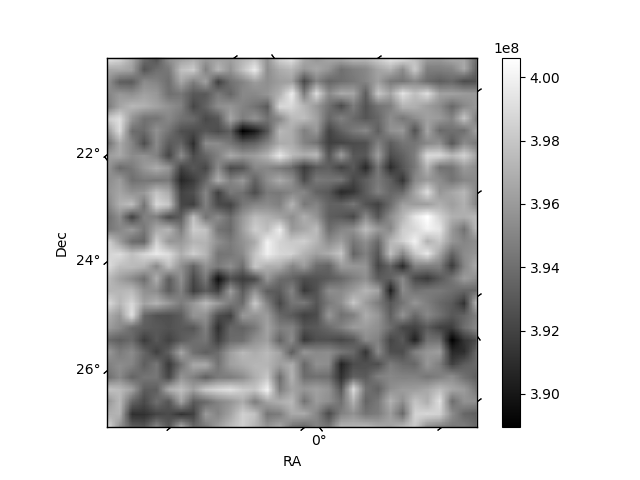
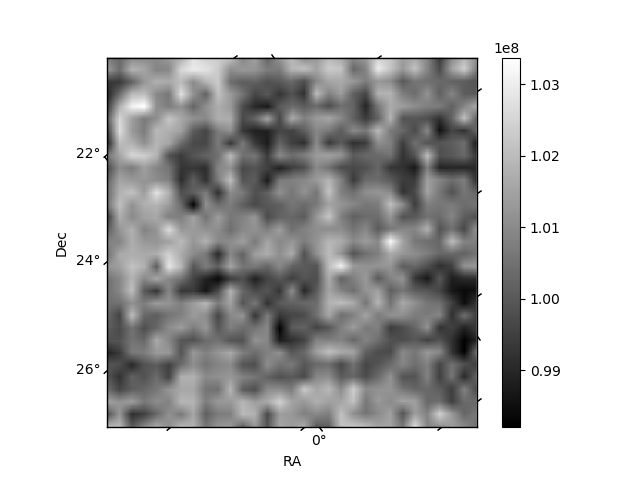
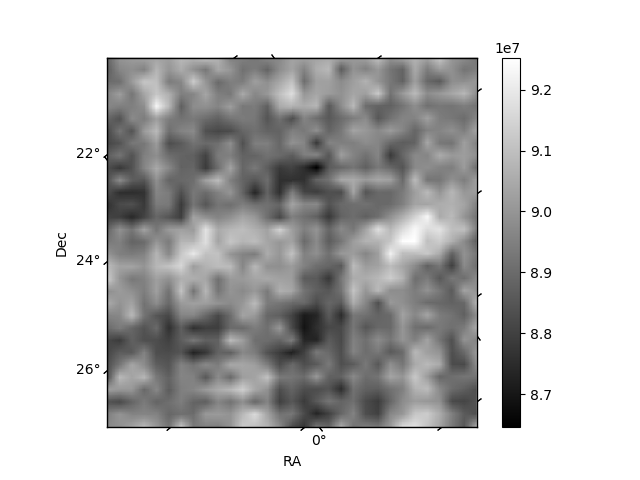
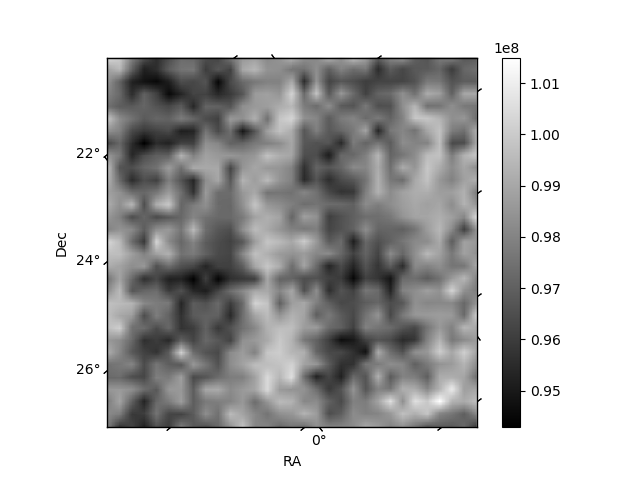
Histogram calculated using DETX and DETY for each event in the final _common_clean file
| Quadrant A | 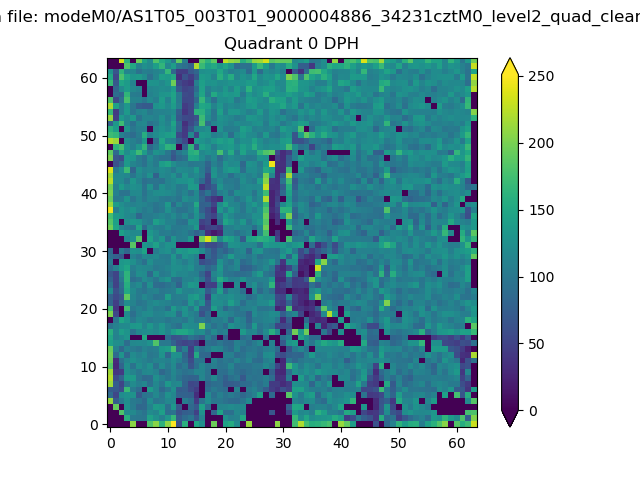 |
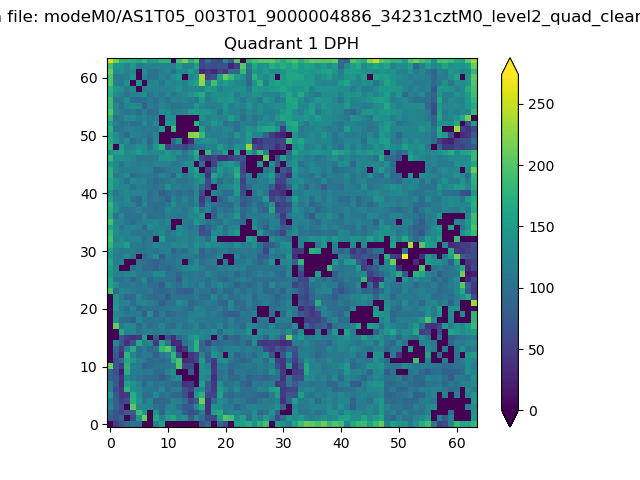 |
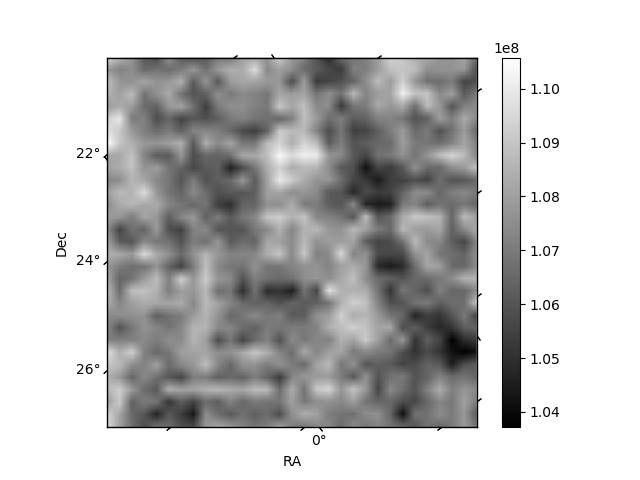
Quadrant B |
|---|---|---|---|
| Quadrant D | 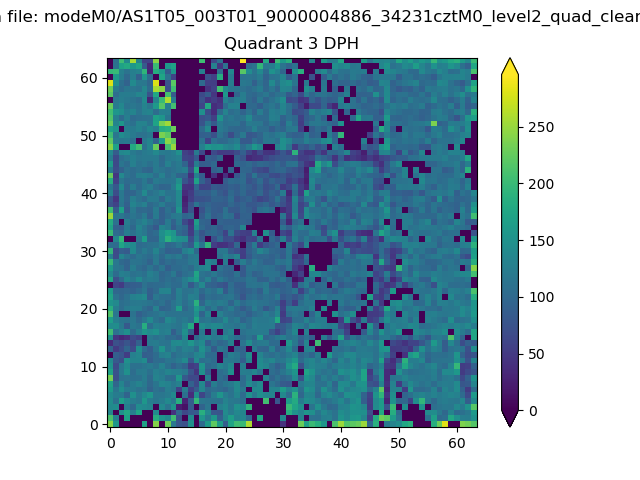 |
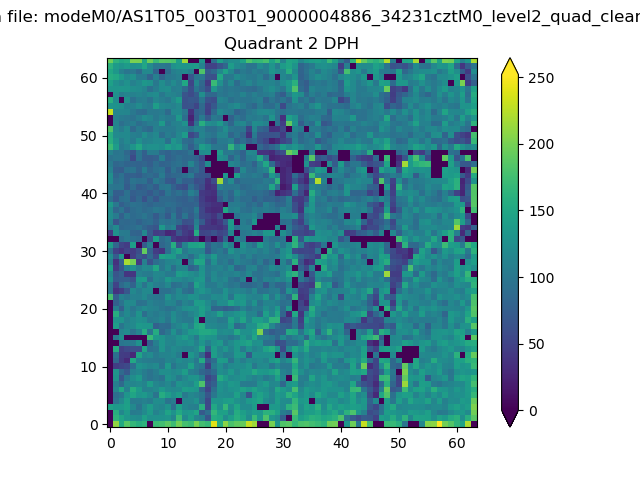 |
Quadrant C |
| Plot type | Count rate plots | Images |
|---|---|---|
| Comparison with Poisson distribution Blue bars denote a histogram of data divided into 1 sec bins. Red curve is a Poisson curve with rate = median count rate of data. |
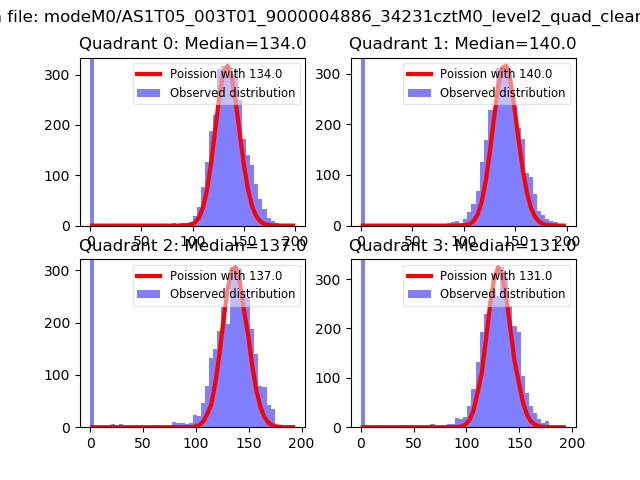 |
 |
| Quadrant-wise count rates Data is divided into 100 sec bins |
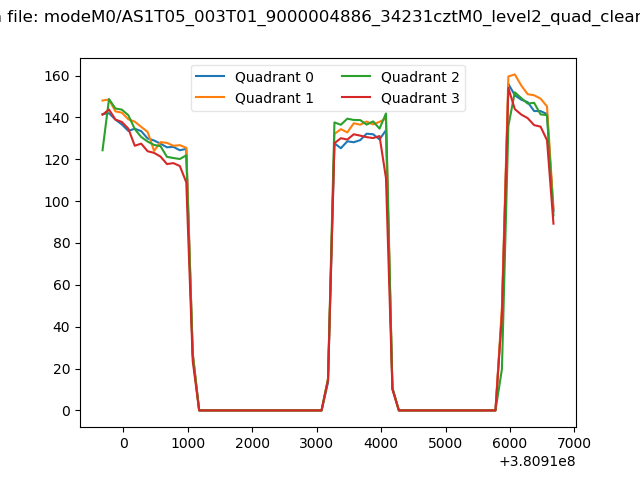 |
|
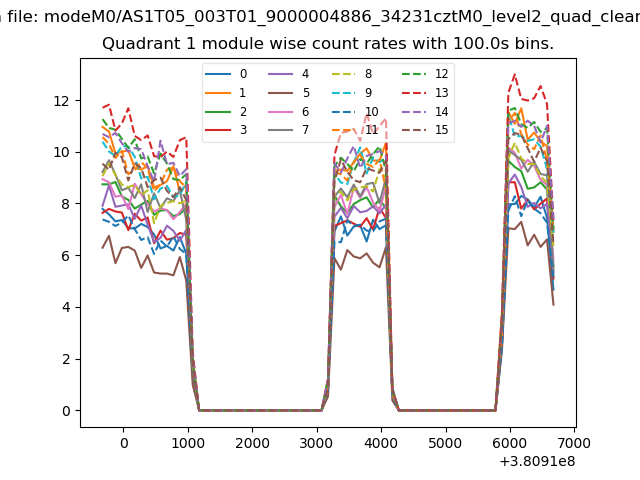
| Module-wise count rates for Quadrant A Data is divided into 100 sec bins |
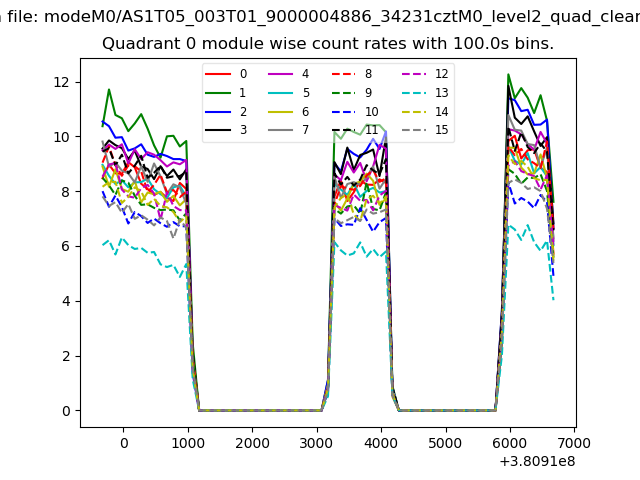 |
 |
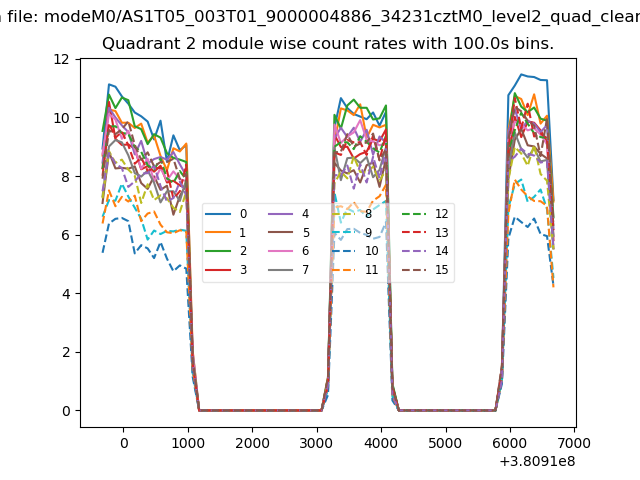
| Module-wise count rates for Quadrant B Data is divided into 100 sec bins |
 |
 |
| Module-wise count rates for Quadrant C Data is divided into 100 sec bins |
 |
 |
| Module-wise count rates for Quadrant D Data is divided into 100 sec bins |
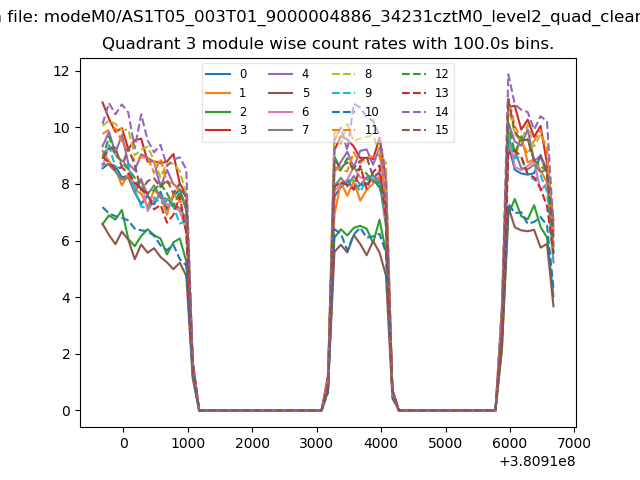 |
 |
| Parameter | Plot |
|---|---|
| CZT HV Monitor | 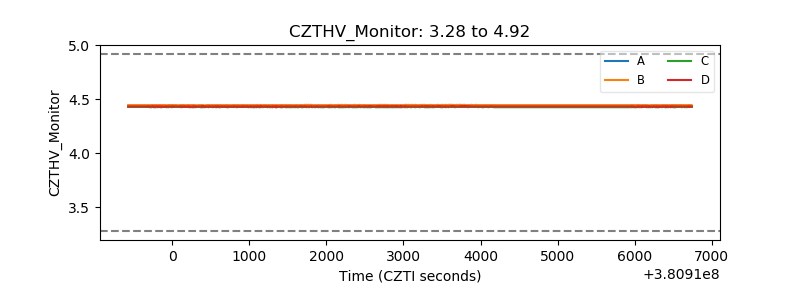 |
| D_VDD | 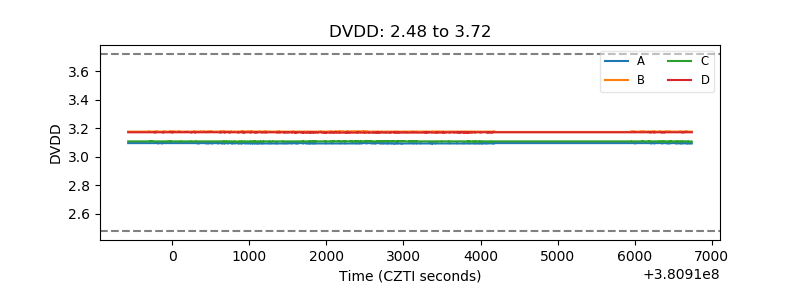 |
| Temperature 1 | 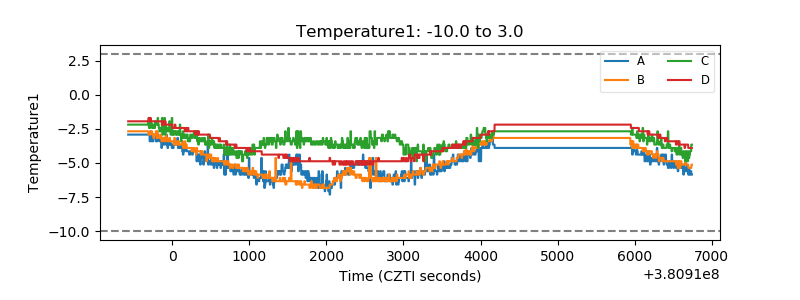 |
| Veto HV Monitor | 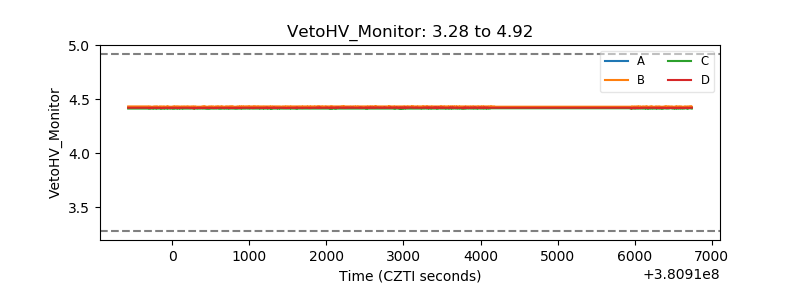 |
| Veto LLD | 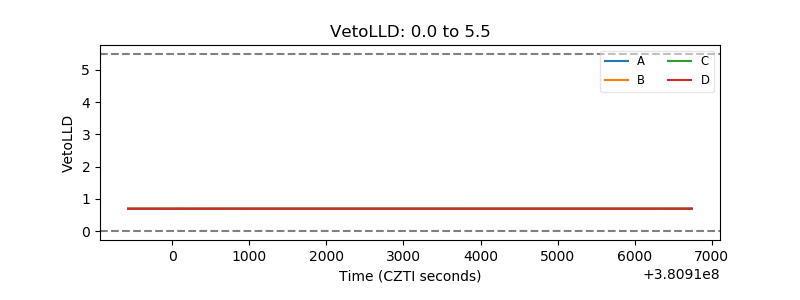 |
| Alpha Counter | 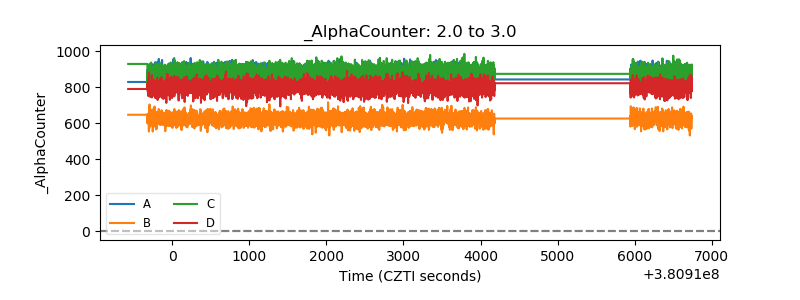 |
| _CPM_Rate | 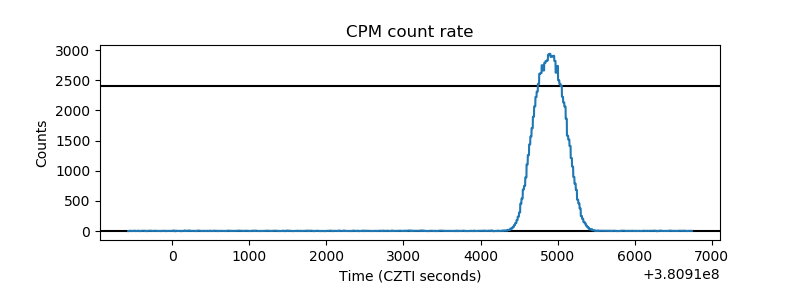 |
| CZT Counter | 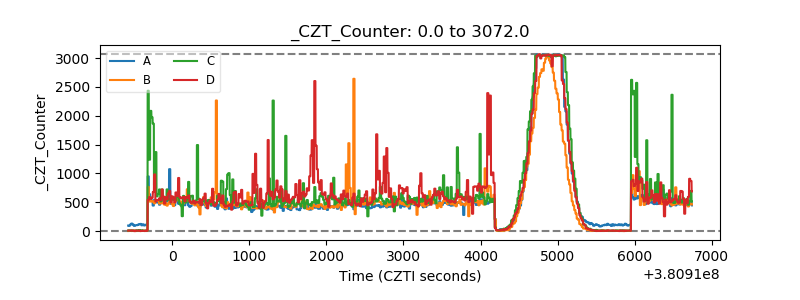 |
| +2.5 Volts monitor | 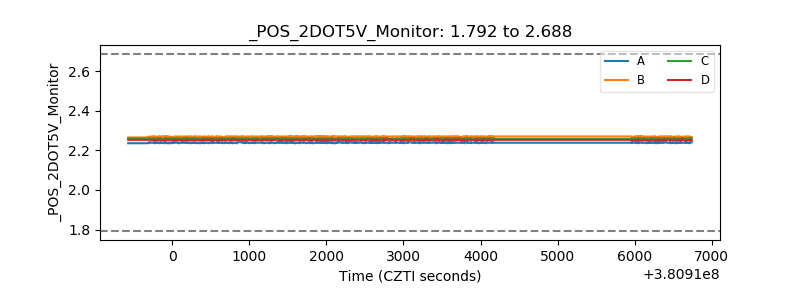 |
| +5 Volts monitor | 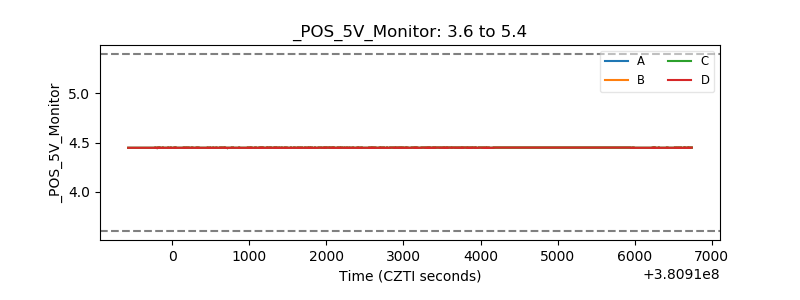 |
| _ROLL_ROT | 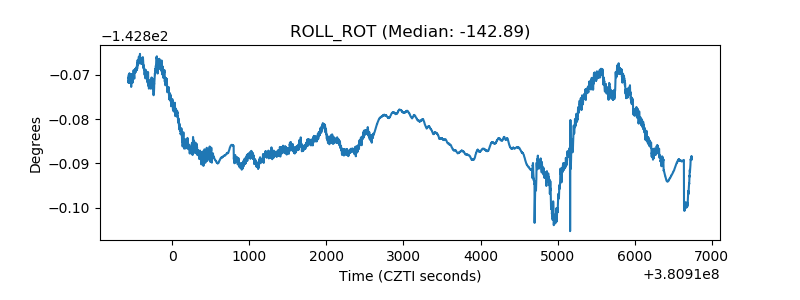 |
| _Roll_DEC | 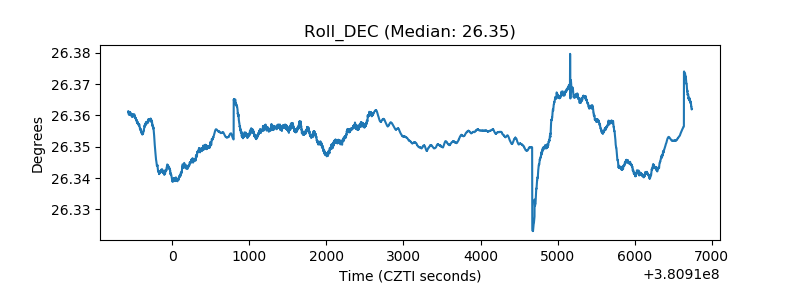 |
| _Roll_RA | 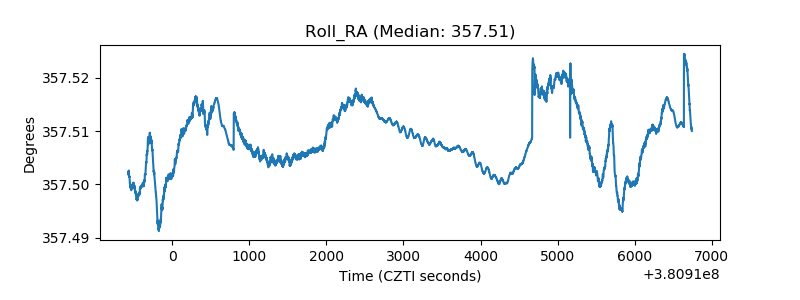 |
| Veto Counter | 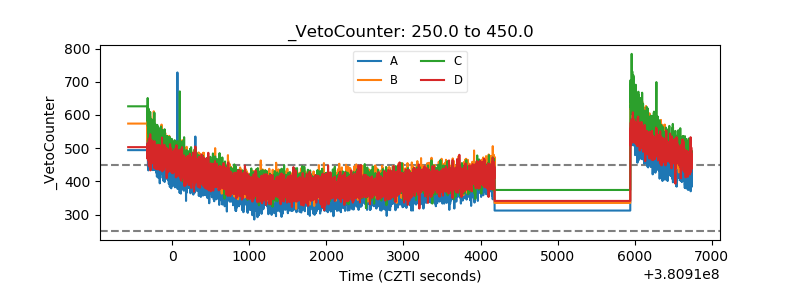 |