| Param | Original file | Final file |
|---|---|---|
| Filename | modeM0/AS1T05_003T01_9000004886_34229cztM0_level2.evt | modeM0/AS1T05_003T01_9000004886_34229cztM0_level2_quad_clean.evt |
| Size (bytes) | 448,701,120 | 68,613,120 |
| Size | 427.9 MB | 65.4 MB |
| Events in quadrant A | 2,547,468 | 430,472 |
| Events in quadrant B | 2,789,376 | 438,778 |
| Events in quadrant C | 3,536,219 | 427,973 |
| Events in quadrant D | 4,341,693 | 394,604 |
| Mode M9 | |||
|---|---|---|---|
| Quadrant | BADHDUFLAG | Total packets | Discarded packets |
| A | 0 | 17 | 0 |
| B | 0 | 17 | 0 |
| C | 0 | 17 | 0 |
| D | 0 | 18 | 0 |
| Mode SS | |||
|---|---|---|---|
| Quadrant | BADHDUFLAG | Total packets | Discarded packets |
| A | 0 | 112 | 0 |
| B | 0 | 112 | 0 |
| C | 0 | 112 | 0 |
| D | 0 | 112 | 0 |
| Mode M0 | |||
|---|---|---|---|
| Quadrant | BADHDUFLAG | Total packets | Discarded packets |
| A | 0 | 11264 | 3 |
| B | 0 | 11799 | 2 |
| C | 0 | 13861 | 2 |
| D | 0 | 16679 | 2 |
| Quadrant | Total seconds | Saturated seconds | Saturation percentage |
|---|---|---|---|
| A | 5509 | 10 | 0.181521% |
| B | 5509 | 53 | 0.962062% |
| C | 5509 | 219 | 3.975313% |
| D | 5509 | 356 | 6.462153% |
Noise dominated data is calculated using 1-second bins in cleaned event files. If a bin has >2000 counts, and if more than 50% of those come from <1% of pixels, then it is considered to be noise-dominated and hence unusable.
| Quadrant | # 1 sec bins | Bins with >0 counts | Bins with >2000 counts | High rate bins dominated by noise | Noise dominated (total time) | Noise dominated (detector-on time) | Marked lightcurve |
|---|---|---|---|---|---|---|---|
| A | 7152 | 5510 | 4 | 4 | 0.06% | 0.07% | 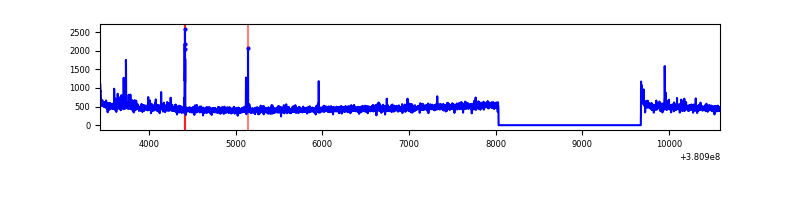 |
| B | 7152 | 5510 | 33 | 33 | 0.46% | 0.60% | 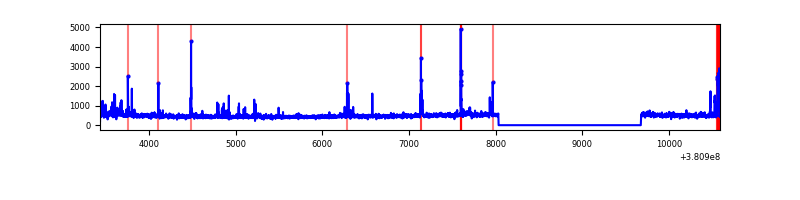 |
| C | 7152 | 5510 | 150 | 150 | 2.10% | 2.72% | 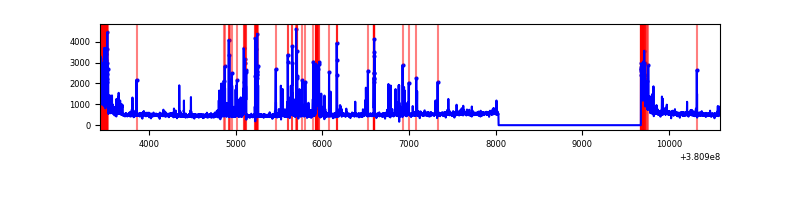 |
| D | 7152 | 5510 | 307 | 307 | 4.29% | 5.57% | 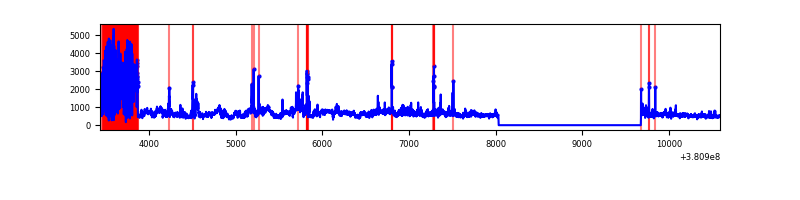 |
Top three noisy pixels from each quadrant. If the there are fewer than three noisy pixels in the level2.evt file, extra rows are filled as -1
| Pixel properties | Quadrant properties | ||||||
|---|---|---|---|---|---|---|---|
| Quadrant | DetID | PixID | Counts | Sigma | Mean | Median | Sigma |
| A | 15 | 169 | 35126 | 269.53 | 634 | 621 | 128.0 |
| A | 9 | 143 | 24639 | 187.61 | 634 | 621 | 128.0 |
| A | 10 | 83 | 23928 | 182.06 | 634 | 621 | 128.0 |
| B | 5 | 172 | 150545 | 1226.3 | 636 | 620 | 122.3 |
| B | 15 | 201 | 77395 | 627.98 | 636 | 620 | 122.3 |
| B | 0 | 190 | 17026 | 134.19 | 636 | 620 | 122.3 |
| C | 14 | 254 | 483836 | 3382.03 | 619 | 624 | 142.9 |
| C | 0 | 10 | 300030 | 2095.56 | 619 | 624 | 142.9 |
| C | 15 | 214 | 236735 | 1652.55 | 619 | 624 | 142.9 |
| D | 8 | 195 | 930354 | 6212.91 | 610 | 594 | 149.6 |
| D | 1 | 52 | 768976 | 5134.54 | 610 | 594 | 149.6 |
| D | 7 | 80 | 107694 | 715.67 | 610 | 594 | 149.6 |
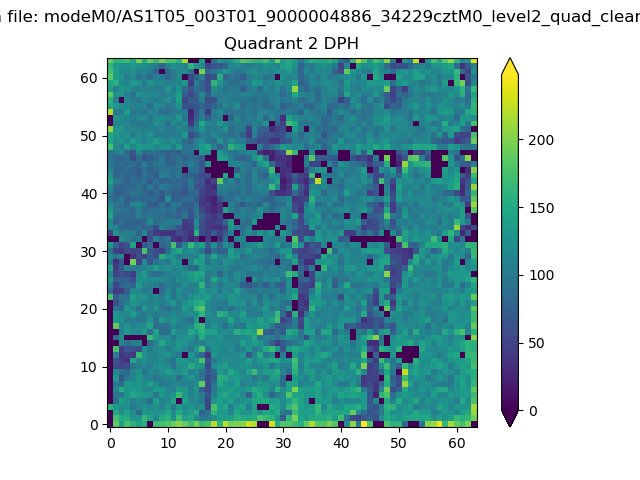
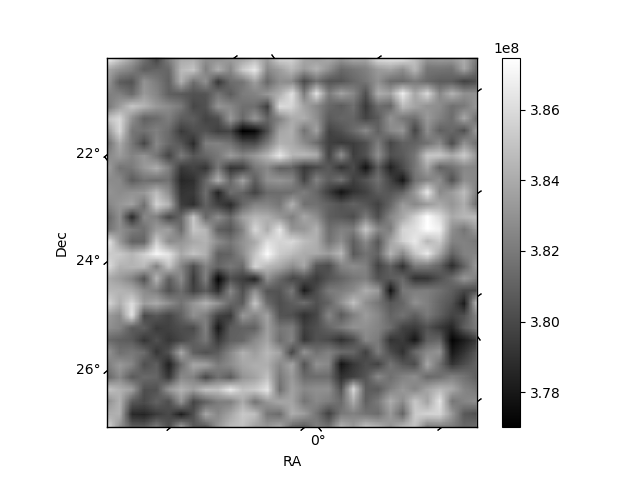
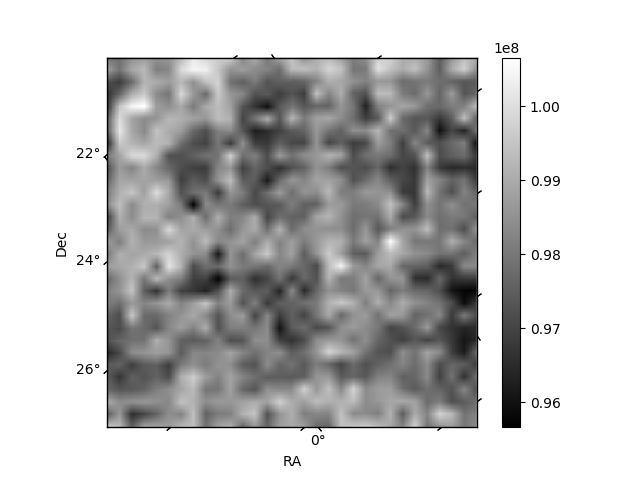
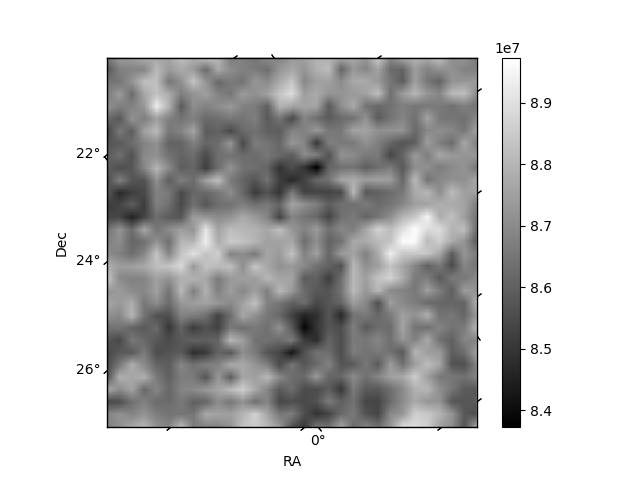
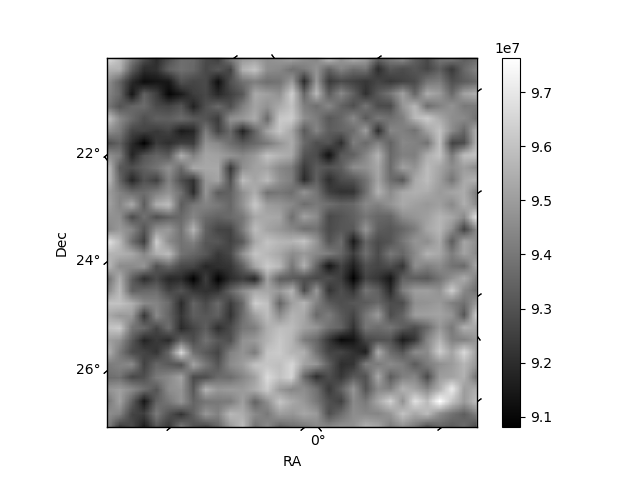
Histogram calculated using DETX and DETY for each event in the final _common_clean file
| Quadrant A | 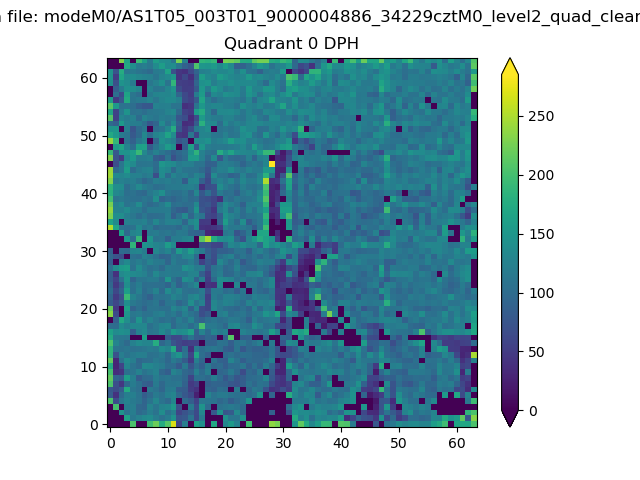 |
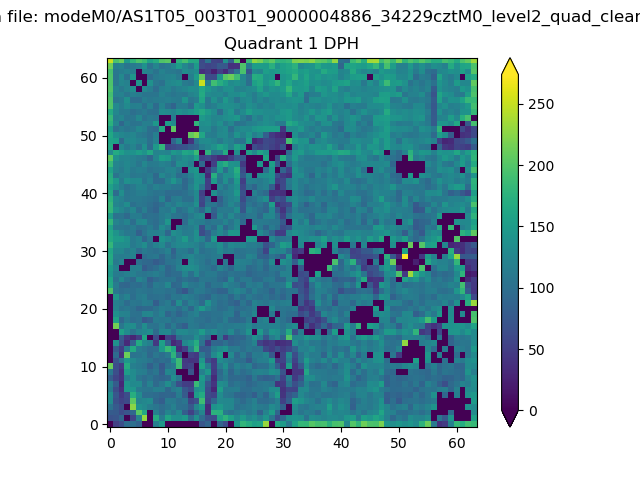 |
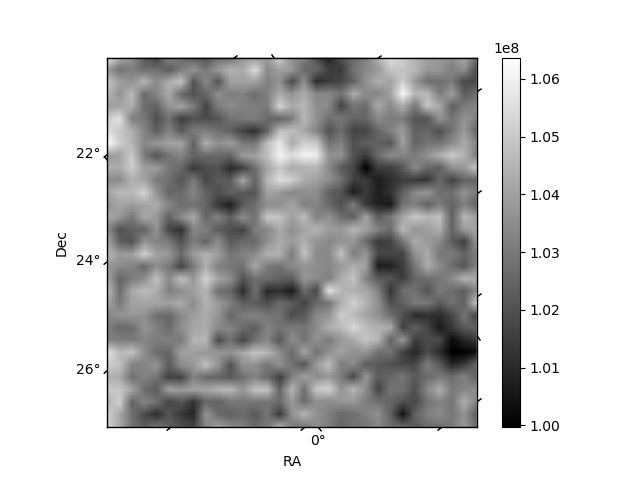
Quadrant B |
|---|---|---|---|
| Quadrant D | 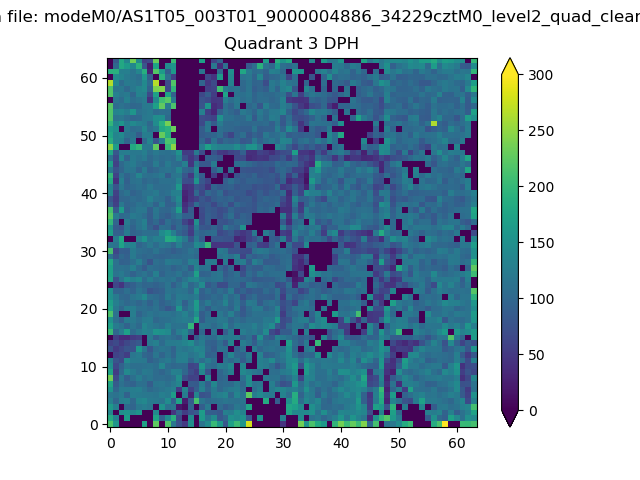 |
 |
Quadrant C |
| Plot type | Count rate plots | Images |
|---|---|---|
| Comparison with Poisson distribution Blue bars denote a histogram of data divided into 1 sec bins. Red curve is a Poisson curve with rate = median count rate of data. |
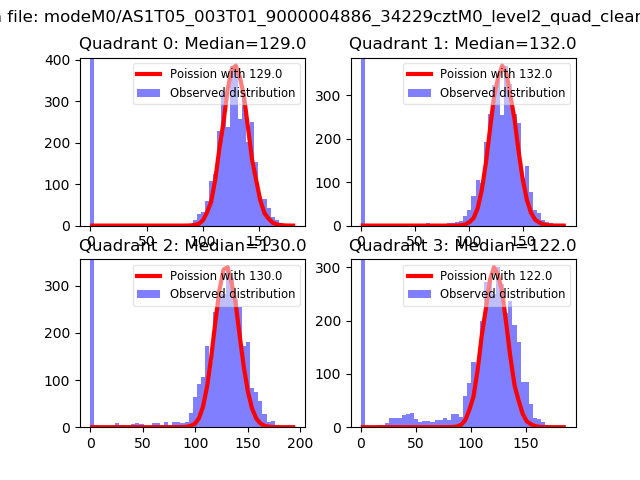 |
 |
| Quadrant-wise count rates Data is divided into 100 sec bins |
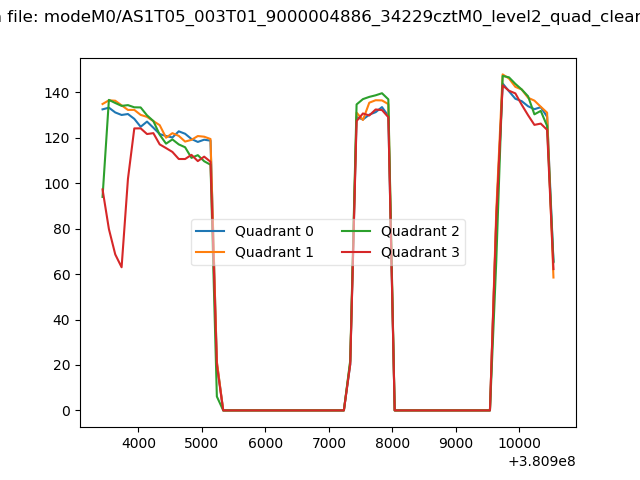 |
|
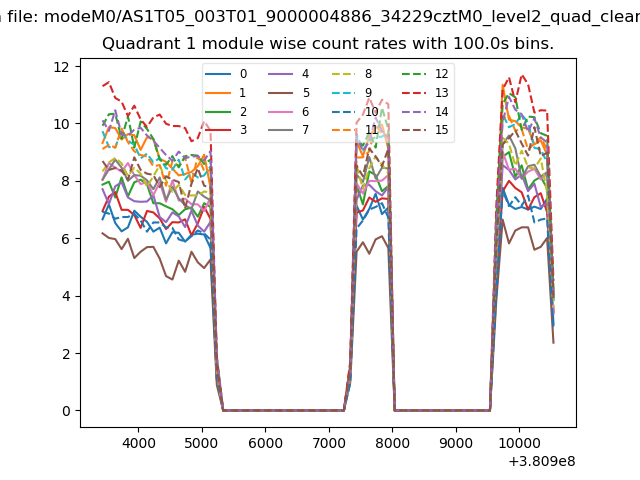
| Module-wise count rates for Quadrant A Data is divided into 100 sec bins |
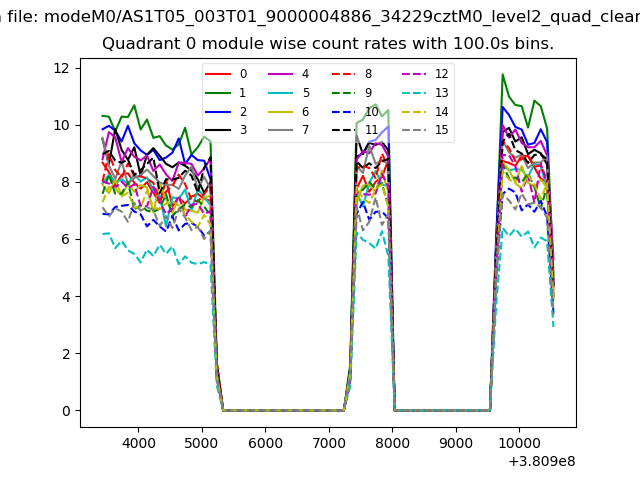 |
 |
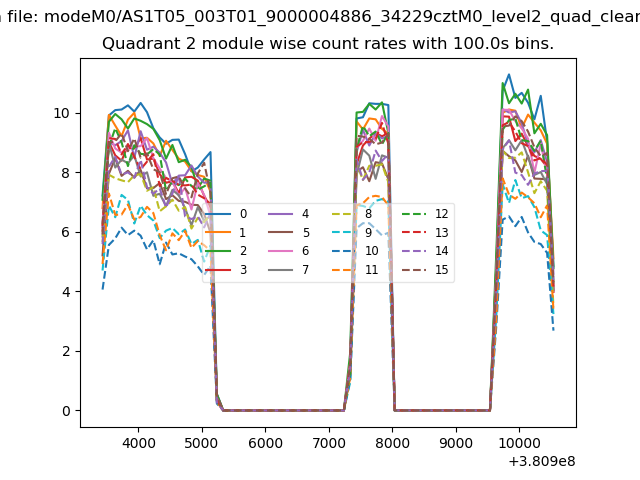
| Module-wise count rates for Quadrant B Data is divided into 100 sec bins |
 |
 |
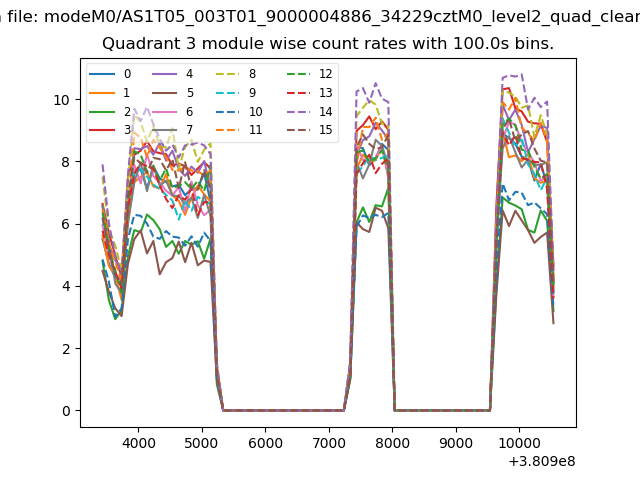
| Module-wise count rates for Quadrant C Data is divided into 100 sec bins |
 |
 |
| Module-wise count rates for Quadrant D Data is divided into 100 sec bins |
 |
 |
| Parameter | Plot |
|---|---|
| CZT HV Monitor | 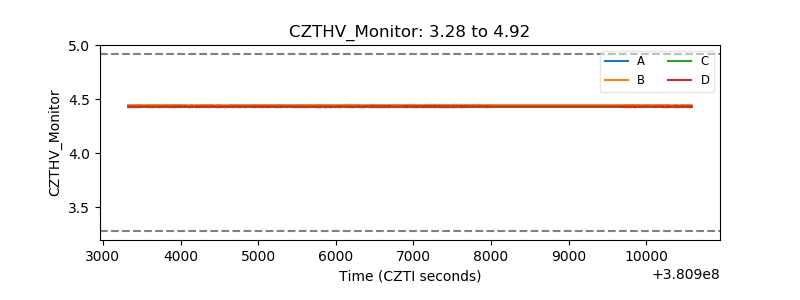 |
| D_VDD | 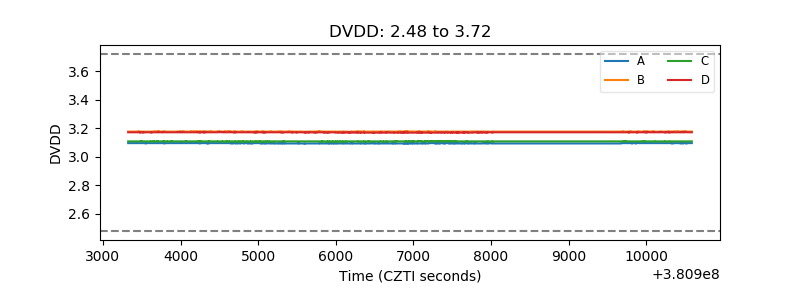 |
| Temperature 1 |  |
| Veto HV Monitor | 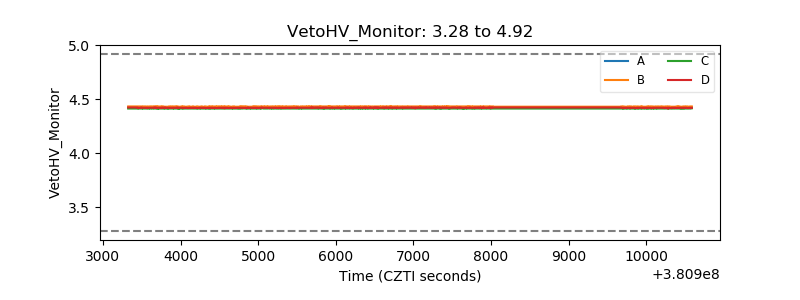 |
| Veto LLD | 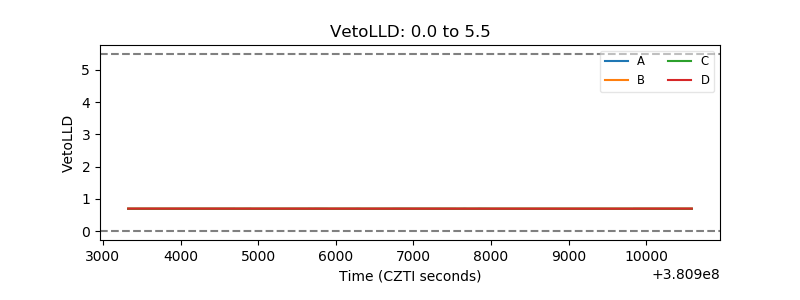 |
| Alpha Counter | 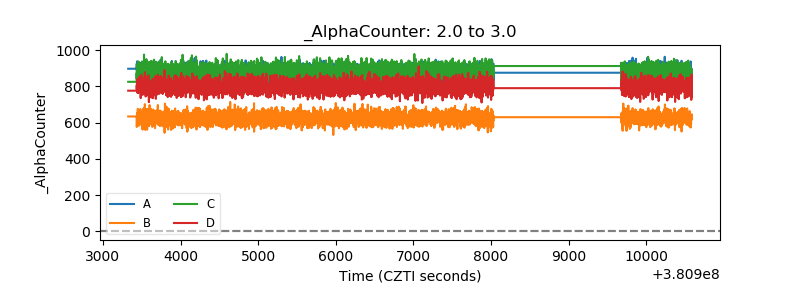 |
| _CPM_Rate | 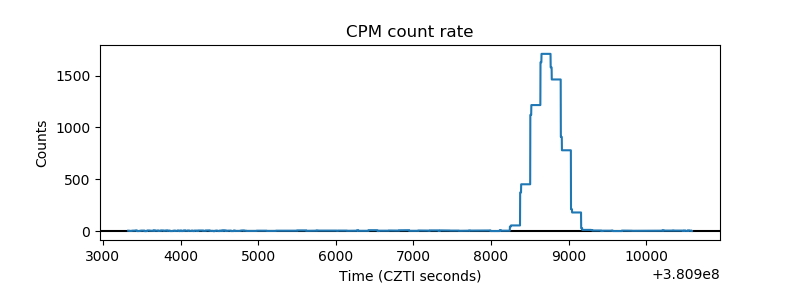 |
| CZT Counter | 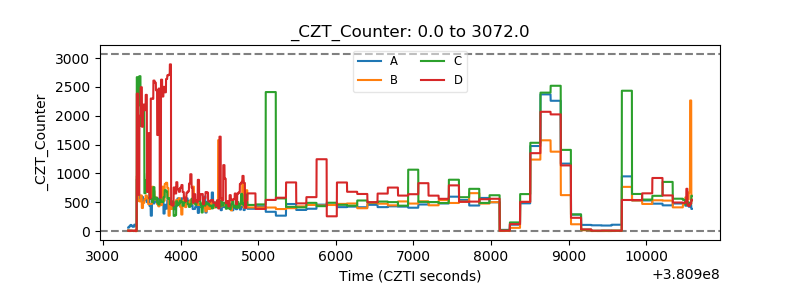 |
| +2.5 Volts monitor | 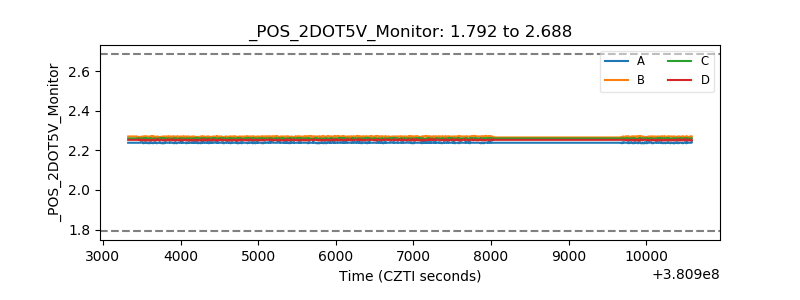 |
| +5 Volts monitor | 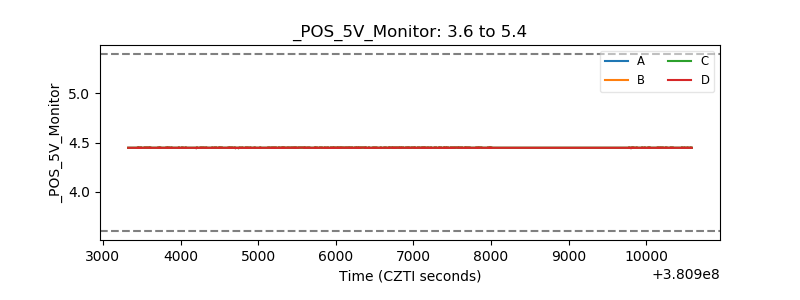 |
| _ROLL_ROT | 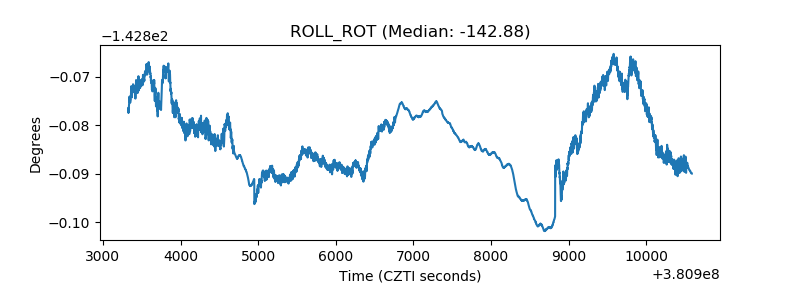 |
| _Roll_DEC | 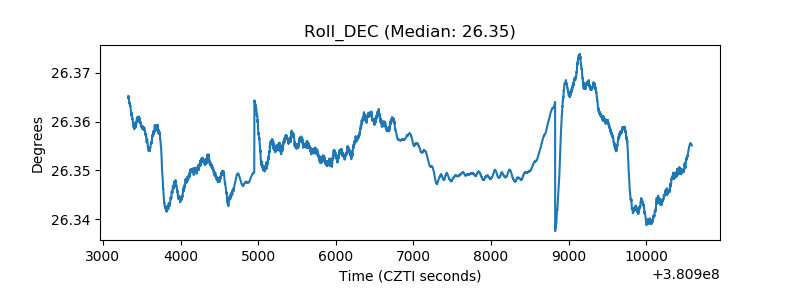 |
| _Roll_RA | 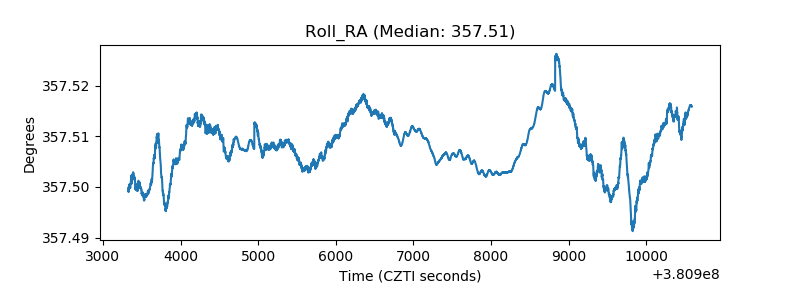 |
| Veto Counter | 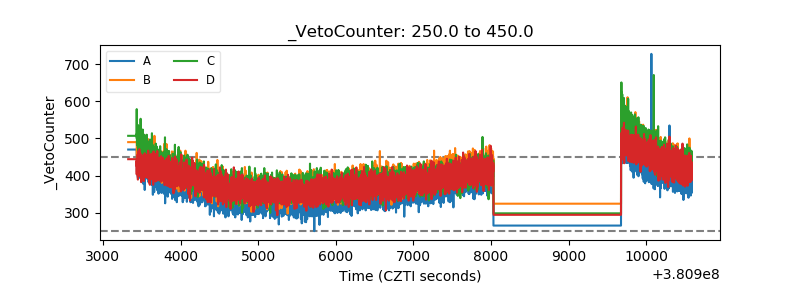 |