| Param | Original file | Final file |
|---|---|---|
| Filename | modeM0/AS1T05_003T01_9000004886_34228cztM0_level2.evt | modeM0/AS1T05_003T01_9000004886_34228cztM0_level2_quad_clean.evt |
| Size (bytes) | 1,481,132,160 | 172,811,520 |
| Size | 1.4 GB | 164.8 MB |
| Events in quadrant A | 6,991,125 | 1,113,209 |
| Events in quadrant B | 9,870,343 | 1,078,341 |
| Events in quadrant C | 9,895,545 | 1,115,620 |
| Events in quadrant D | 17,068,147 | 869,309 |
| Mode M9 | |||
|---|---|---|---|
| Quadrant | BADHDUFLAG | Total packets | Discarded packets |
| A | 0 | 43 | 0 |
| B | 0 | 43 | 0 |
| C | 0 | 43 | 0 |
| D | 0 | 43 | 0 |
| Mode SS | |||
|---|---|---|---|
| Quadrant | BADHDUFLAG | Total packets | Discarded packets |
| A | 0 | 312 | 0 |
| B | 0 | 312 | 0 |
| C | 0 | 312 | 0 |
| D | 0 | 312 | 0 |
| Mode M0 | |||
|---|---|---|---|
| Quadrant | BADHDUFLAG | Total packets | Discarded packets |
| A | 0 | 31132 | 4 |
| B | 0 | 39114 | 3 |
| C | 0 | 39353 | 3 |
| D | 0 | 61047 | 3 |
| Quadrant | Total seconds | Saturated seconds | Saturation percentage |
|---|---|---|---|
| A | 15299 | 29 | 0.189555% |
| B | 15299 | 893 | 5.836983% |
| C | 15299 | 392 | 2.562259% |
| D | 15299 | 3331 | 21.772665% |
Noise dominated data is calculated using 1-second bins in cleaned event files. If a bin has >2000 counts, and if more than 50% of those come from <1% of pixels, then it is considered to be noise-dominated and hence unusable.
| Quadrant | # 1 sec bins | Bins with >0 counts | Bins with >2000 counts | High rate bins dominated by noise | Noise dominated (total time) | Noise dominated (detector-on time) | Marked lightcurve |
|---|---|---|---|---|---|---|---|
| A | 19596 | 15302 | 8 | 8 | 0.04% | 0.05% | 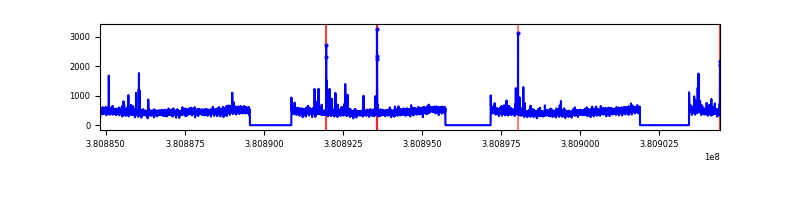 |
| B | 19596 | 15302 | 615 | 615 | 3.14% | 4.02% | 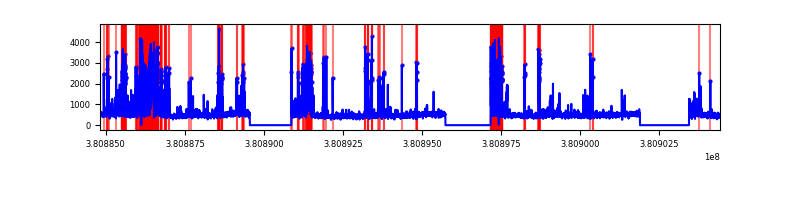 |
| C | 19596 | 15302 | 302 | 302 | 1.54% | 1.97% |  |
| D | 19596 | 15301 | 2895 | 2895 | 14.77% | 18.92% | 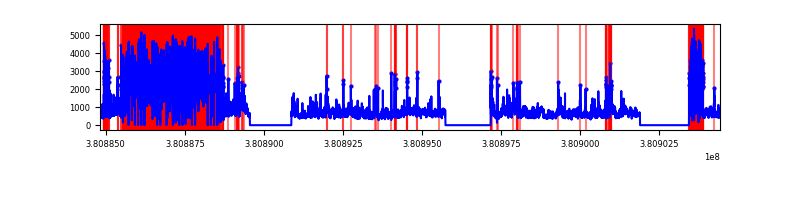 |
Top three noisy pixels from each quadrant. If the there are fewer than three noisy pixels in the level2.evt file, extra rows are filled as -1
| Pixel properties | Quadrant properties | ||||||
|---|---|---|---|---|---|---|---|
| Quadrant | DetID | PixID | Counts | Sigma | Mean | Median | Sigma |
| A | 9 | 143 | 103088 | 292.61 | 1744 | 1709 | 346.5 |
| A | 13 | 6 | 48813 | 135.95 | 1744 | 1709 | 346.5 |
| A | 10 | 83 | 41161 | 113.87 | 1744 | 1709 | 346.5 |
| B | 5 | 172 | 1916608 | 5865.78 | 1705 | 1662 | 326.5 |
| B | 5 | 31 | 561393 | 1714.55 | 1705 | 1662 | 326.5 |
| B | 0 | 190 | 135784 | 410.84 | 1705 | 1662 | 326.5 |
| C | 7 | 220 | 789211 | 2024.32 | 1703 | 1720 | 389.0 |
| C | 15 | 214 | 647362 | 1659.69 | 1703 | 1720 | 389.0 |
| C | 14 | 254 | 502707 | 1287.84 | 1703 | 1720 | 389.0 |
| D | 1 | 52 | 7437318 | 20507.64 | 1483 | 1444 | 362.6 |
| D | 8 | 195 | 2531573 | 6977.92 | 1483 | 1444 | 362.6 |
| D | 7 | 80 | 457621 | 1258.1 | 1483 | 1444 | 362.6 |
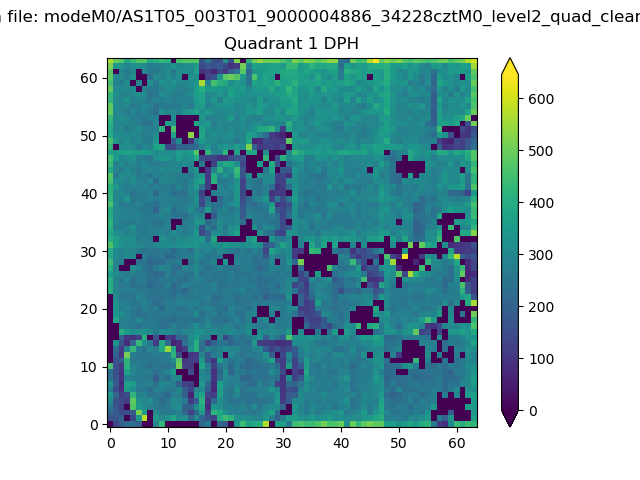
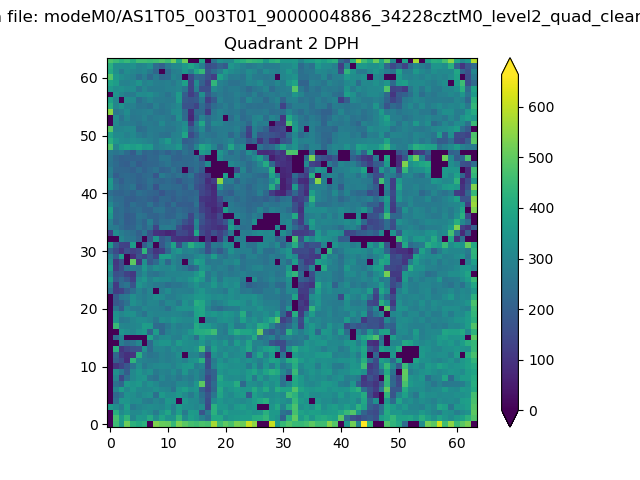
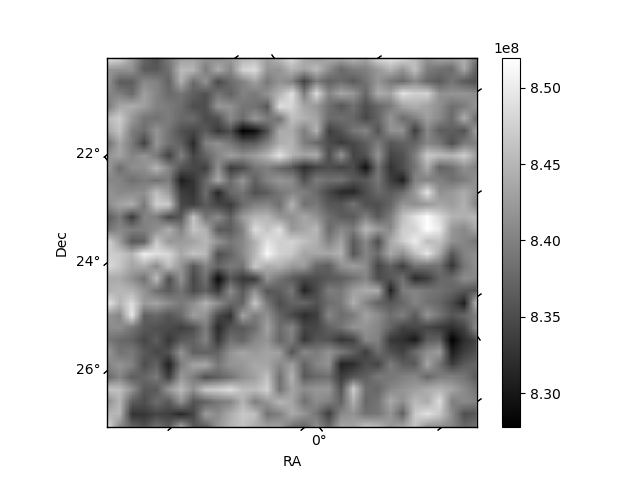
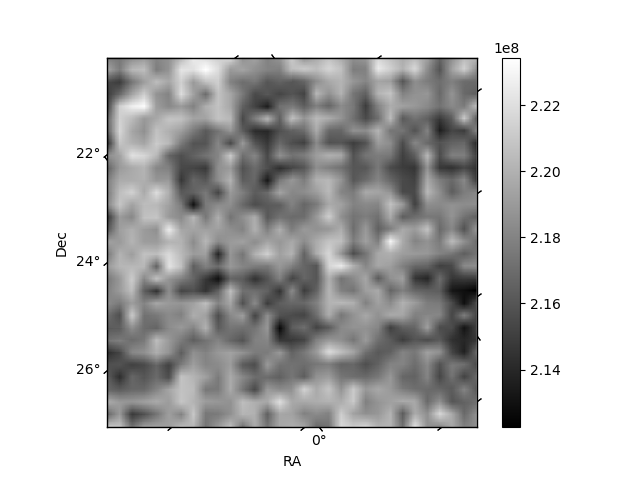
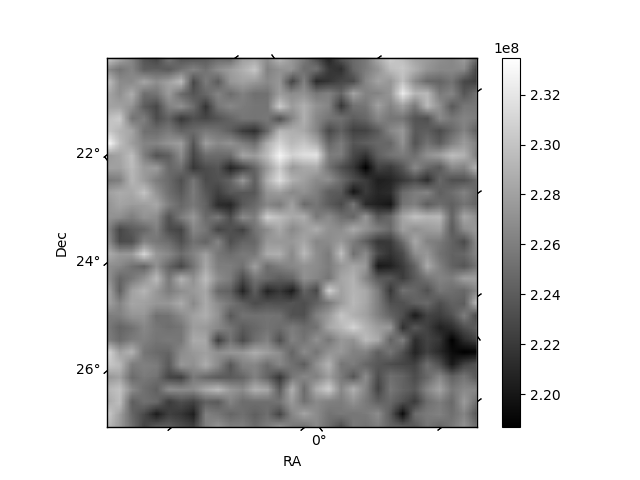
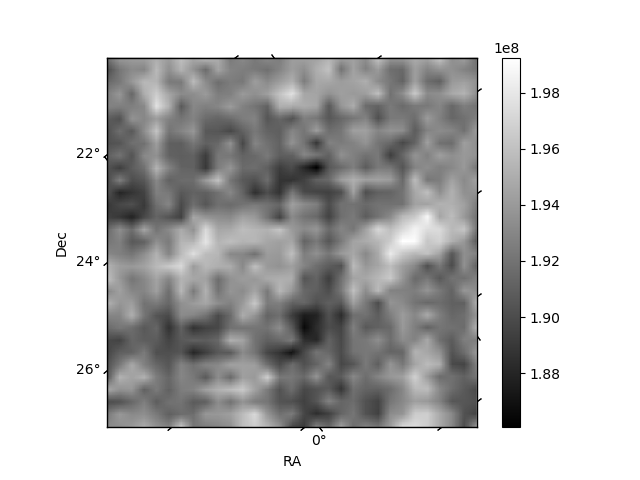
Histogram calculated using DETX and DETY for each event in the final _common_clean file
| Quadrant A | 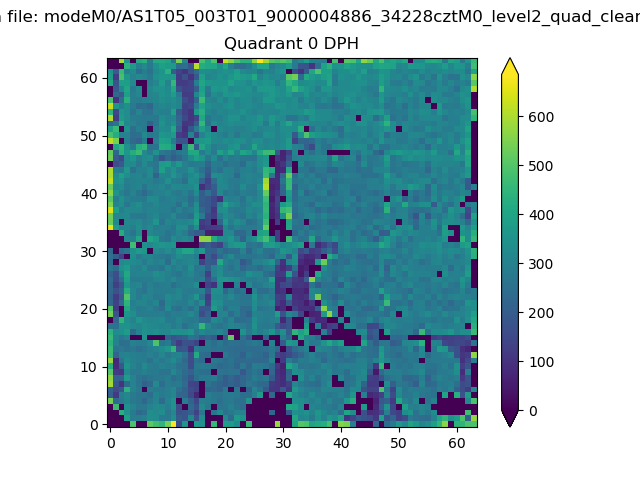 |
 |
Quadrant B |
|---|---|---|---|
| Quadrant D | 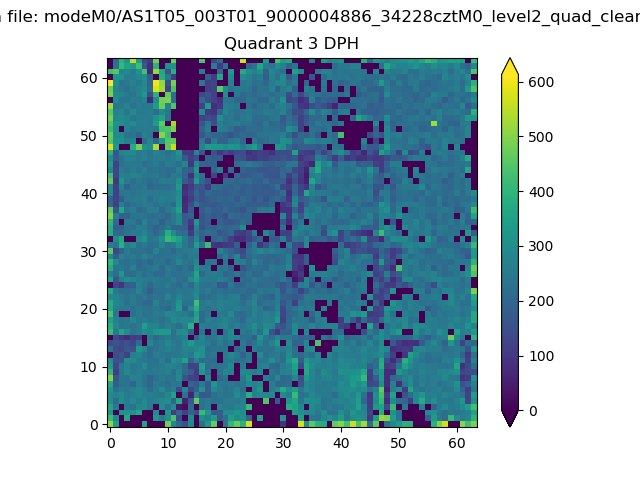 |
 |
Quadrant C |
| Plot type | Count rate plots | Images |
|---|---|---|
| Comparison with Poisson distribution Blue bars denote a histogram of data divided into 1 sec bins. Red curve is a Poisson curve with rate = median count rate of data. |
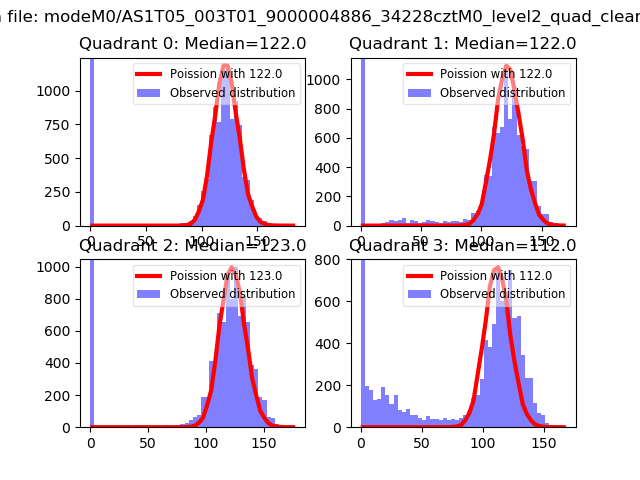 |
 |
| Quadrant-wise count rates Data is divided into 100 sec bins |
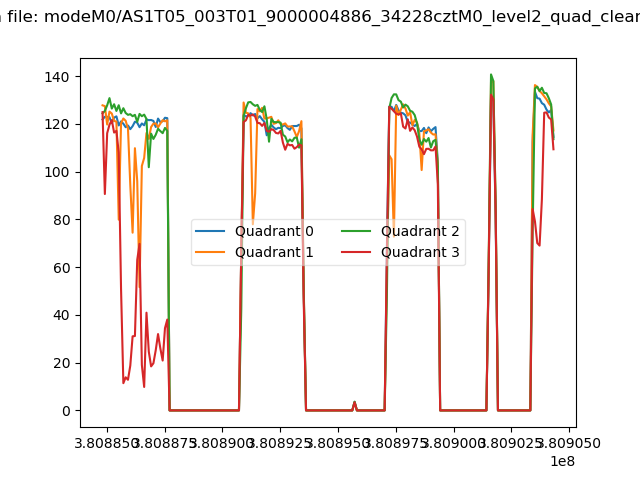 |
|
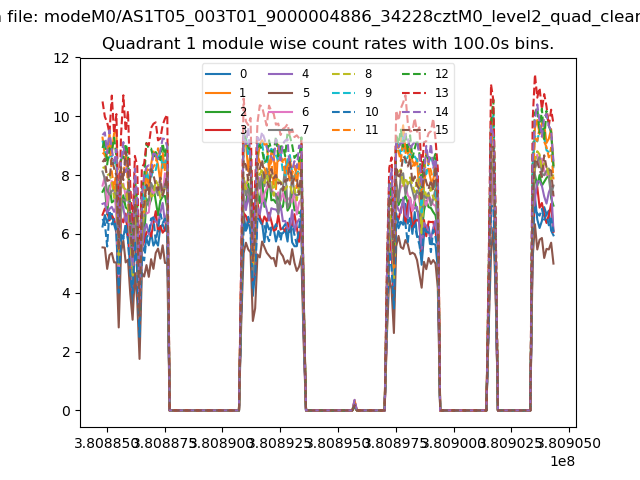
| Module-wise count rates for Quadrant A Data is divided into 100 sec bins |
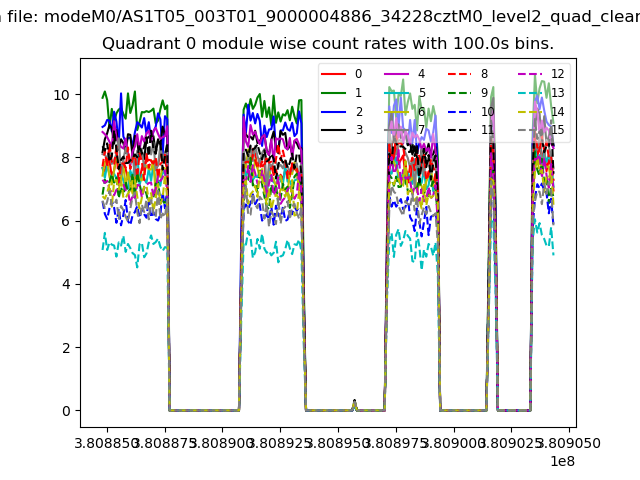 |
 |
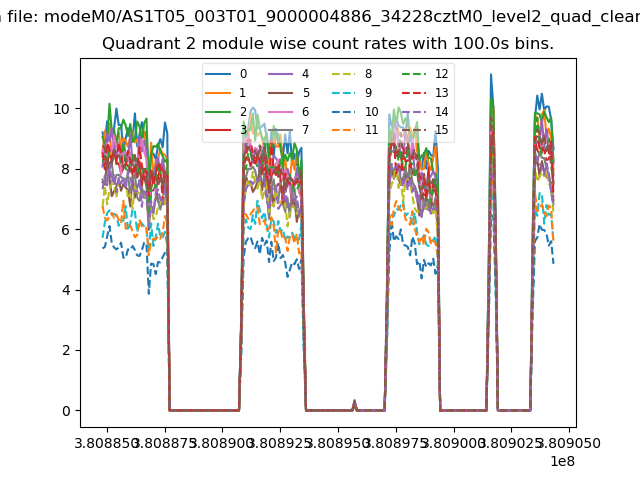
| Module-wise count rates for Quadrant B Data is divided into 100 sec bins |
 |
 |
| Module-wise count rates for Quadrant C Data is divided into 100 sec bins |
 |
 |
| Module-wise count rates for Quadrant D Data is divided into 100 sec bins |
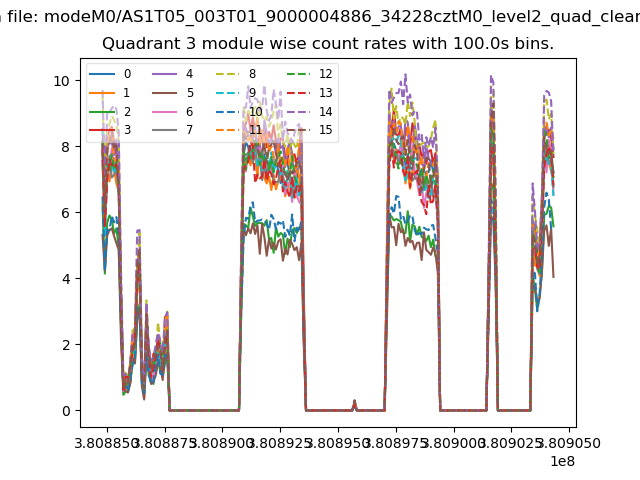 |
 |
| Parameter | Plot |
|---|---|
| CZT HV Monitor | 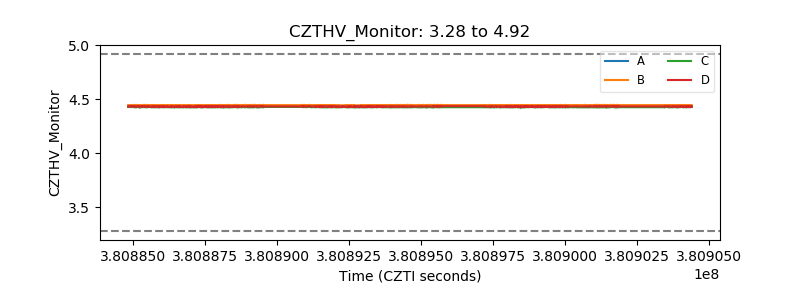 |
| D_VDD | 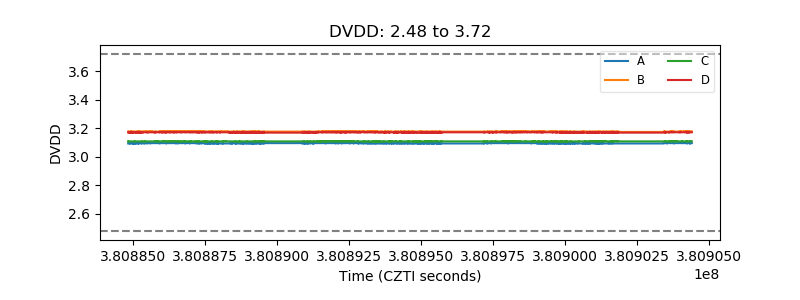 |
| Temperature 1 | 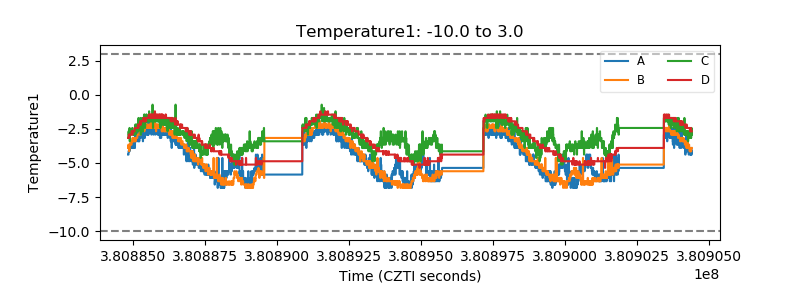 |
| Veto HV Monitor | 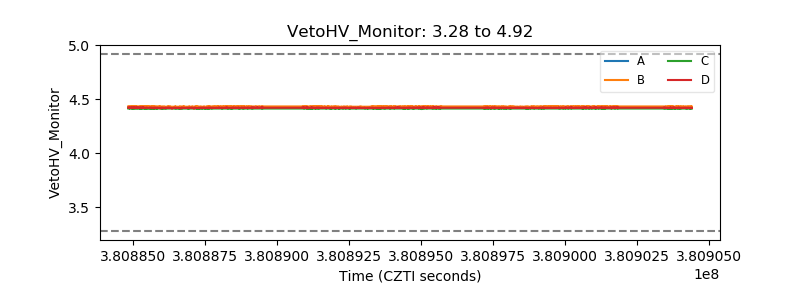 |
| Veto LLD | 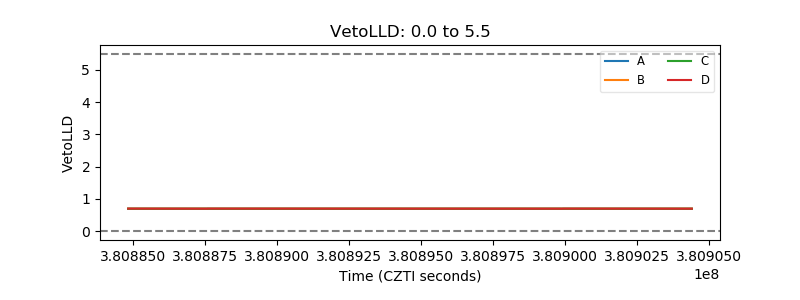 |
| Alpha Counter | 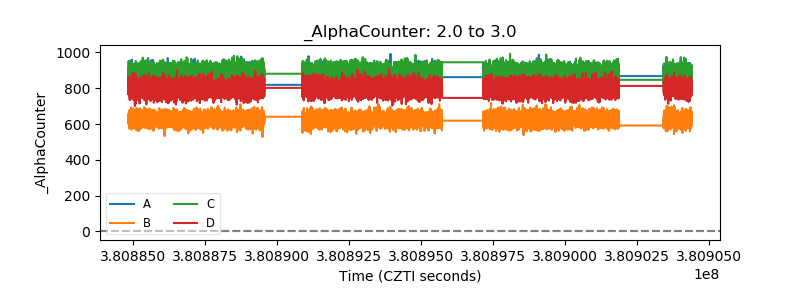 |
| _CPM_Rate | 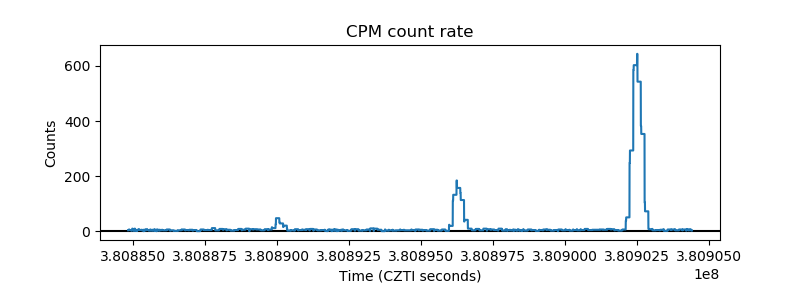 |
| CZT Counter | 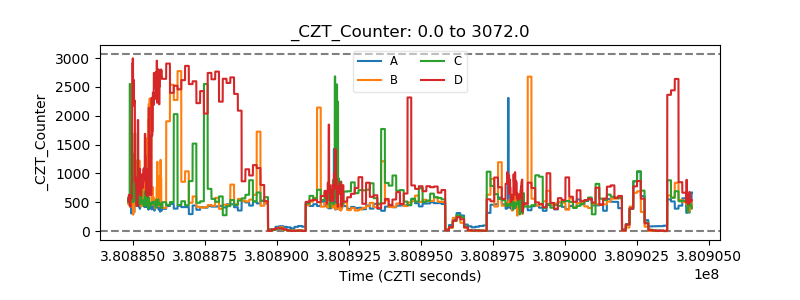 |
| +2.5 Volts monitor | 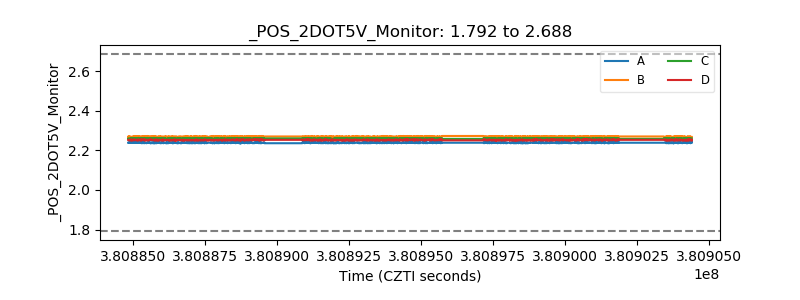 |
| +5 Volts monitor | 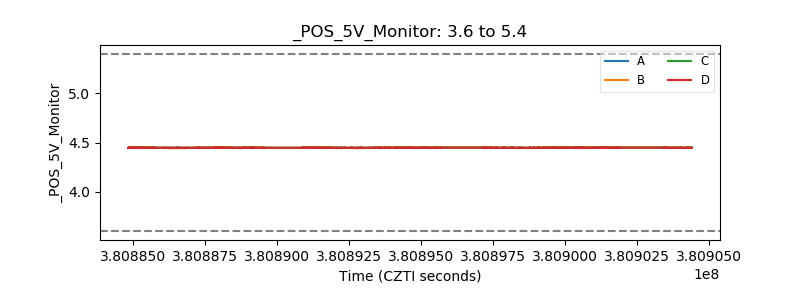 |
| _ROLL_ROT | 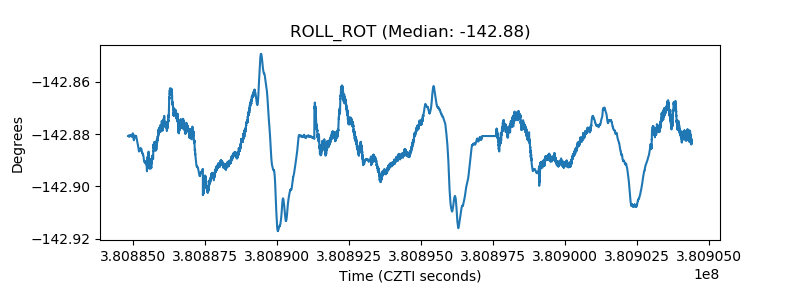 |
| _Roll_DEC | 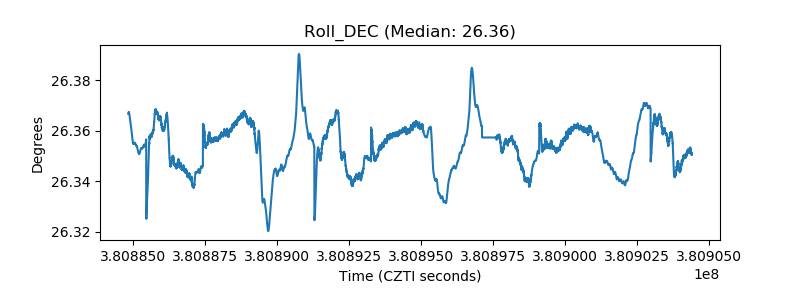 |
| _Roll_RA | 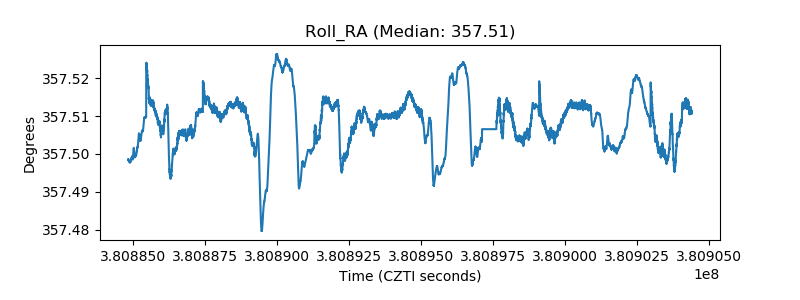 |
| Veto Counter | 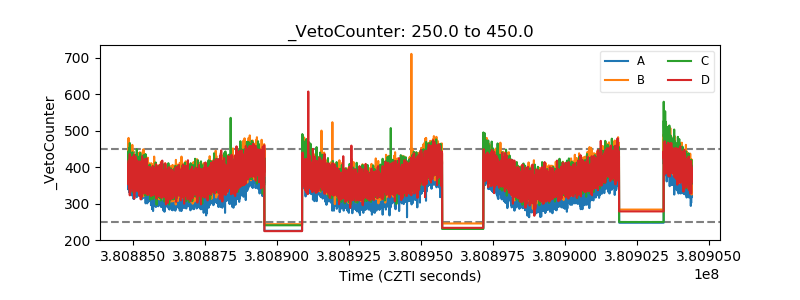 |