| Param | Original file | Final file |
|---|---|---|
| Filename | modeM0/AS1T05_003T01_9000004886_34225cztM0_level2.evt | modeM0/AS1T05_003T01_9000004886_34225cztM0_level2_quad_clean.evt |
| Size (bytes) | 548,732,160 | 85,322,880 |
| Size | 523.3 MB | 81.4 MB |
| Events in quadrant A | 2,771,423 | 550,194 |
| Events in quadrant B | 4,460,379 | 540,428 |
| Events in quadrant C | 3,568,364 | 560,846 |
| Events in quadrant D | 5,416,010 | 517,054 |
| Mode M9 | |||
|---|---|---|---|
| Quadrant | BADHDUFLAG | Total packets | Discarded packets |
| A | 0 | 15 | 0 |
| B | 0 | 15 | 0 |
| C | 0 | 15 | 0 |
| D | 0 | 16 | 0 |
| Mode SS | |||
|---|---|---|---|
| Quadrant | BADHDUFLAG | Total packets | Discarded packets |
| A | 0 | 120 | 0 |
| B | 0 | 120 | 0 |
| C | 0 | 120 | 0 |
| D | 0 | 120 | 0 |
| Mode M0 | |||
|---|---|---|---|
| Quadrant | BADHDUFLAG | Total packets | Discarded packets |
| A | 0 | 12177 | 2 |
| B | 0 | 17105 | 1 |
| C | 0 | 14287 | 1 |
| D | 0 | 20234 | 1 |
| Quadrant | Total seconds | Saturated seconds | Saturation percentage |
|---|---|---|---|
| A | 5942 | 6 | 0.100976% |
| B | 5942 | 410 | 6.900034% |
| C | 5942 | 141 | 2.372938% |
| D | 5942 | 388 | 6.529788% |
Noise dominated data is calculated using 1-second bins in cleaned event files. If a bin has >2000 counts, and if more than 50% of those come from <1% of pixels, then it is considered to be noise-dominated and hence unusable.
| Quadrant | # 1 sec bins | Bins with >0 counts | Bins with >2000 counts | High rate bins dominated by noise | Noise dominated (total time) | Noise dominated (detector-on time) | Marked lightcurve |
|---|---|---|---|---|---|---|---|
| A | 7225 | 5943 | 3 | 3 | 0.04% | 0.05% | 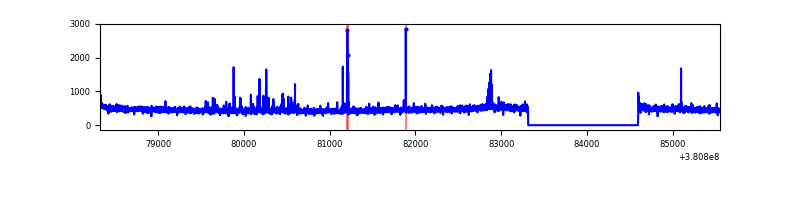 |
| B | 7225 | 5943 | 306 | 306 | 4.24% | 5.15% | 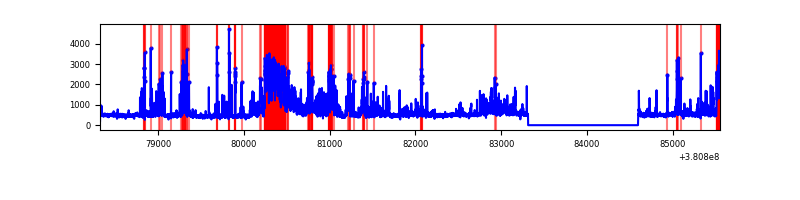 |
| C | 7225 | 5943 | 85 | 85 | 1.18% | 1.43% | 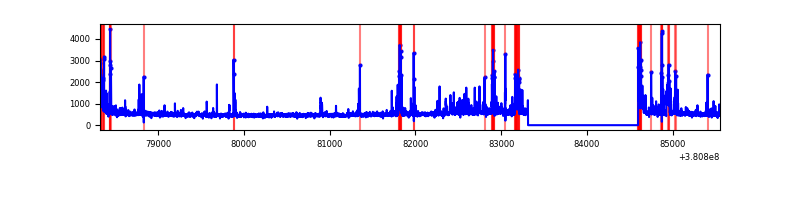 |
| D | 7225 | 5943 | 335 | 335 | 4.64% | 5.64% | 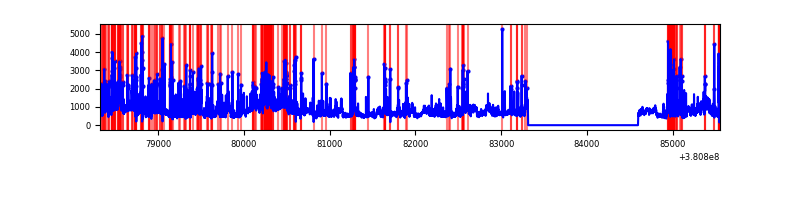 |
Top three noisy pixels from each quadrant. If the there are fewer than three noisy pixels in the level2.evt file, extra rows are filled as -1
| Pixel properties | Quadrant properties | ||||||
|---|---|---|---|---|---|---|---|
| Quadrant | DetID | PixID | Counts | Sigma | Mean | Median | Sigma |
| A | 9 | 143 | 79534 | 570.55 | 684 | 671 | 138.2 |
| A | 10 | 83 | 22964 | 161.28 | 684 | 671 | 138.2 |
| A | 13 | 6 | 14967 | 103.43 | 684 | 671 | 138.2 |
| B | 5 | 172 | 1282894 | 9993.88 | 666 | 649 | 128.3 |
| B | 5 | 31 | 278645 | 2166.71 | 666 | 649 | 128.3 |
| B | 5 | 255 | 108838 | 843.23 | 666 | 649 | 128.3 |
| C | 15 | 214 | 257707 | 1687.31 | 663 | 670 | 152.3 |
| C | 4 | 254 | 231202 | 1513.32 | 663 | 670 | 152.3 |
| C | 14 | 254 | 193038 | 1262.79 | 663 | 670 | 152.3 |
| D | 8 | 195 | 1116646 | 7024.46 | 657 | 640 | 158.9 |
| D | 1 | 52 | 634305 | 3988.47 | 657 | 640 | 158.9 |
| D | 7 | 80 | 280962 | 1764.43 | 657 | 640 | 158.9 |
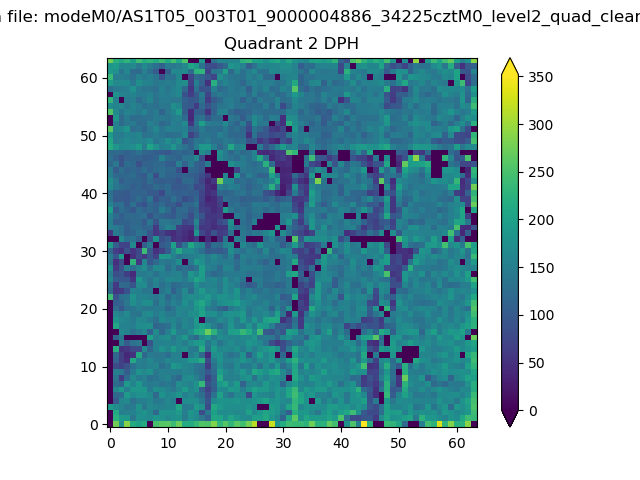
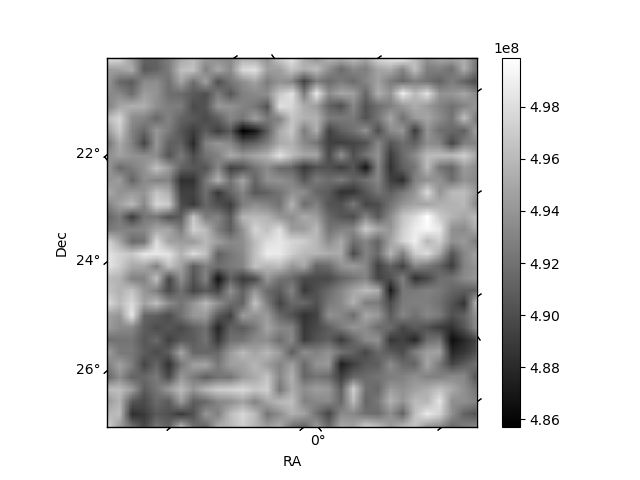
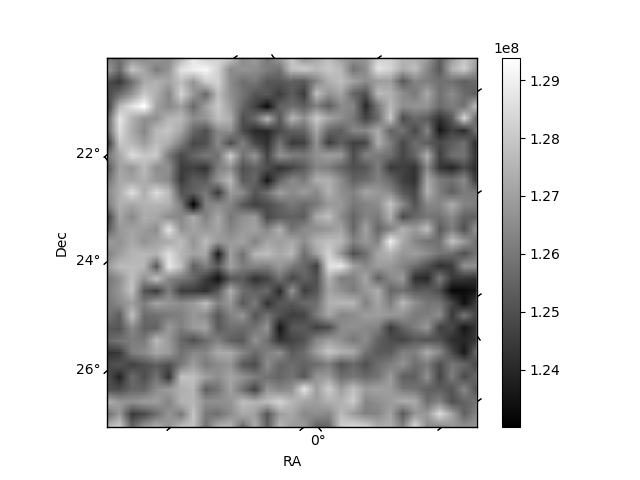
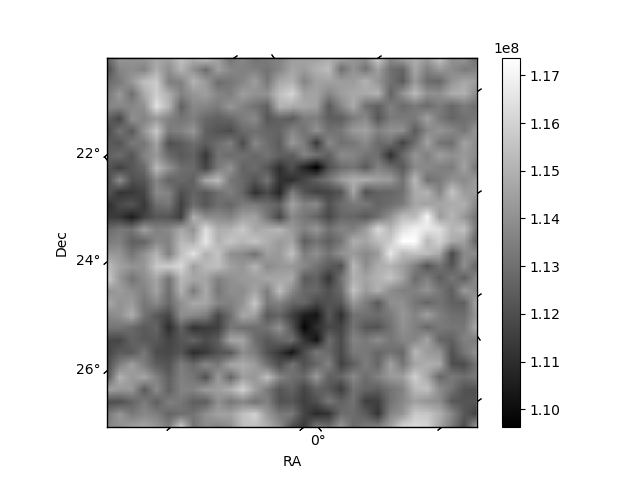
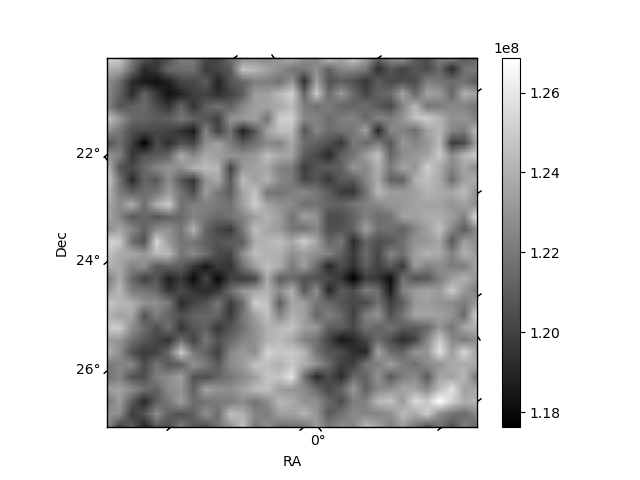
Histogram calculated using DETX and DETY for each event in the final _common_clean file
| Quadrant A | 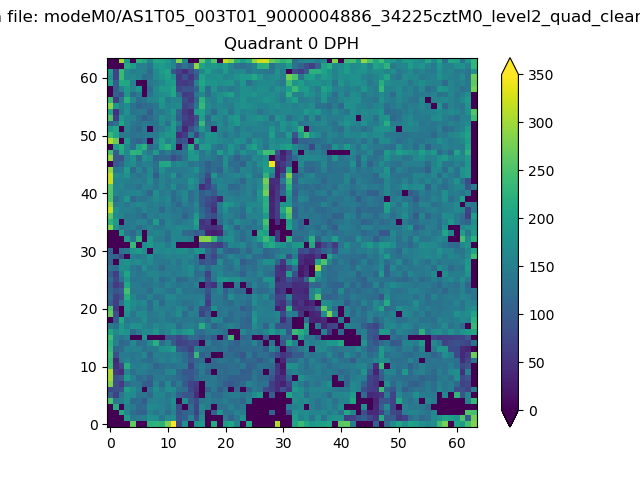 |
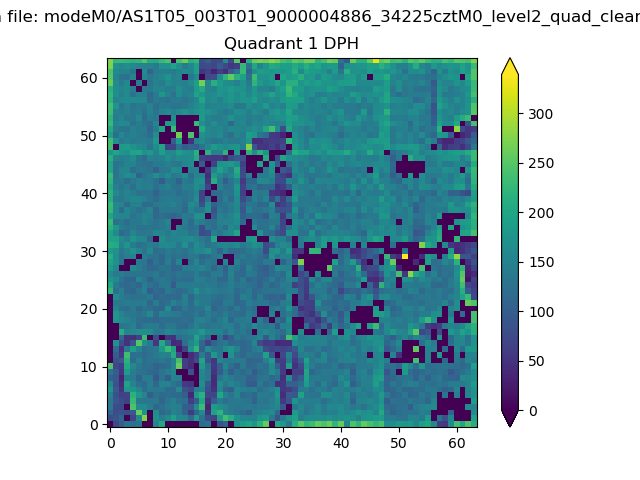 |
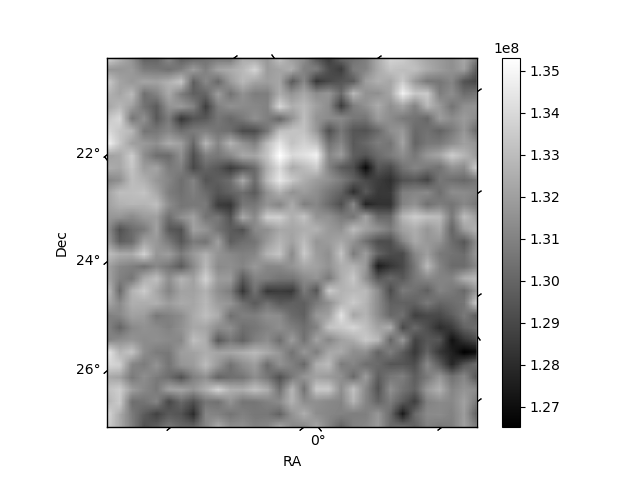
Quadrant B |
|---|---|---|---|
| Quadrant D | 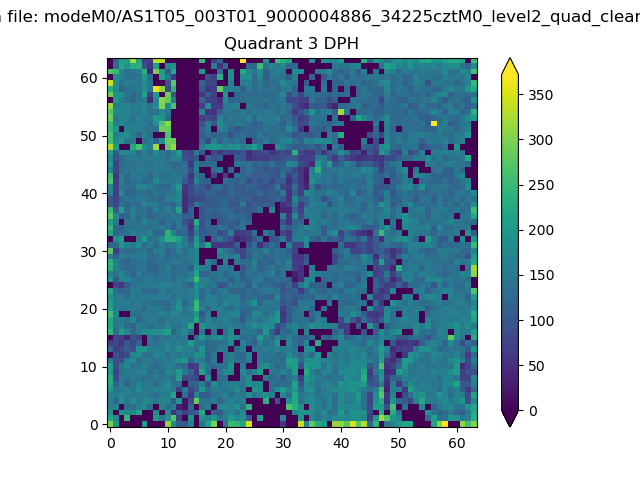 |
 |
Quadrant C |
| Plot type | Count rate plots | Images |
|---|---|---|
| Comparison with Poisson distribution Blue bars denote a histogram of data divided into 1 sec bins. Red curve is a Poisson curve with rate = median count rate of data. |
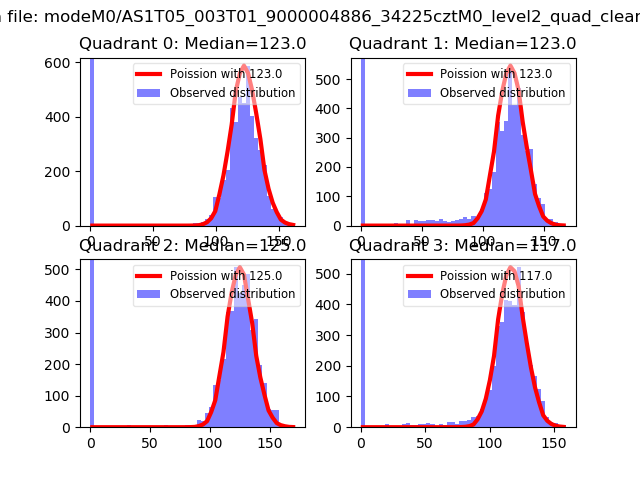 |
 |
| Quadrant-wise count rates Data is divided into 100 sec bins |
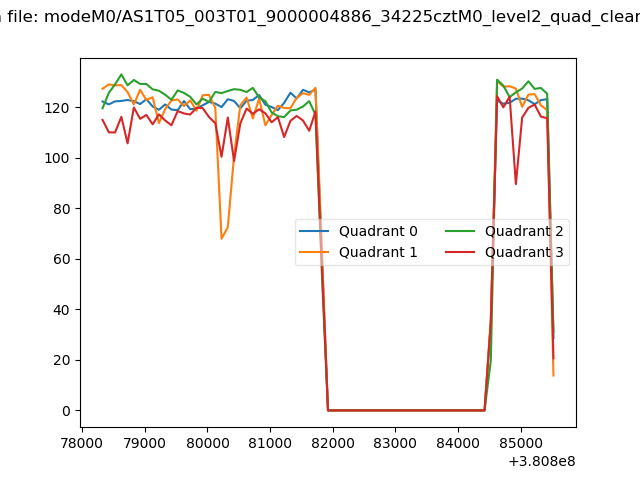 |
|
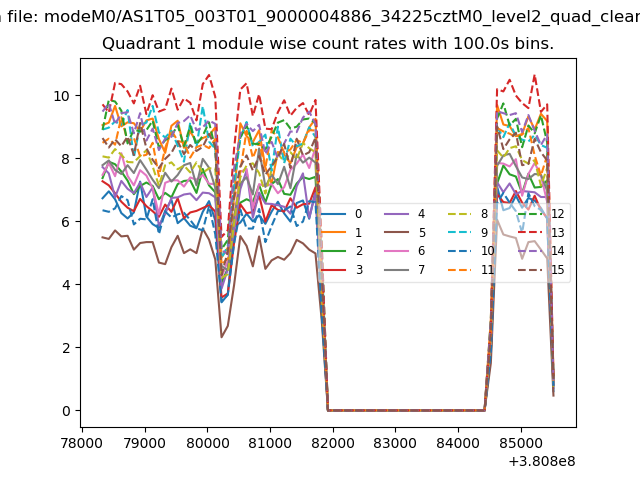
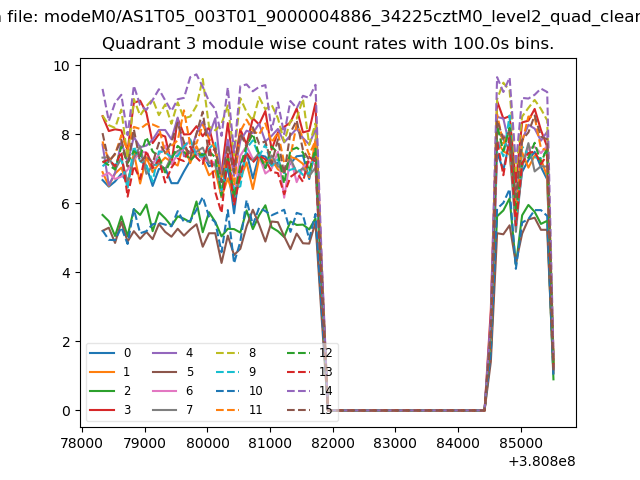
| Module-wise count rates for Quadrant A Data is divided into 100 sec bins |
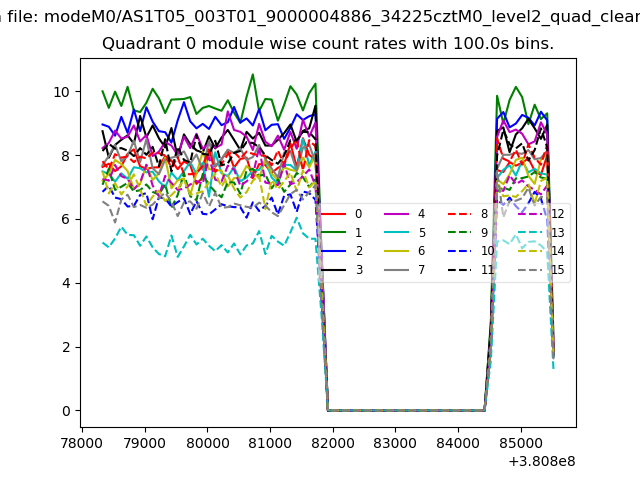 |
 |
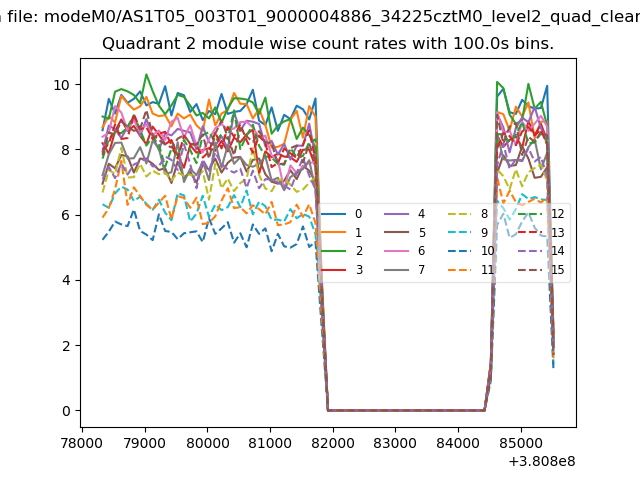
| Module-wise count rates for Quadrant B Data is divided into 100 sec bins |
 |
 |
| Module-wise count rates for Quadrant C Data is divided into 100 sec bins |
 |
 |
| Module-wise count rates for Quadrant D Data is divided into 100 sec bins |
 |
 |
| Parameter | Plot |
|---|---|
| CZT HV Monitor | 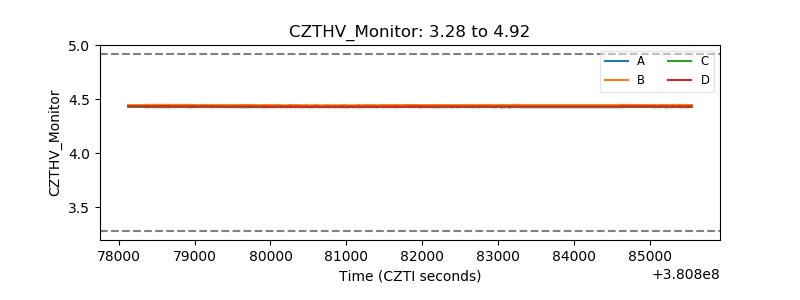 |
| D_VDD | 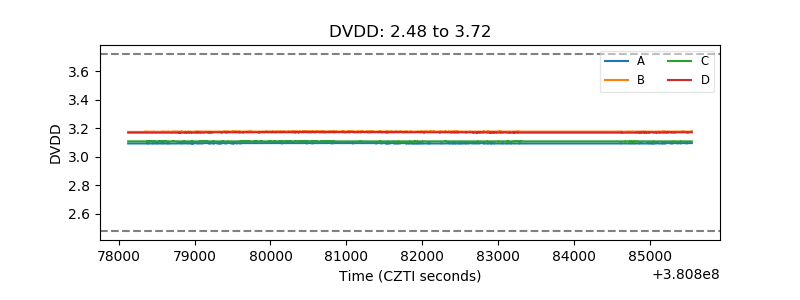 |
| Temperature 1 | 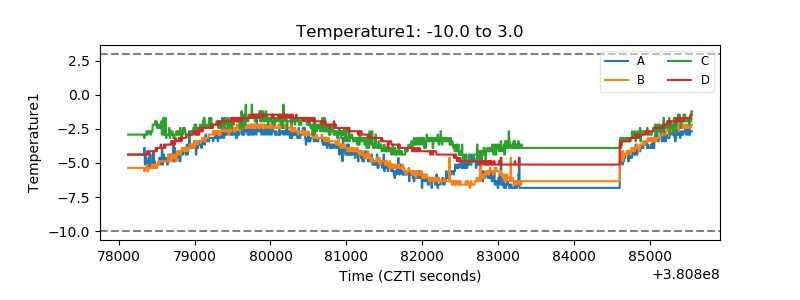 |
| Veto HV Monitor |  |
| Veto LLD | 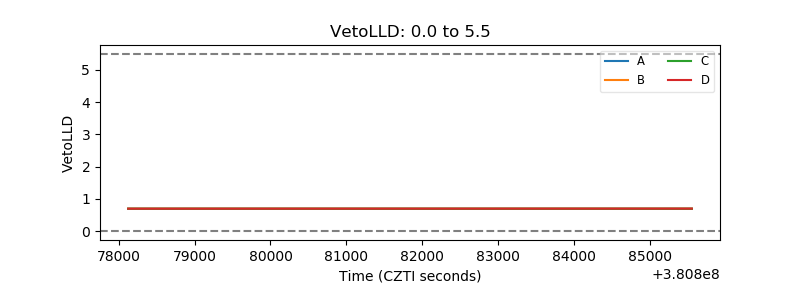 |
| Alpha Counter | 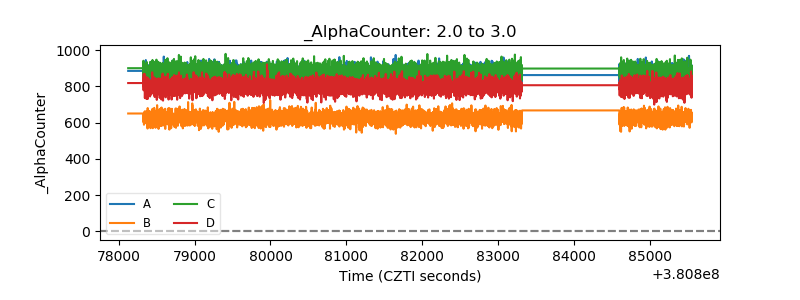 |
| _CPM_Rate | 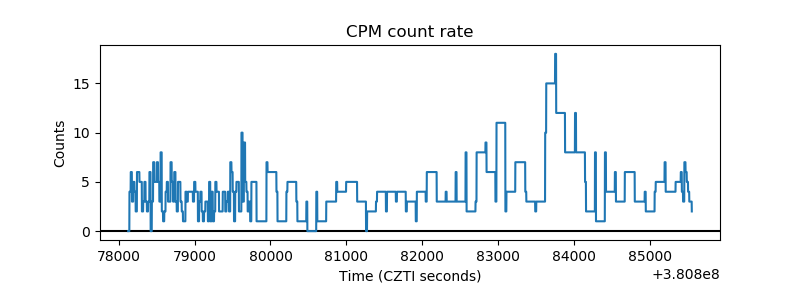 |
| CZT Counter | 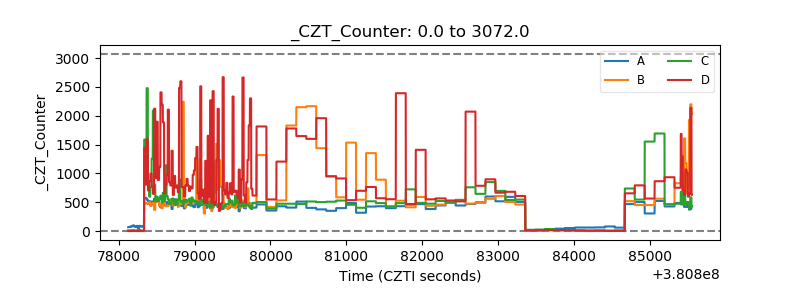 |
| +2.5 Volts monitor | 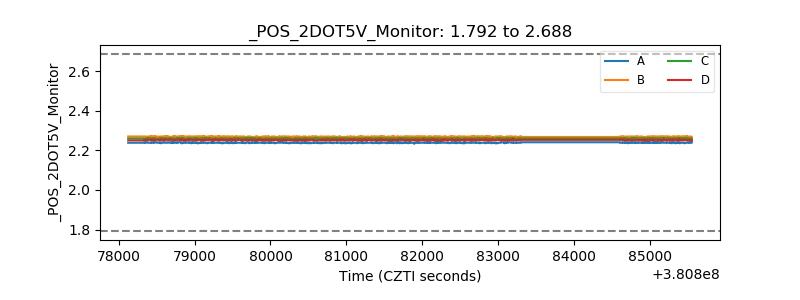 |
| +5 Volts monitor | 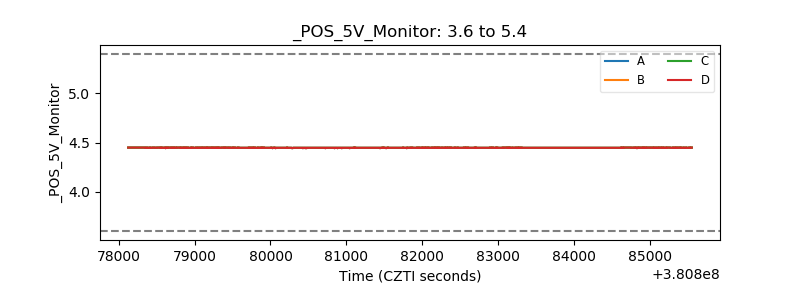 |
| _ROLL_ROT | 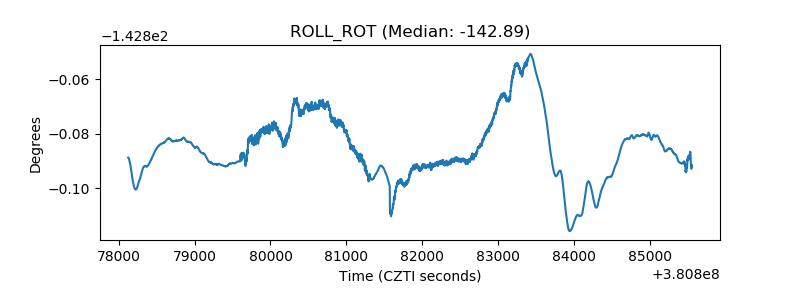 |
| _Roll_DEC | 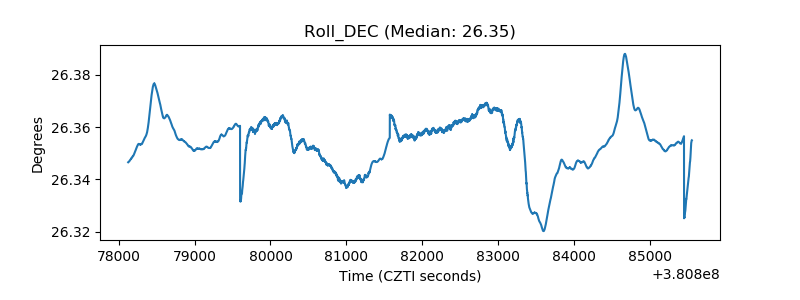 |
| _Roll_RA | 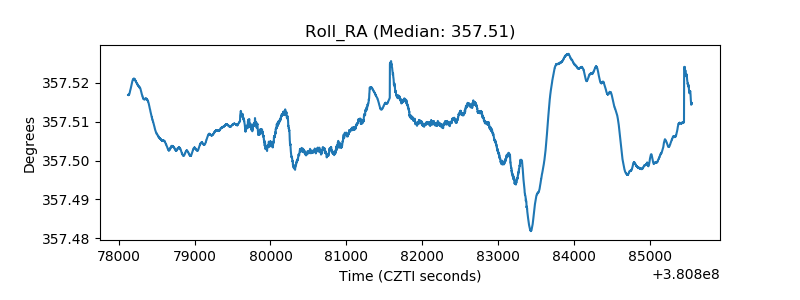 |
| Veto Counter | 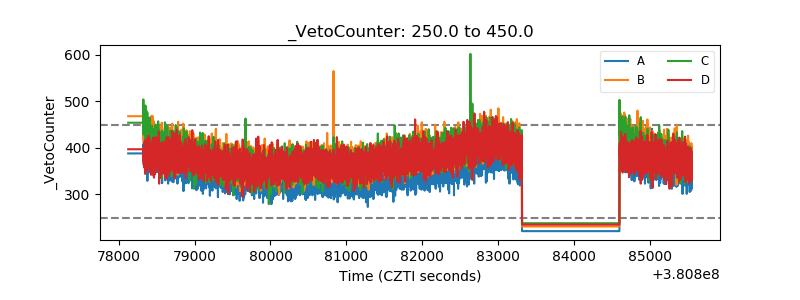 |