| Param | Original file | Final file |
|---|---|---|
| Filename | modeM0/AS1T05_003T01_9000004886_34223cztM0_level2.evt | modeM0/AS1T05_003T01_9000004886_34223cztM0_level2_quad_clean.evt |
| Size (bytes) | 560,856,960 | 81,544,320 |
| Size | 534.9 MB | 77.8 MB |
| Events in quadrant A | 2,962,706 | 533,012 |
| Events in quadrant B | 6,470,766 | 478,520 |
| Events in quadrant C | 3,150,657 | 551,090 |
| Events in quadrant D | 4,028,047 | 520,169 |
| Mode M9 | |||
|---|---|---|---|
| Quadrant | BADHDUFLAG | Total packets | Discarded packets |
| A | 0 | 28 | 0 |
| B | 0 | 28 | 0 |
| C | 0 | 28 | 0 |
| D | 0 | 29 | 0 |
| Mode SS | |||
|---|---|---|---|
| Quadrant | BADHDUFLAG | Total packets | Discarded packets |
| A | 0 | 114 | 0 |
| B | 0 | 114 | 0 |
| C | 0 | 114 | 0 |
| D | 0 | 114 | 0 |
| Mode M0 | |||
|---|---|---|---|
| Quadrant | BADHDUFLAG | Total packets | Discarded packets |
| A | 0 | 12286 | 3 |
| B | 0 | 22860 | 2 |
| C | 0 | 12634 | 2 |
| D | 0 | 15609 | 2 |
| Quadrant | Total seconds | Saturated seconds | Saturation percentage |
|---|---|---|---|
| A | 5509 | 64 | 1.161735% |
| B | 5509 | 1295 | 23.506989% |
| C | 5509 | 63 | 1.143583% |
| D | 5509 | 96 | 1.742603% |
Noise dominated data is calculated using 1-second bins in cleaned event files. If a bin has >2000 counts, and if more than 50% of those come from <1% of pixels, then it is considered to be noise-dominated and hence unusable.
| Quadrant | # 1 sec bins | Bins with >0 counts | Bins with >2000 counts | High rate bins dominated by noise | Noise dominated (total time) | Noise dominated (detector-on time) | Marked lightcurve |
|---|---|---|---|---|---|---|---|
| A | 7122 | 5510 | 43 | 43 | 0.60% | 0.78% | 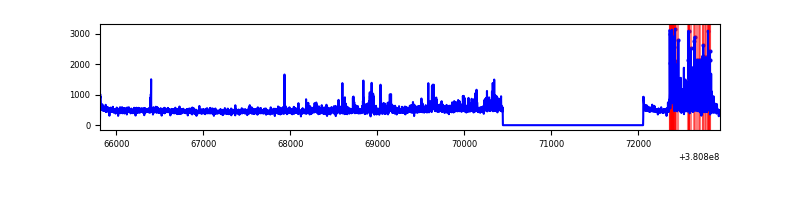 |
| B | 7122 | 5510 | 1089 | 1089 | 15.29% | 19.76% | 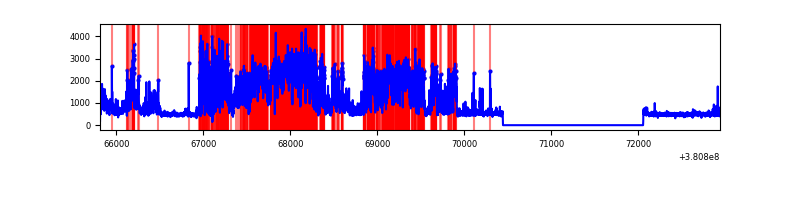 |
| C | 7122 | 5510 | 56 | 56 | 0.79% | 1.02% | 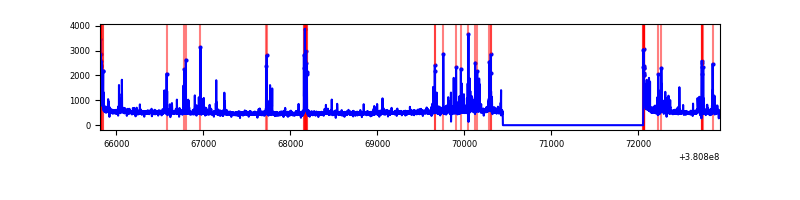 |
| D | 7122 | 5510 | 94 | 94 | 1.32% | 1.71% | 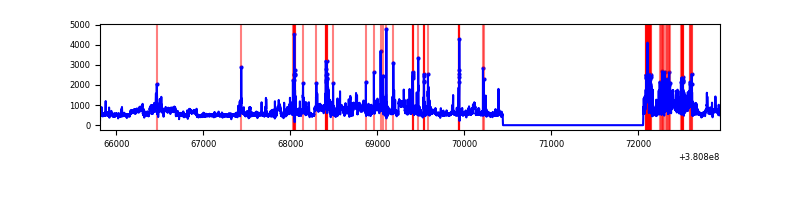 |
Top three noisy pixels from each quadrant. If the there are fewer than three noisy pixels in the level2.evt file, extra rows are filled as -1
| Pixel properties | Quadrant properties | ||||||
|---|---|---|---|---|---|---|---|
| Quadrant | DetID | PixID | Counts | Sigma | Mean | Median | Sigma |
| A | 15 | 47 | 427669 | 3321.61 | 640 | 626 | 128.6 |
| A | 10 | 83 | 23028 | 174.25 | 640 | 626 | 128.6 |
| A | 9 | 143 | 19510 | 146.88 | 640 | 626 | 128.6 |
| B | 5 | 31 | 2255713 | 19830.22 | 592 | 576 | 113.7 |
| B | 5 | 15 | 820372 | 7208.76 | 592 | 576 | 113.7 |
| B | 5 | 172 | 815596 | 7166.76 | 592 | 576 | 113.7 |
| C | 15 | 214 | 242433 | 1659.59 | 628 | 633 | 145.7 |
| C | 14 | 254 | 131521 | 898.35 | 628 | 633 | 145.7 |
| C | 4 | 254 | 121363 | 828.63 | 628 | 633 | 145.7 |
| D | 8 | 195 | 844173 | 5502.53 | 628 | 610 | 153.3 |
| D | 7 | 80 | 400908 | 2611.13 | 628 | 610 | 153.3 |
| D | 12 | 0 | 82378 | 533.37 | 628 | 610 | 153.3 |
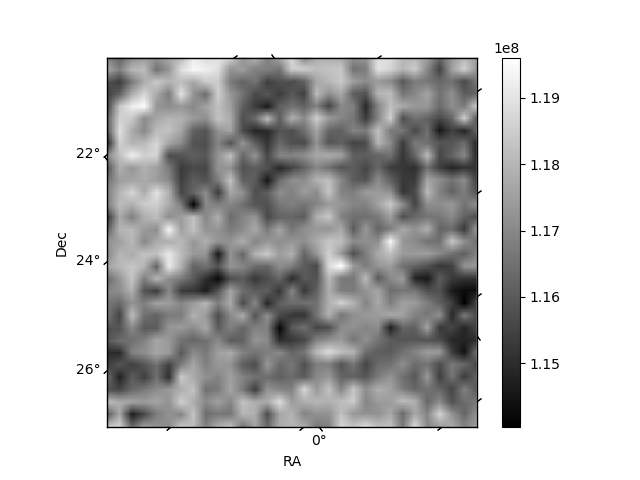
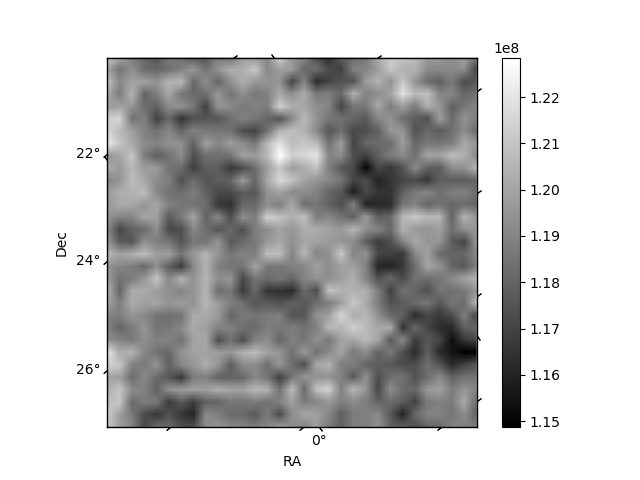
Histogram calculated using DETX and DETY for each event in the final _common_clean file
| Quadrant A | 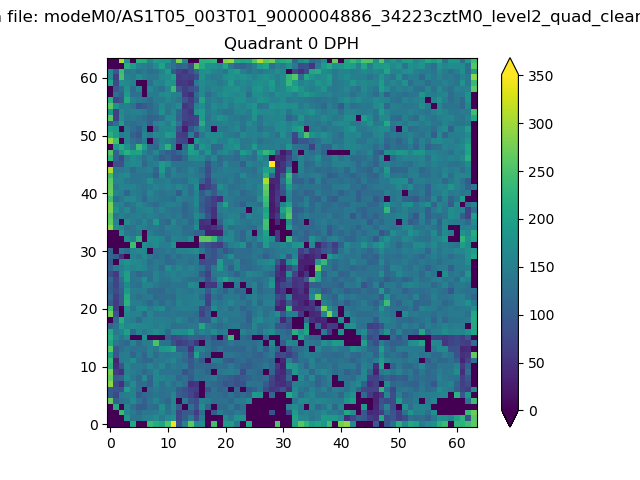 |
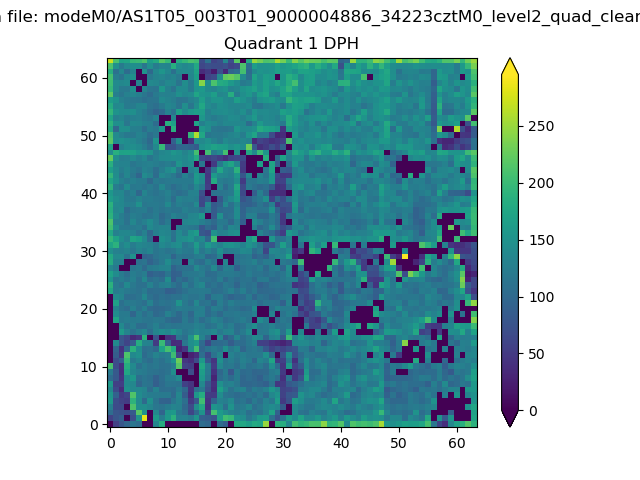 |
Quadrant B |
|---|---|---|---|
| Quadrant D | 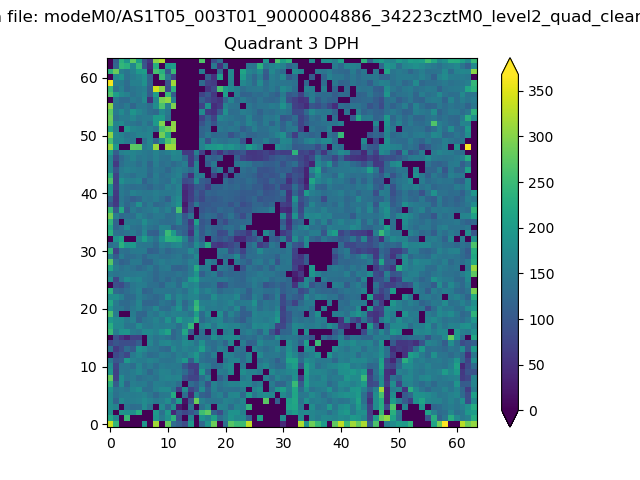 |
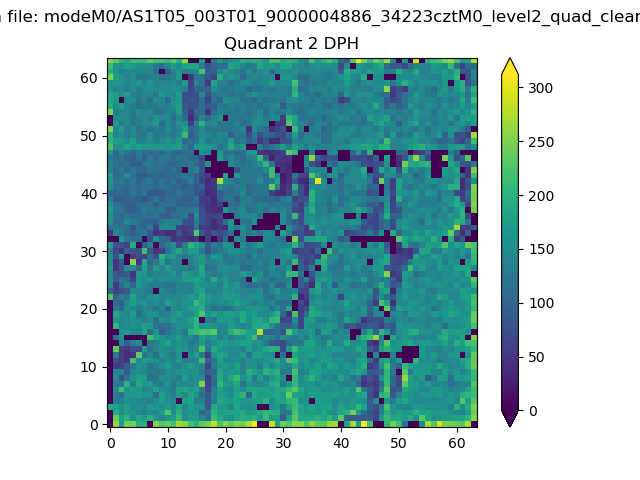 |
Quadrant C |
| Plot type | Count rate plots | Images |
|---|---|---|
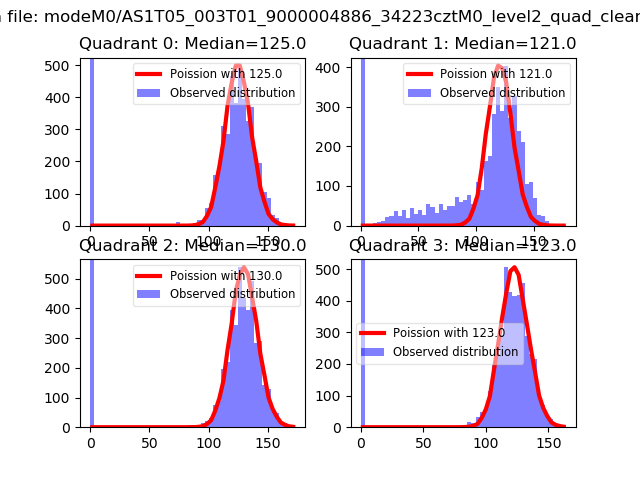
| Comparison with Poisson distribution Blue bars denote a histogram of data divided into 1 sec bins. Red curve is a Poisson curve with rate = median count rate of data. |
 |
 |
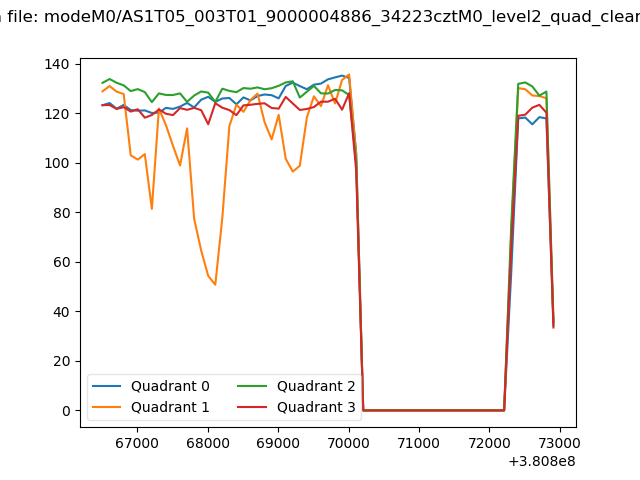
| Quadrant-wise count rates Data is divided into 100 sec bins |
 |
|
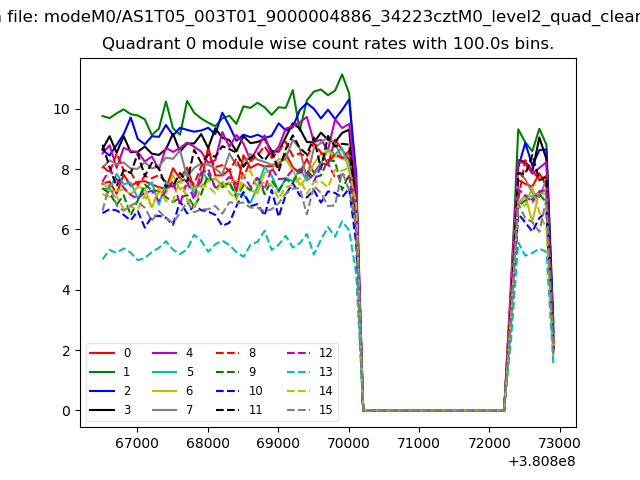
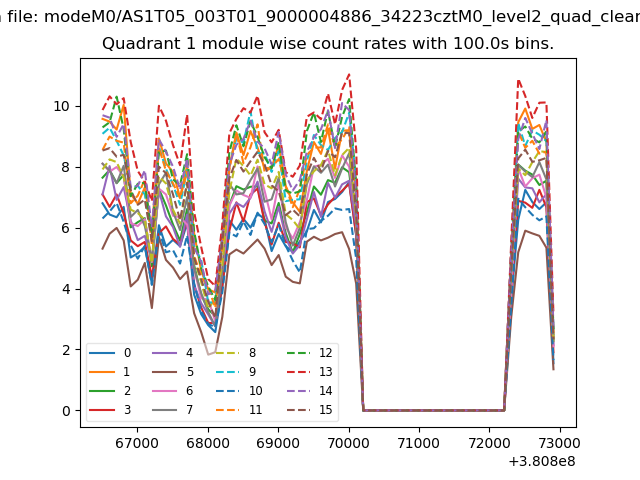
| Module-wise count rates for Quadrant A Data is divided into 100 sec bins |
 |
 |
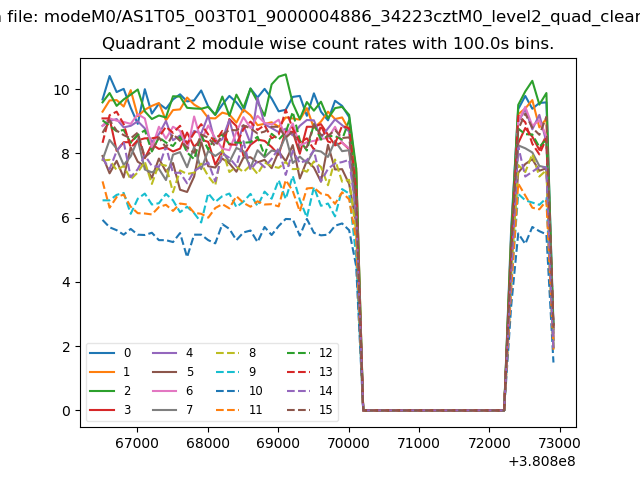
| Module-wise count rates for Quadrant B Data is divided into 100 sec bins |
 |
 |
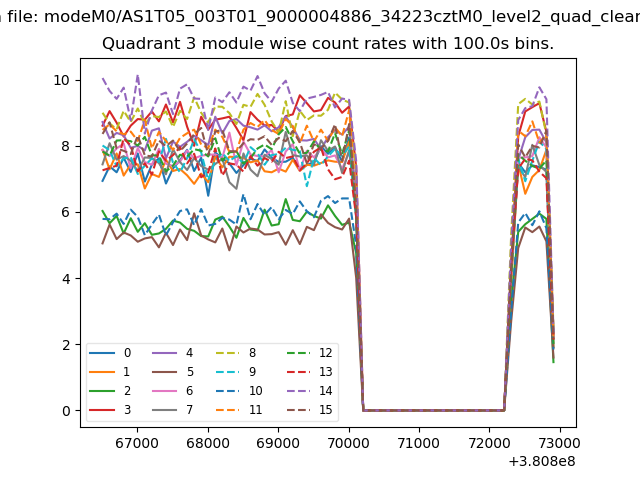
| Module-wise count rates for Quadrant C Data is divided into 100 sec bins |
 |
 |
| Module-wise count rates for Quadrant D Data is divided into 100 sec bins |
 |
 |
| Parameter | Plot |
|---|---|
| CZT HV Monitor | 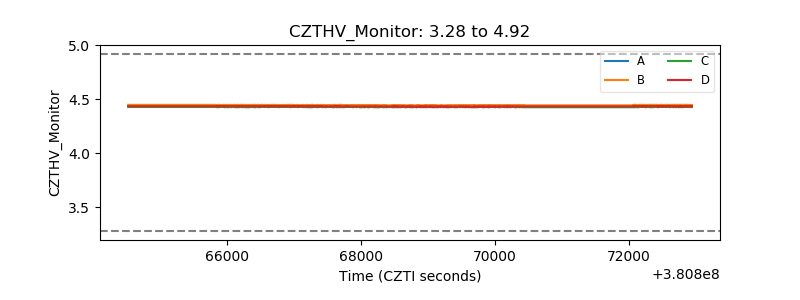 |
| D_VDD | 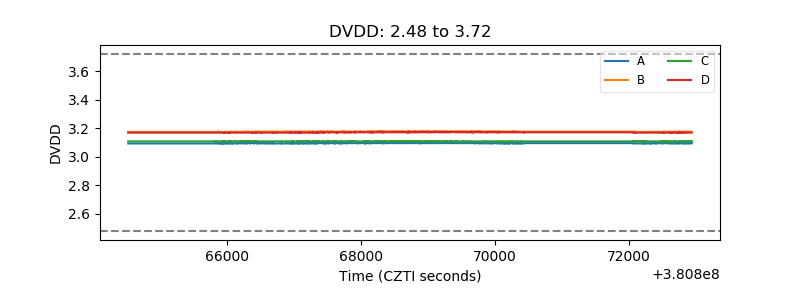 |
| Temperature 1 | 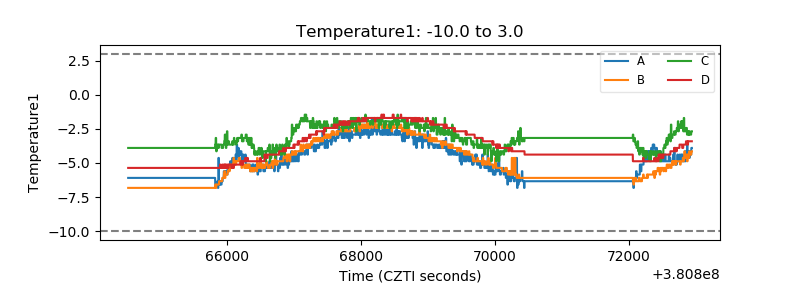 |
| Veto HV Monitor | 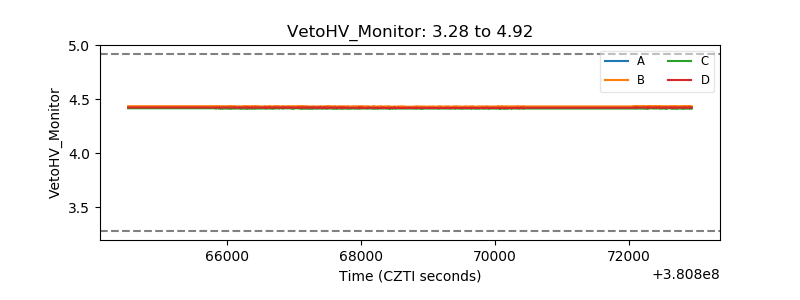 |
| Veto LLD | 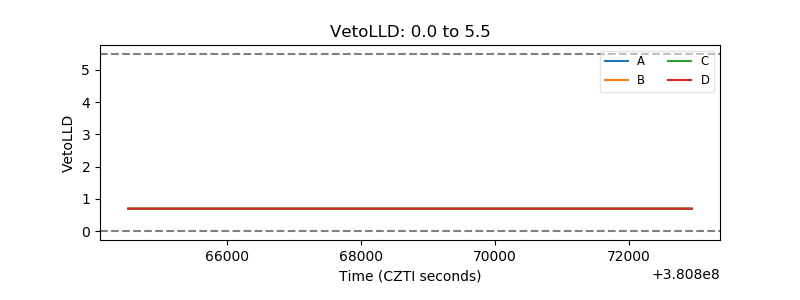 |
| Alpha Counter | 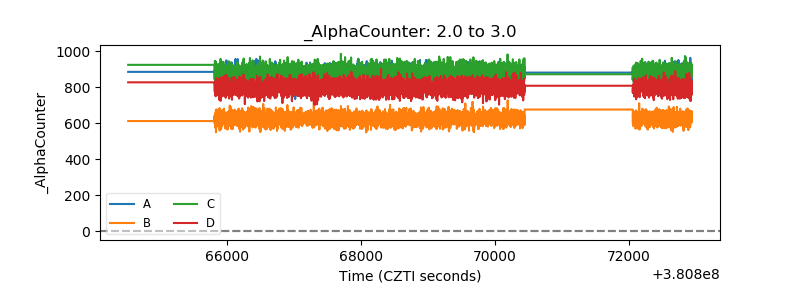 |
| _CPM_Rate | 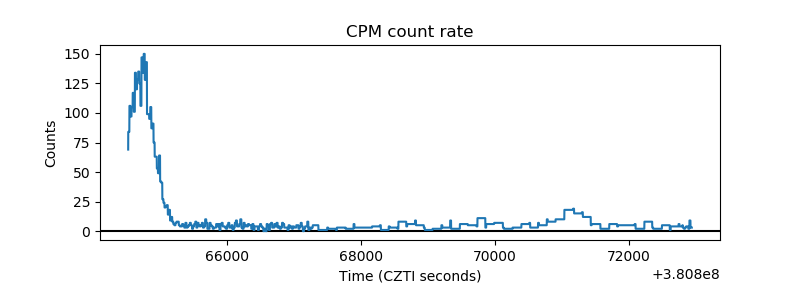 |
| CZT Counter | 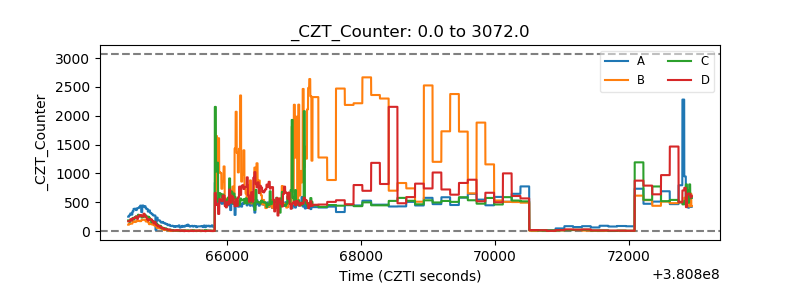 |
| +2.5 Volts monitor | 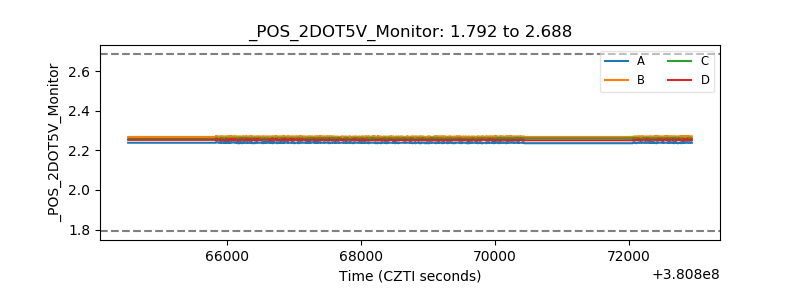 |
| +5 Volts monitor | 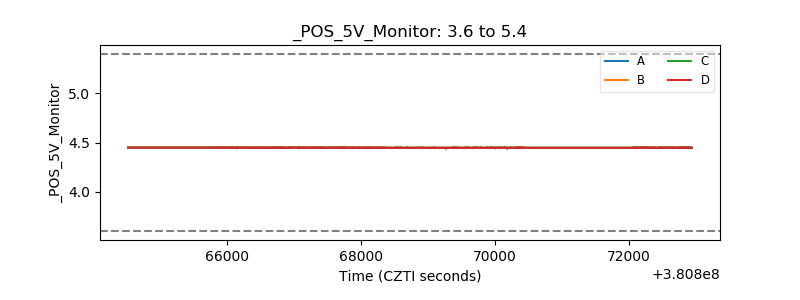 |
| _ROLL_ROT | 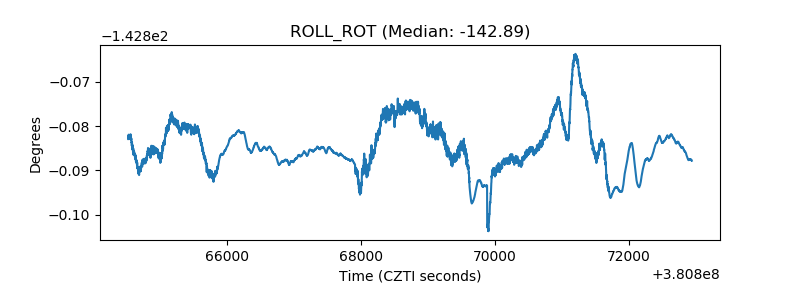 |
| _Roll_DEC | 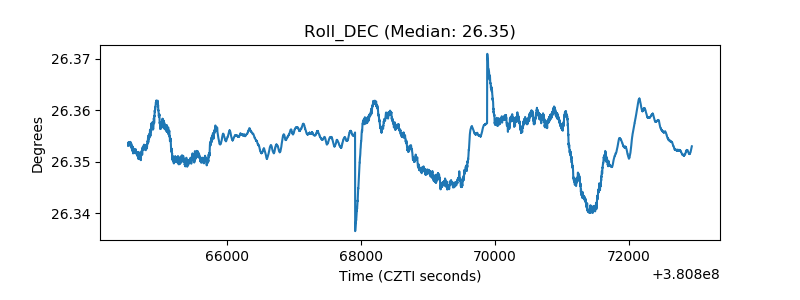 |
| _Roll_RA | 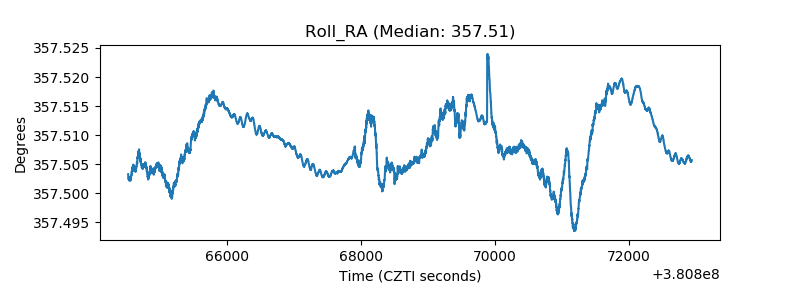 |
| Veto Counter | 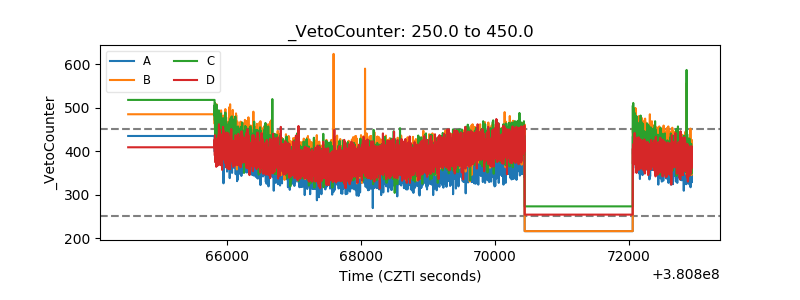 |