| Param | Original file | Final file |
|---|---|---|
| Filename | modeM0/AS1T05_003T01_9000004886_34222cztM0_level2.evt | modeM0/AS1T05_003T01_9000004886_34222cztM0_level2_quad_clean.evt |
| Size (bytes) | 555,359,040 | 66,867,840 |
| Size | 529.6 MB | 63.8 MB |
| Events in quadrant A | 3,368,641 | 419,217 |
| Events in quadrant B | 6,516,905 | 397,853 |
| Events in quadrant C | 2,861,987 | 440,659 |
| Events in quadrant D | 3,728,586 | 411,023 |
| Mode M9 | |||
|---|---|---|---|
| Quadrant | BADHDUFLAG | Total packets | Discarded packets |
| A | 0 | 26 | 0 |
| B | 0 | 26 | 0 |
| C | 0 | 26 | 0 |
| D | 0 | 27 | 0 |
| Mode SS | |||
|---|---|---|---|
| Quadrant | BADHDUFLAG | Total packets | Discarded packets |
| A | 0 | 104 | 0 |
| B | 0 | 104 | 0 |
| C | 0 | 104 | 0 |
| D | 0 | 104 | 0 |
| Mode M0 | |||
|---|---|---|---|
| Quadrant | BADHDUFLAG | Total packets | Discarded packets |
| A | 0 | 13387 | 3 |
| B | 0 | 22916 | 2 |
| C | 0 | 11342 | 2 |
| D | 0 | 14437 | 2 |
| Quadrant | Total seconds | Saturated seconds | Saturation percentage |
|---|---|---|---|
| A | 5069 | 35 | 0.690471% |
| B | 5069 | 1097 | 21.641349% |
| C | 5069 | 88 | 1.736043% |
| D | 5069 | 238 | 4.695206% |
Noise dominated data is calculated using 1-second bins in cleaned event files. If a bin has >2000 counts, and if more than 50% of those come from <1% of pixels, then it is considered to be noise-dominated and hence unusable.
| Quadrant | # 1 sec bins | Bins with >0 counts | Bins with >2000 counts | High rate bins dominated by noise | Noise dominated (total time) | Noise dominated (detector-on time) | Marked lightcurve |
|---|---|---|---|---|---|---|---|
| A | 7041 | 5070 | 17 | 17 | 0.24% | 0.34% | 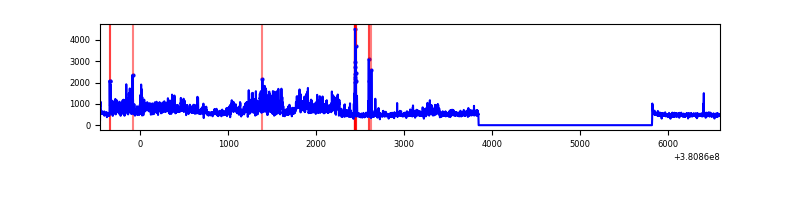 |
| B | 7041 | 5070 | 954 | 954 | 13.55% | 18.82% | 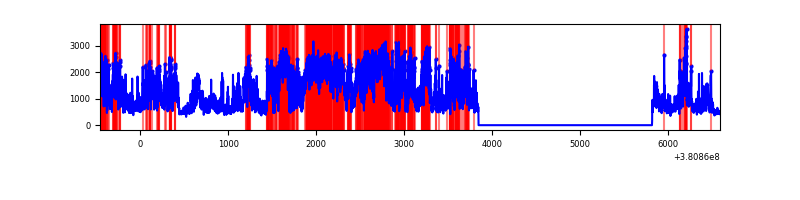 |
| C | 7041 | 5070 | 60 | 60 | 0.85% | 1.18% | 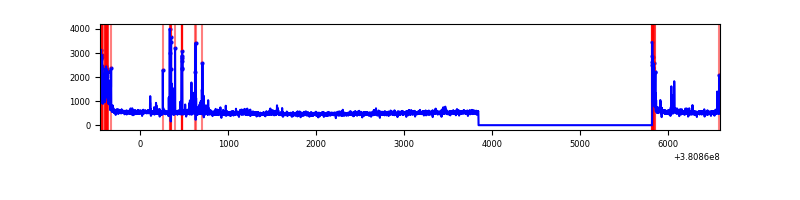 |
| D | 7041 | 5070 | 198 | 198 | 2.81% | 3.91% | 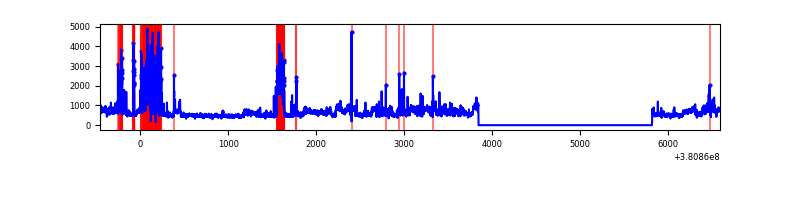 |
Top three noisy pixels from each quadrant. If the there are fewer than three noisy pixels in the level2.evt file, extra rows are filled as -1
| Pixel properties | Quadrant properties | ||||||
|---|---|---|---|---|---|---|---|
| Quadrant | DetID | PixID | Counts | Sigma | Mean | Median | Sigma |
| A | 15 | 47 | 947040 | 7897.95 | 600 | 588 | 119.8 |
| A | 9 | 143 | 48318 | 398.3 | 600 | 588 | 119.8 |
| A | 10 | 83 | 22360 | 181.68 | 600 | 588 | 119.8 |
| B | 5 | 31 | 2849748 | 25881.66 | 575 | 560 | 110.1 |
| B | 5 | 15 | 1012784 | 9194.91 | 575 | 560 | 110.1 |
| B | 5 | 172 | 184240 | 1668.53 | 575 | 560 | 110.1 |
| C | 15 | 214 | 219937 | 1632.8 | 587 | 592 | 134.3 |
| C | 0 | 10 | 196164 | 1455.83 | 587 | 592 | 134.3 |
| C | 4 | 254 | 111918 | 828.71 | 587 | 592 | 134.3 |
| D | 8 | 195 | 670020 | 4692.63 | 580 | 564 | 142.7 |
| D | 7 | 80 | 650969 | 4559.09 | 580 | 564 | 142.7 |
| D | 10 | 118 | 55325 | 383.85 | 580 | 564 | 142.7 |
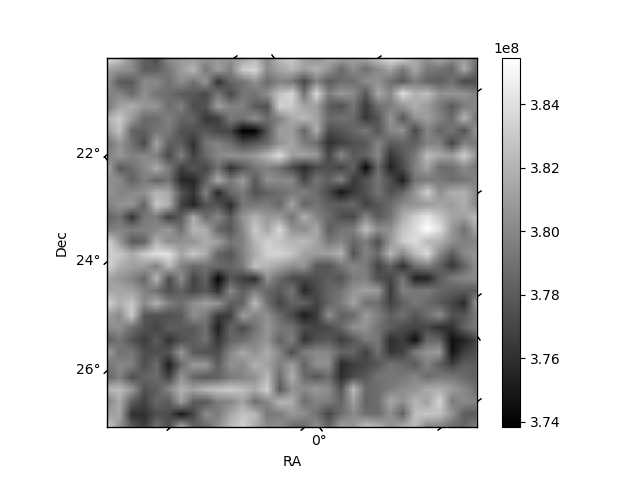
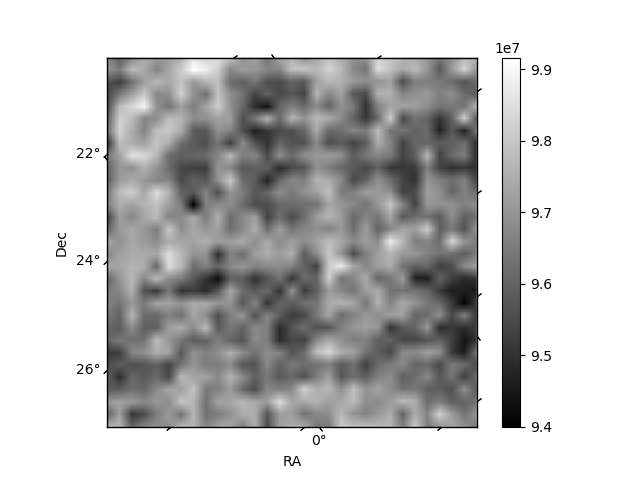
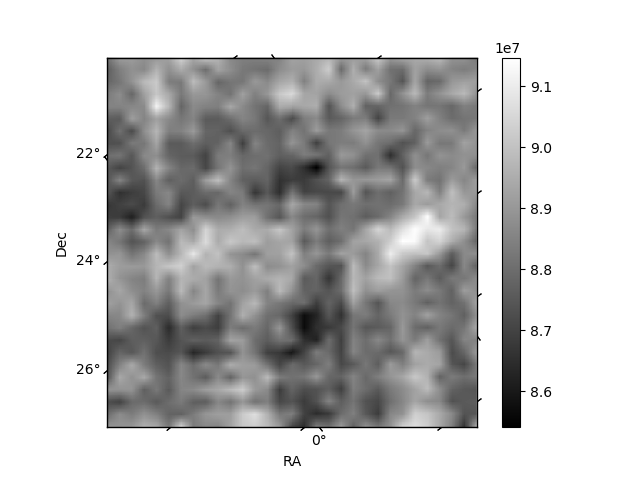
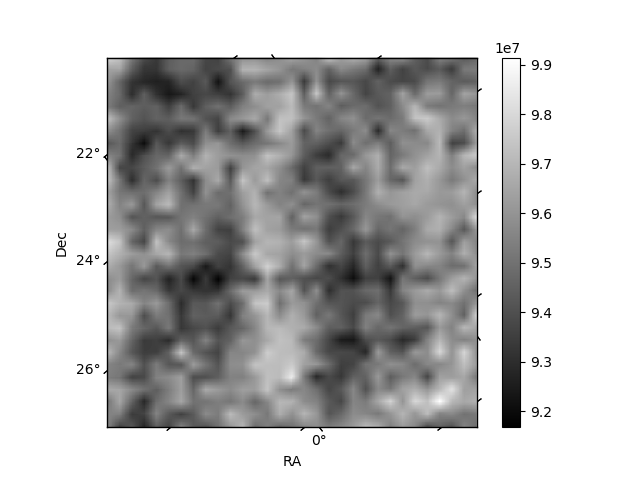
Histogram calculated using DETX and DETY for each event in the final _common_clean file
| Quadrant A | 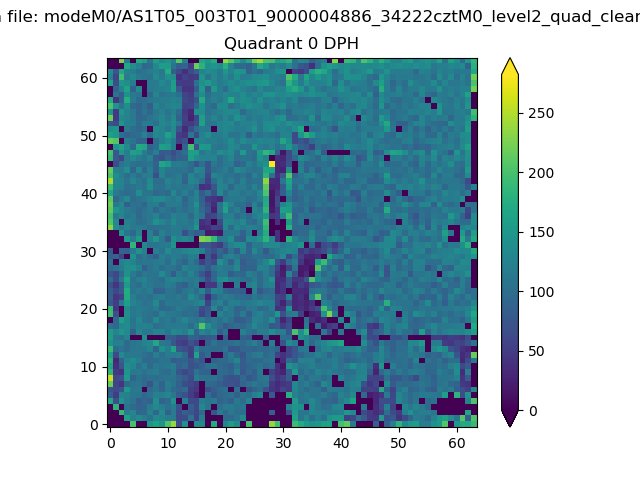 |
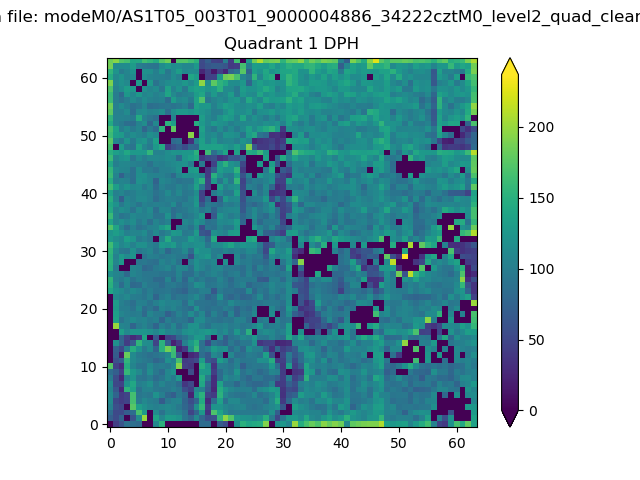 |
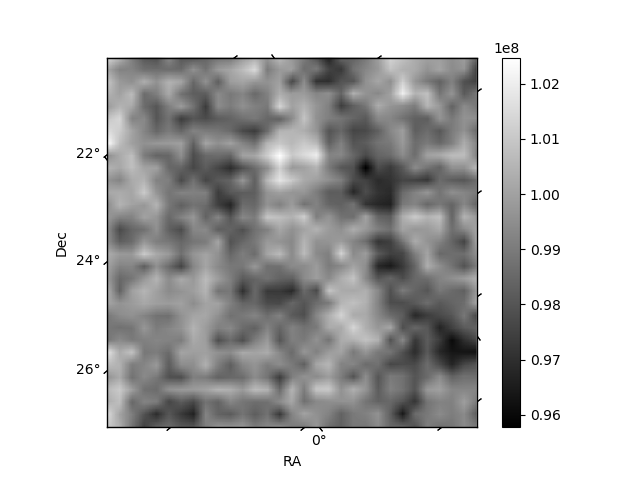
Quadrant B |
|---|---|---|---|
| Quadrant D | 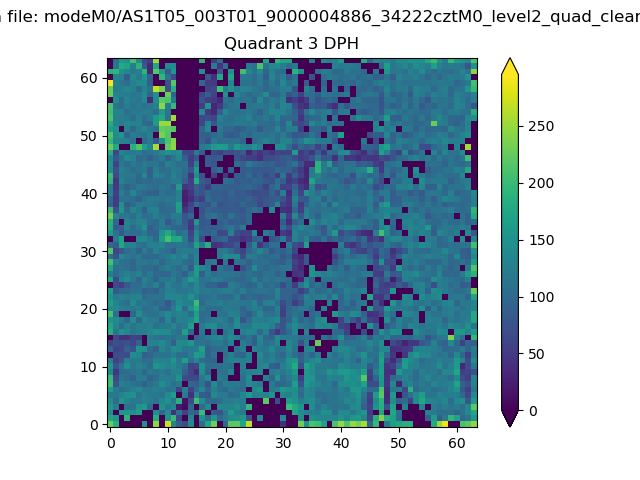 |
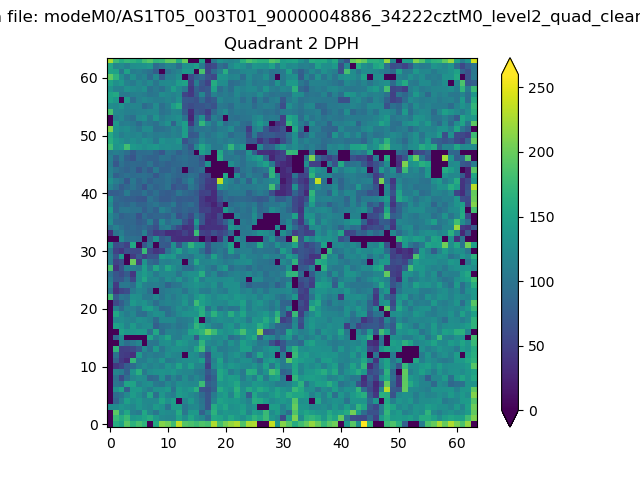 |
Quadrant C |
| Plot type | Count rate plots | Images |
|---|---|---|
| Comparison with Poisson distribution Blue bars denote a histogram of data divided into 1 sec bins. Red curve is a Poisson curve with rate = median count rate of data. |
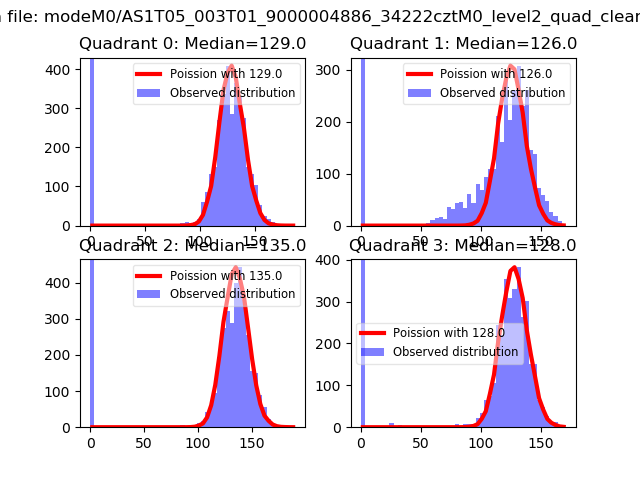 |
 |
| Quadrant-wise count rates Data is divided into 100 sec bins |
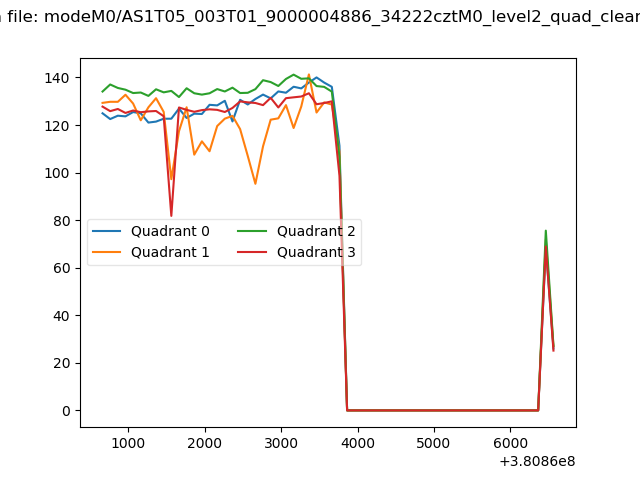 |
|
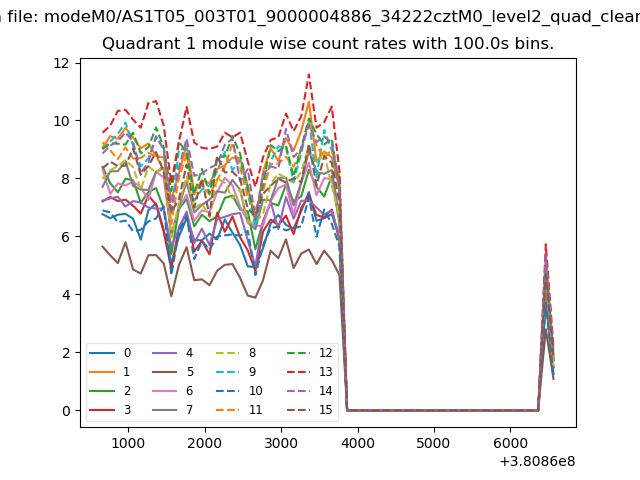
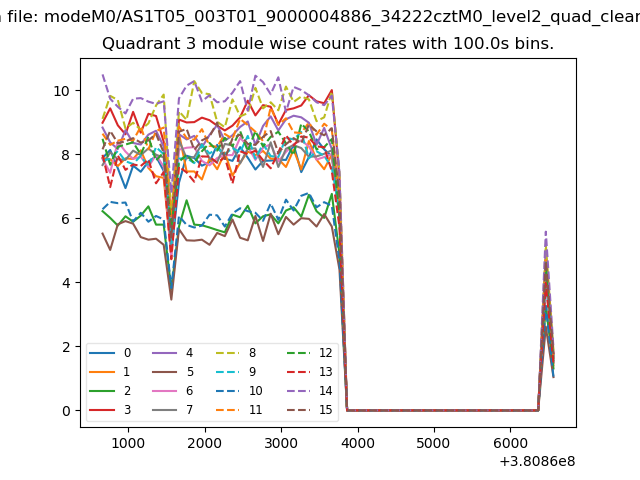
| Module-wise count rates for Quadrant A Data is divided into 100 sec bins |
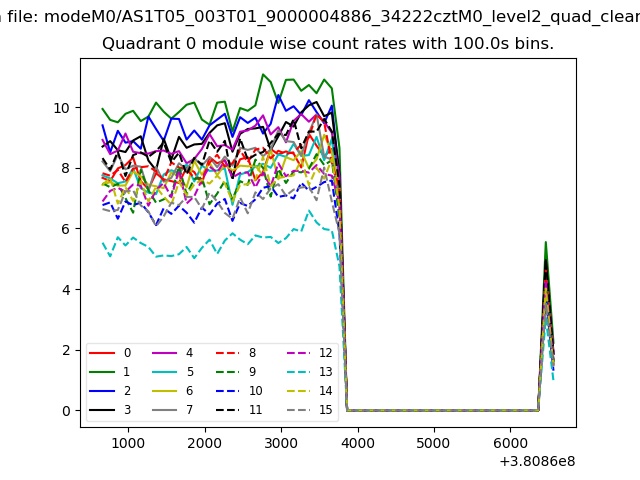 |
 |
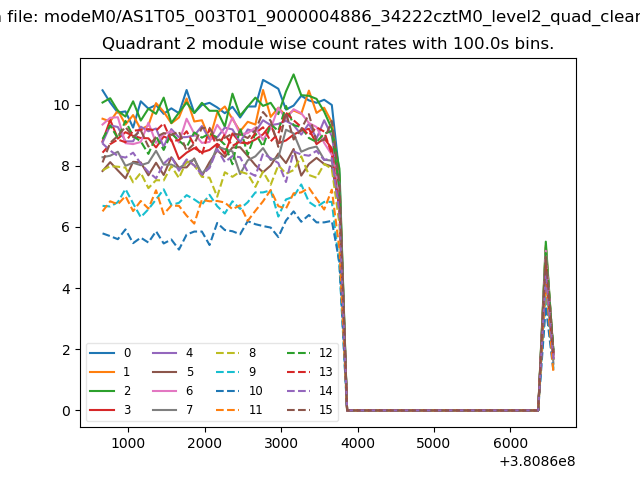
| Module-wise count rates for Quadrant B Data is divided into 100 sec bins |
 |
 |
| Module-wise count rates for Quadrant C Data is divided into 100 sec bins |
 |
 |
| Module-wise count rates for Quadrant D Data is divided into 100 sec bins |
 |
 |
| Parameter | Plot |
|---|---|
| CZT HV Monitor | 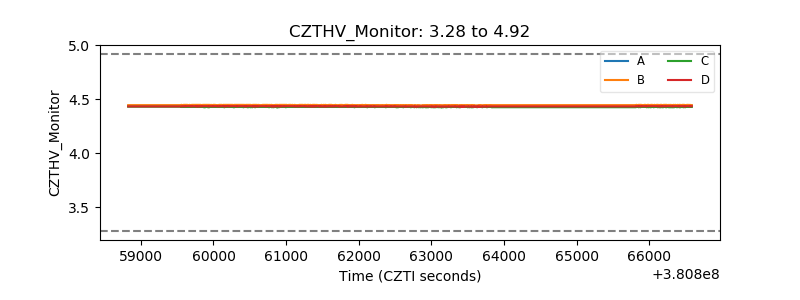 |
| D_VDD | 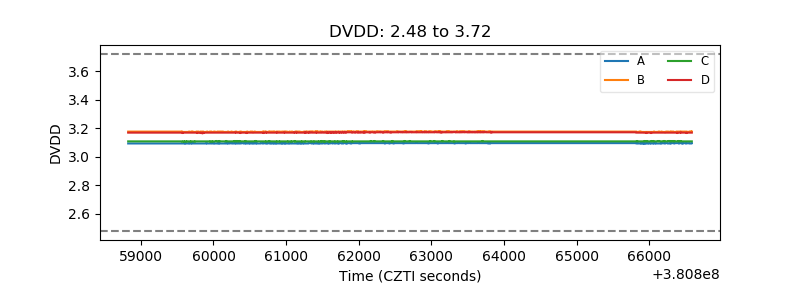 |
| Temperature 1 | 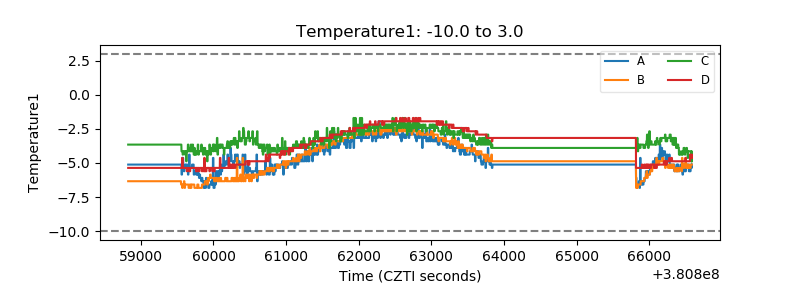 |
| Veto HV Monitor | 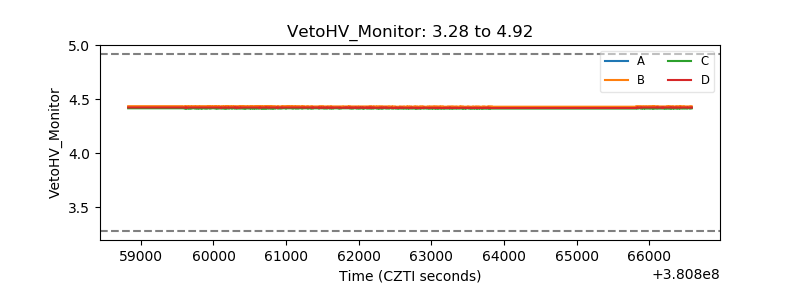 |
| Veto LLD | 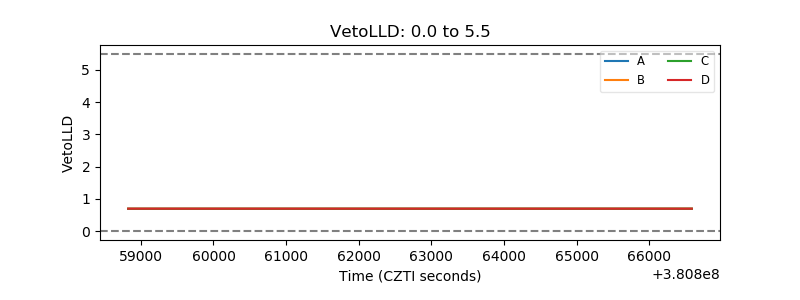 |
| Alpha Counter | 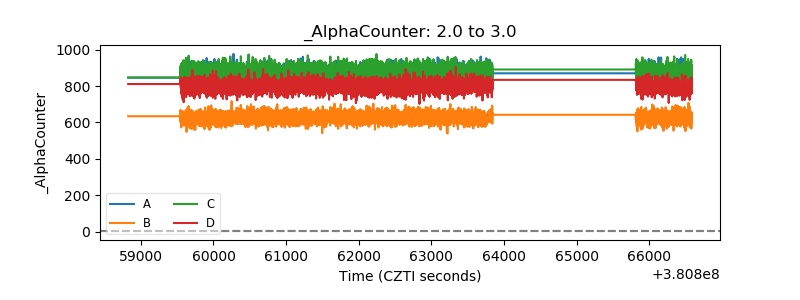 |
| _CPM_Rate | 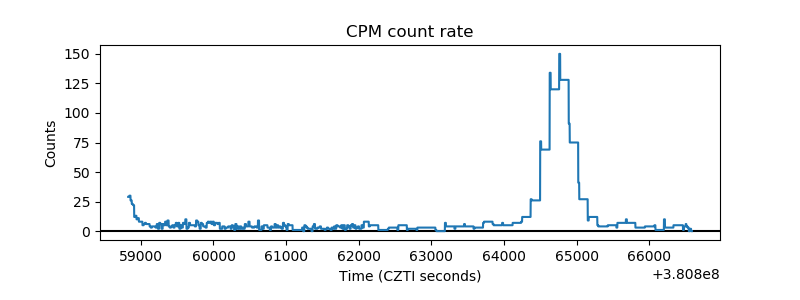 |
| CZT Counter | 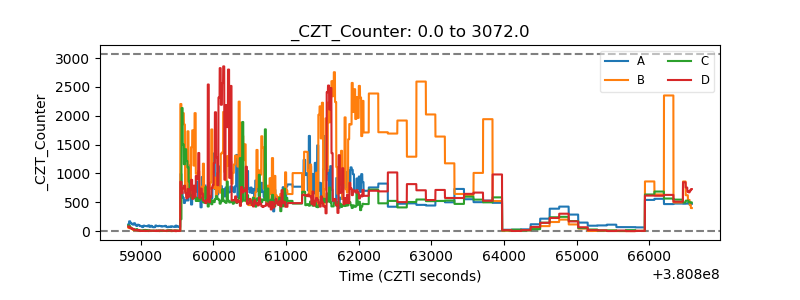 |
| +2.5 Volts monitor | 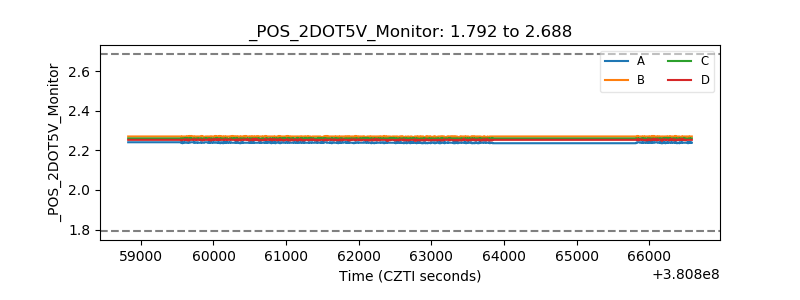 |
| +5 Volts monitor | 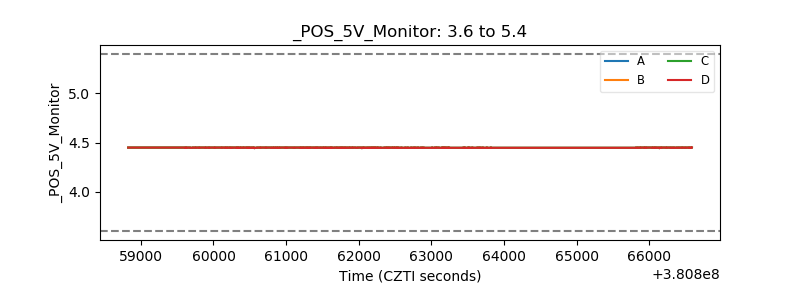 |
| _ROLL_ROT | 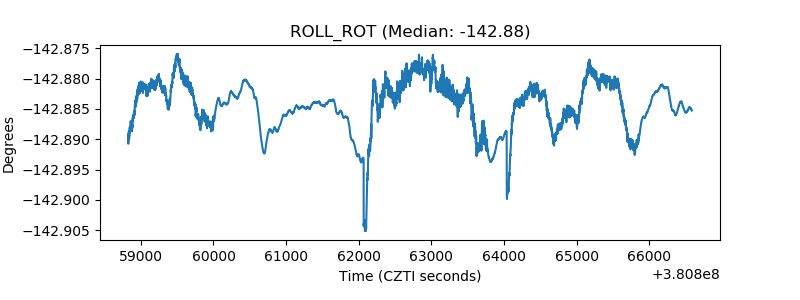 |
| _Roll_DEC | 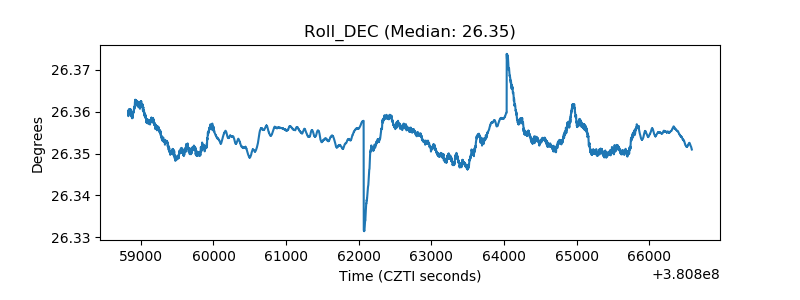 |
| _Roll_RA | 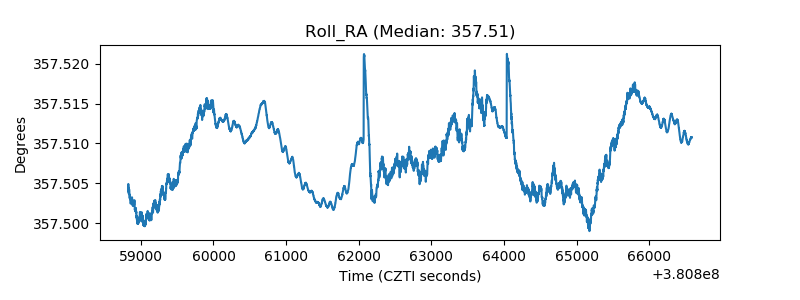 |
| Veto Counter | 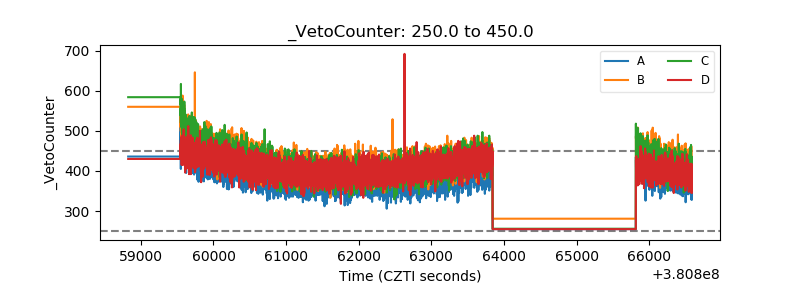 |