| Param | Original file | Final file |
|---|---|---|
| Filename | modeM0/AS1T05_003T01_9000004886_34221cztM0_level2.evt | modeM0/AS1T05_003T01_9000004886_34221cztM0_level2_quad_clean.evt |
| Size (bytes) | 396,930,240 | 51,223,680 |
| Size | 378.5 MB | 48.9 MB |
| Events in quadrant A | 1,919,569 | 337,694 |
| Events in quadrant B | 5,353,915 | 286,127 |
| Events in quadrant C | 1,953,269 | 353,102 |
| Events in quadrant D | 2,560,877 | 330,204 |
| Mode M9 | |||
|---|---|---|---|
| Quadrant | BADHDUFLAG | Total packets | Discarded packets |
| A | 0 | 22 | 0 |
| B | 0 | 22 | 0 |
| C | 0 | 22 | 0 |
| D | 0 | 22 | 0 |
| Mode SS | |||
|---|---|---|---|
| Quadrant | BADHDUFLAG | Total packets | Discarded packets |
| A | 0 | 68 | 0 |
| B | 0 | 68 | 0 |
| C | 0 | 68 | 0 |
| D | 0 | 68 | 0 |
| Mode M0 | |||
|---|---|---|---|
| Quadrant | BADHDUFLAG | Total packets | Discarded packets |
| A | 0 | 7922 | 2 |
| B | 0 | 18294 | 1 |
| C | 0 | 7689 | 1 |
| D | 0 | 9922 | 1 |
| Quadrant | Total seconds | Saturated seconds | Saturation percentage |
|---|---|---|---|
| A | 3441 | 9 | 0.261552% |
| B | 3441 | 1236 | 35.919791% |
| C | 3441 | 67 | 1.947108% |
| D | 3441 | 180 | 5.231037% |
Noise dominated data is calculated using 1-second bins in cleaned event files. If a bin has >2000 counts, and if more than 50% of those come from <1% of pixels, then it is considered to be noise-dominated and hence unusable.
| Quadrant | # 1 sec bins | Bins with >0 counts | Bins with >2000 counts | High rate bins dominated by noise | Noise dominated (total time) | Noise dominated (detector-on time) | Marked lightcurve |
|---|---|---|---|---|---|---|---|
| A | 5563 | 3442 | 4 | 4 | 0.07% | 0.12% | 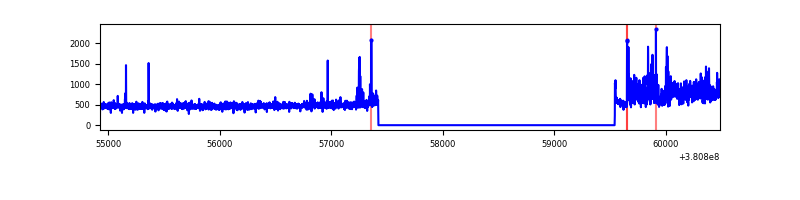 |
| B | 5563 | 3442 | 1044 | 1044 | 18.77% | 30.33% | 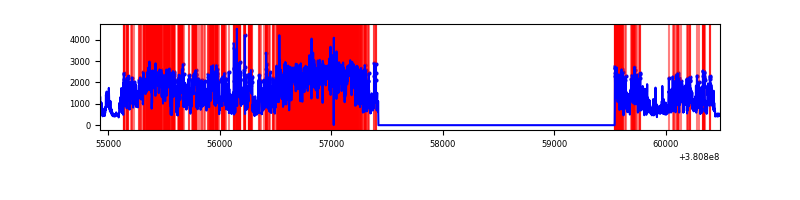 |
| C | 5563 | 3442 | 43 | 43 | 0.77% | 1.25% | 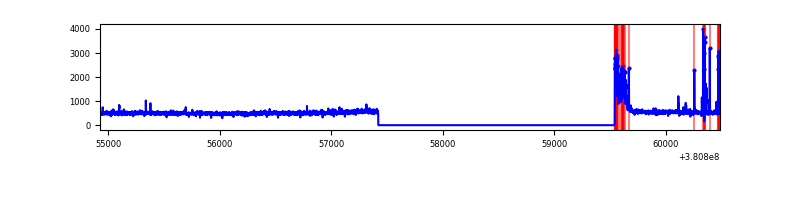 |
| D | 5563 | 3442 | 143 | 143 | 2.57% | 4.15% | 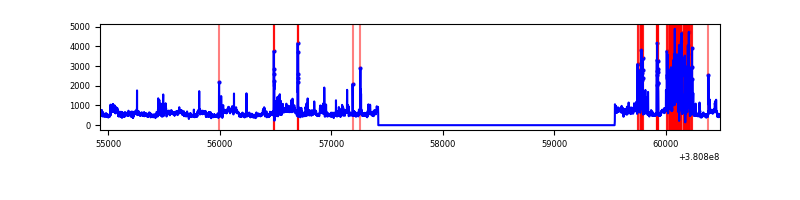 |
Top three noisy pixels from each quadrant. If the there are fewer than three noisy pixels in the level2.evt file, extra rows are filled as -1
| Pixel properties | Quadrant properties | ||||||
|---|---|---|---|---|---|---|---|
| Quadrant | DetID | PixID | Counts | Sigma | Mean | Median | Sigma |
| A | 15 | 47 | 281999 | 3340.17 | 416 | 408 | 84.3 |
| A | 10 | 83 | 11746 | 134.49 | 416 | 408 | 84.3 |
| A | 13 | 6 | 9142 | 103.6 | 416 | 408 | 84.3 |
| B | 5 | 31 | 2366139 | 33595.12 | 370 | 361 | 70.4 |
| B | 5 | 15 | 916807 | 13013.95 | 370 | 361 | 70.4 |
| B | 5 | 172 | 415912 | 5901.01 | 370 | 361 | 70.4 |
| C | 15 | 214 | 146554 | 1568.33 | 406 | 410 | 93.2 |
| C | 0 | 10 | 143152 | 1531.82 | 406 | 410 | 93.2 |
| C | 4 | 254 | 65540 | 698.93 | 406 | 410 | 93.2 |
| D | 7 | 80 | 442840 | 4505.6 | 398 | 388 | 98.2 |
| D | 8 | 195 | 337935 | 3437.33 | 398 | 388 | 98.2 |
| D | 10 | 118 | 94035 | 953.63 | 398 | 388 | 98.2 |
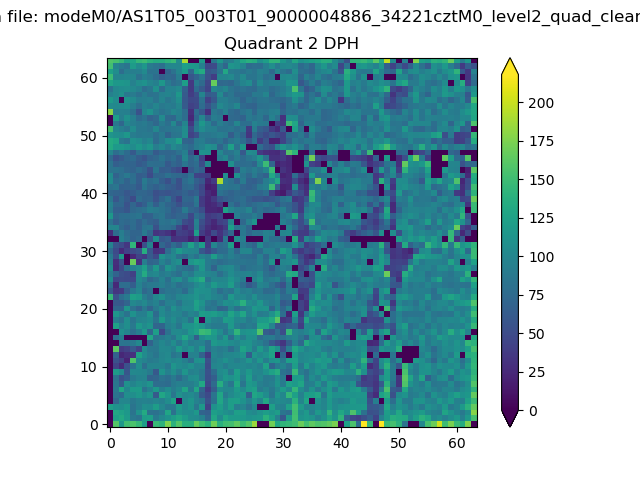
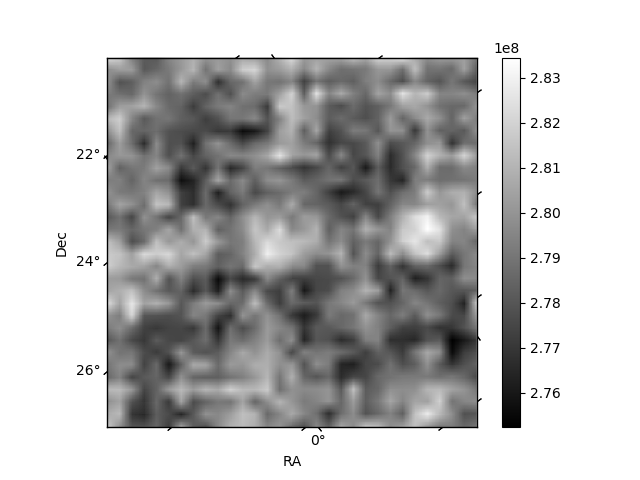
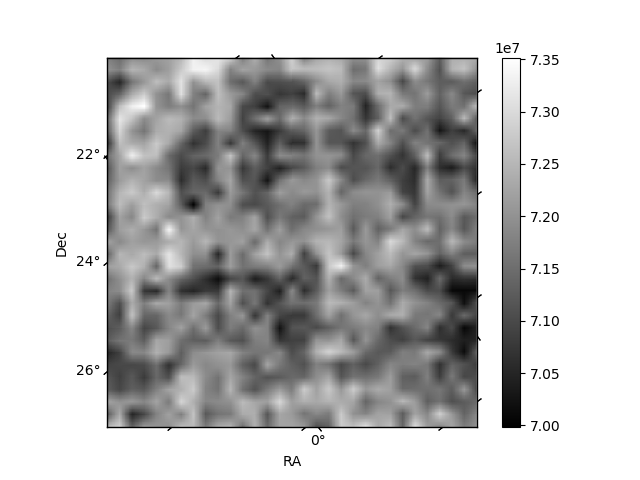
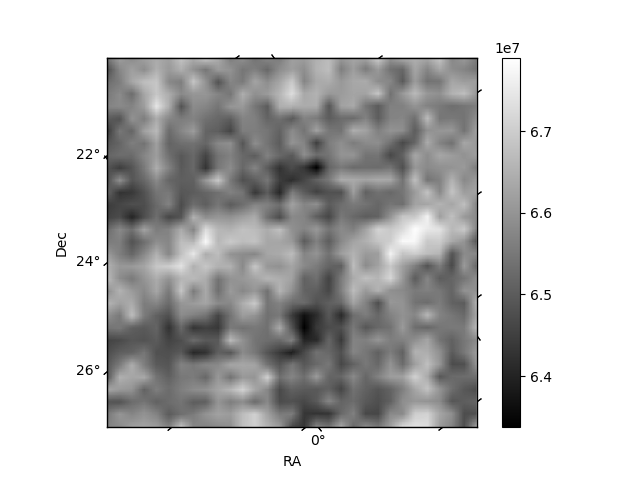
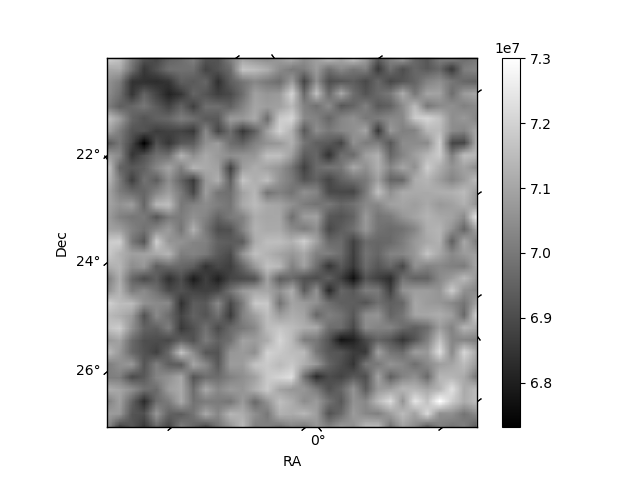
Histogram calculated using DETX and DETY for each event in the final _common_clean file
| Quadrant A | 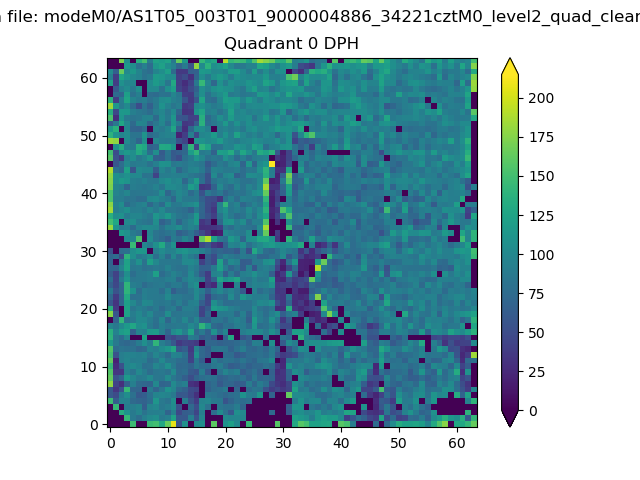 |
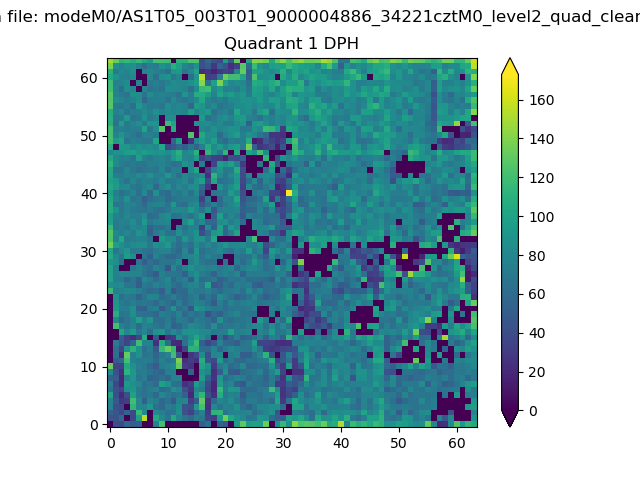 |
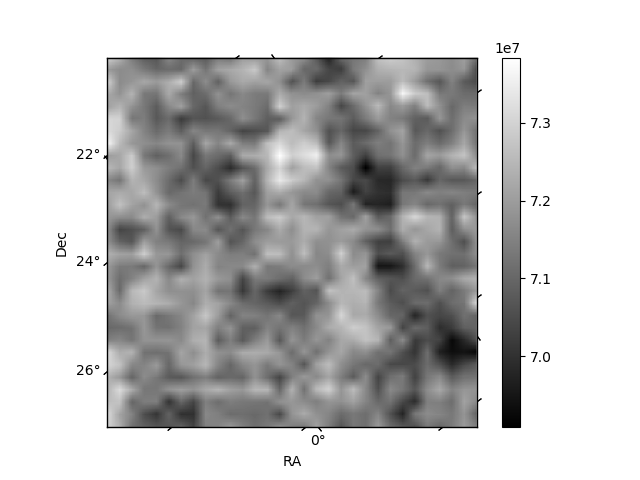
Quadrant B |
|---|---|---|---|
| Quadrant D | 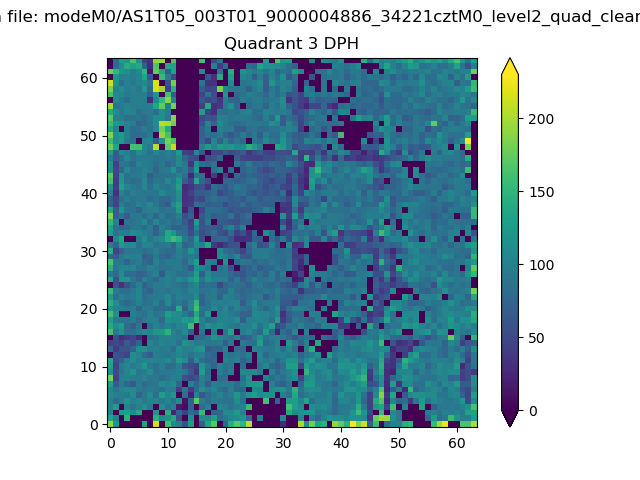 |
 |
Quadrant C |
| Plot type | Count rate plots | Images |
|---|---|---|
| Comparison with Poisson distribution Blue bars denote a histogram of data divided into 1 sec bins. Red curve is a Poisson curve with rate = median count rate of data. |
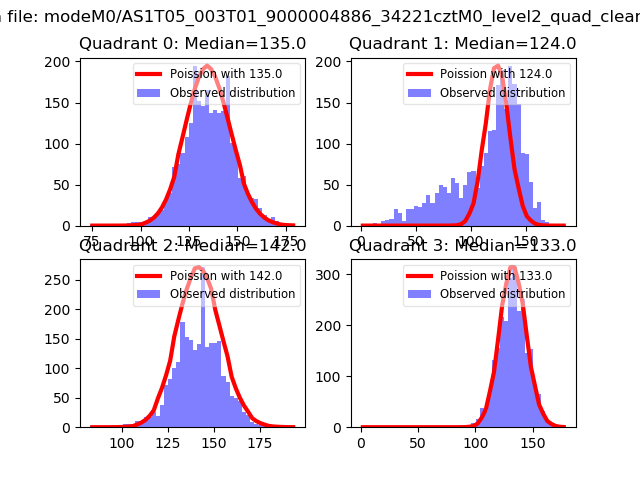 |
 |
| Quadrant-wise count rates Data is divided into 100 sec bins |
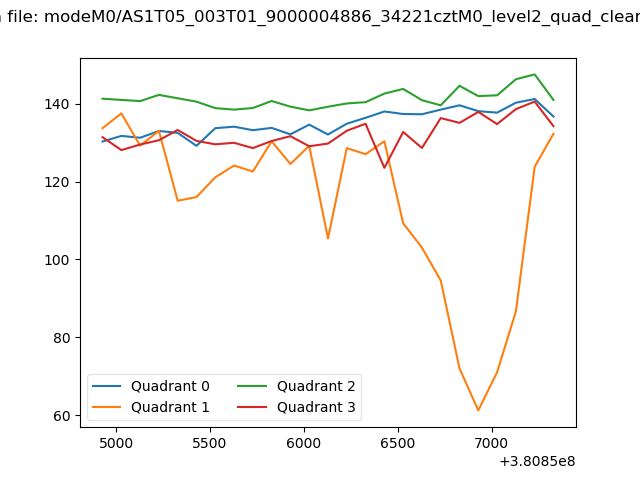 |
|
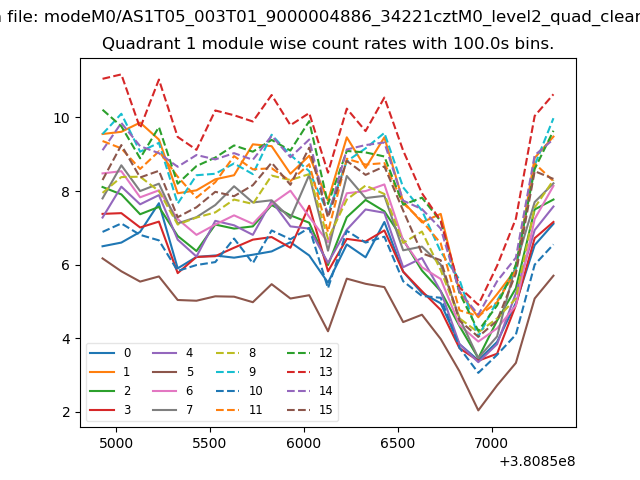
| Module-wise count rates for Quadrant A Data is divided into 100 sec bins |
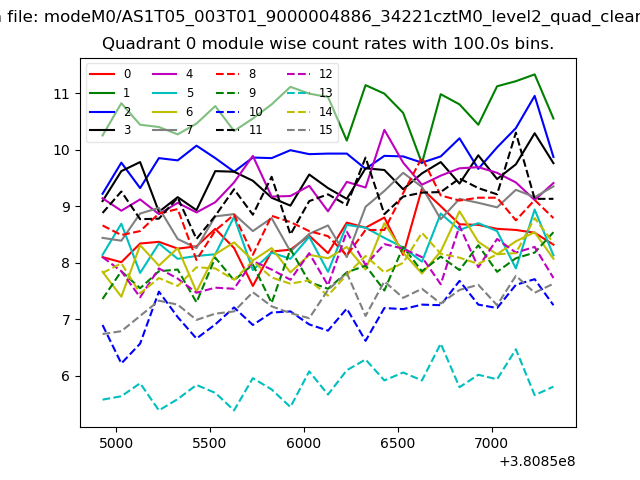 |
 |
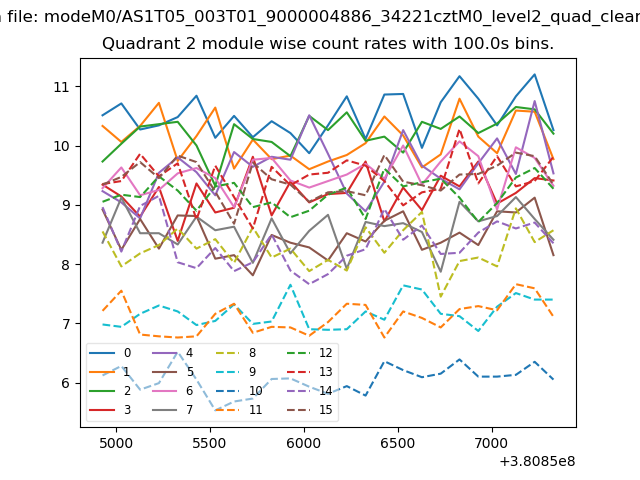
| Module-wise count rates for Quadrant B Data is divided into 100 sec bins |
 |
 |
| Module-wise count rates for Quadrant C Data is divided into 100 sec bins |
 |
 |
| Module-wise count rates for Quadrant D Data is divided into 100 sec bins |
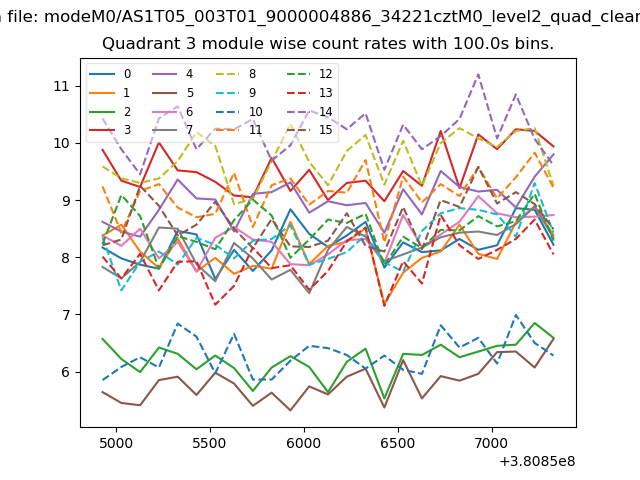 |
 |
| Parameter | Plot |
|---|---|
| CZT HV Monitor | 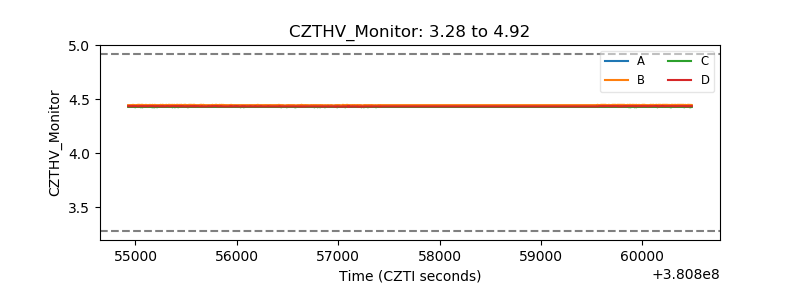 |
| D_VDD | 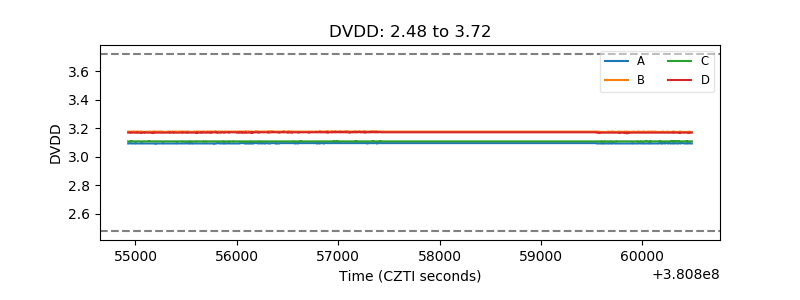 |
| Temperature 1 | 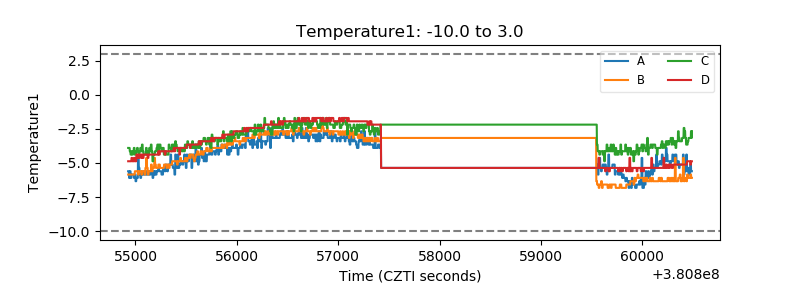 |
| Veto HV Monitor | 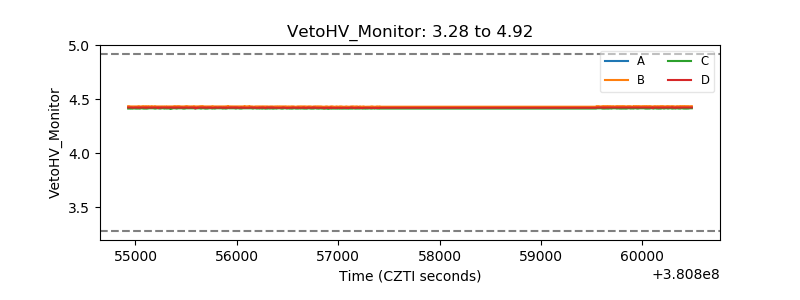 |
| Veto LLD | 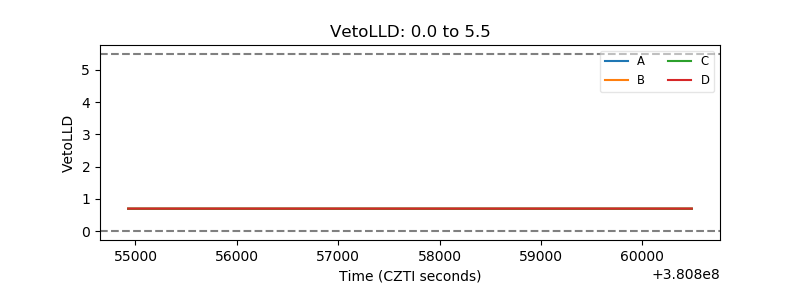 |
| Alpha Counter | 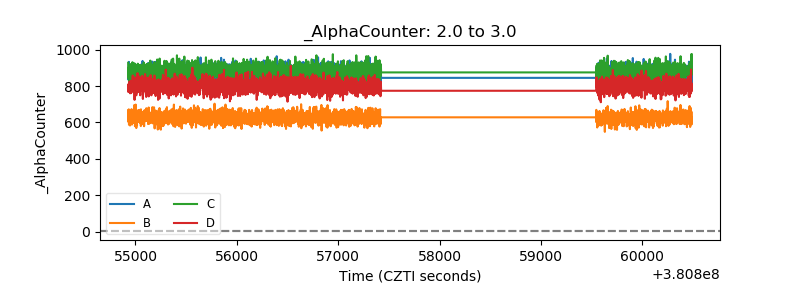 |
| _CPM_Rate | 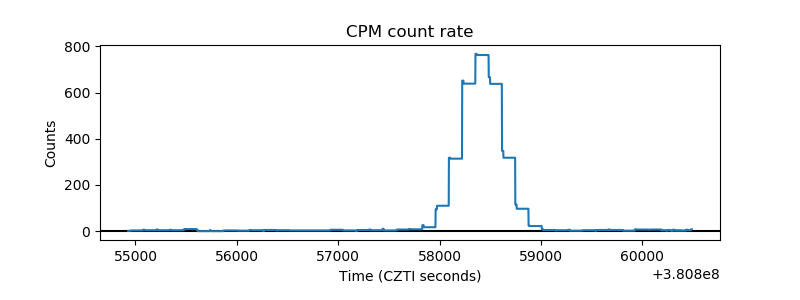 |
| CZT Counter | 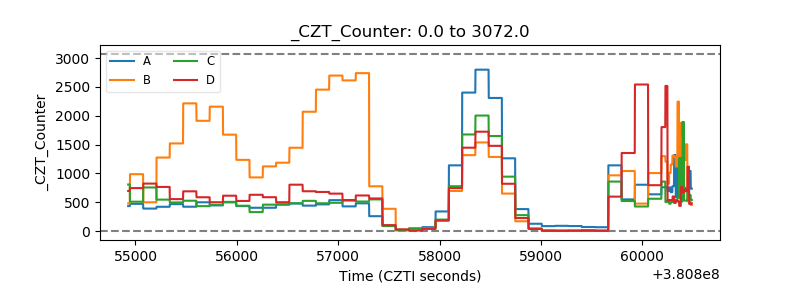 |
| +2.5 Volts monitor | 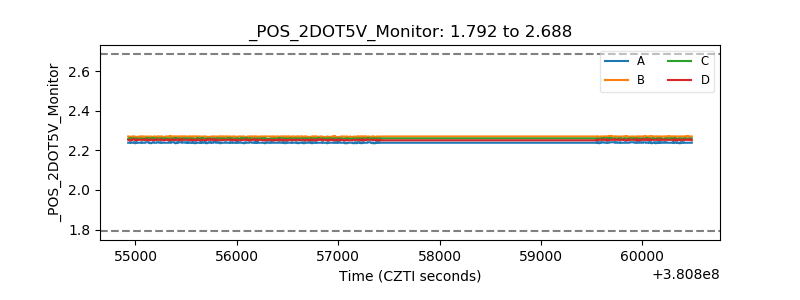 |
| +5 Volts monitor | 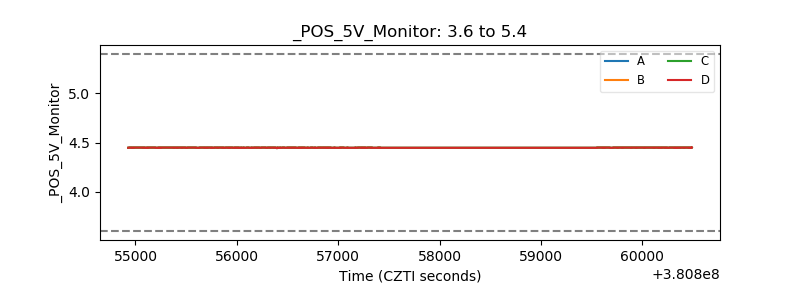 |
| _ROLL_ROT | 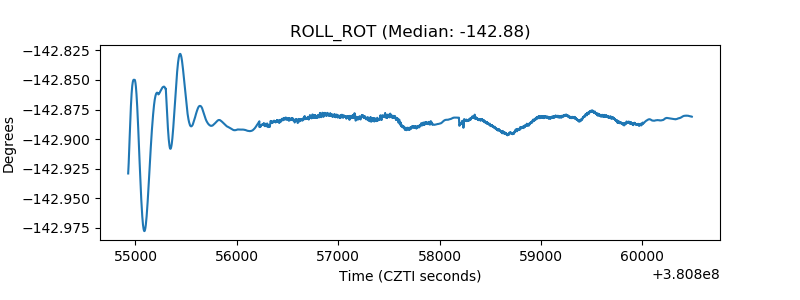 |
| _Roll_DEC | 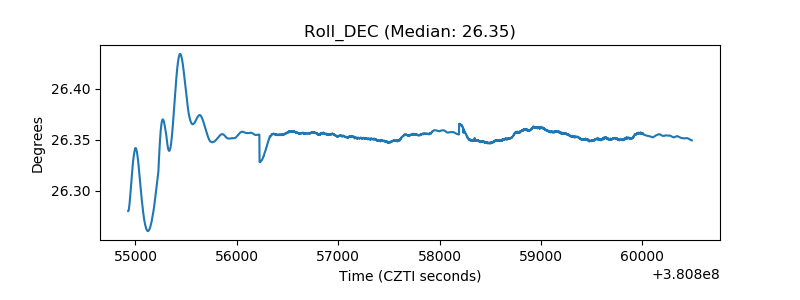 |
| _Roll_RA | 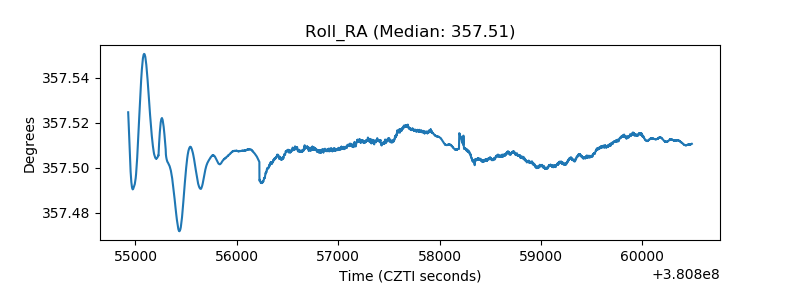 |
| Veto Counter | 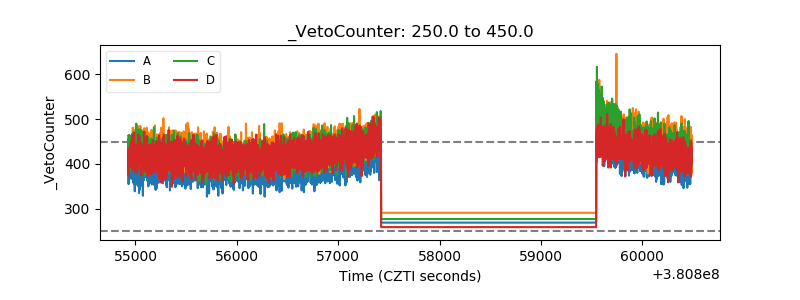 |