| Param | Original file | Final file |
|---|---|---|
| Filename | modeM0/AS1A11_059T09_9000004888_34268cztM0_level2.evt | modeM0/AS1A11_059T09_9000004888_34268cztM0_level2_quad_clean.evt |
| Size (bytes) | 859,170,240 | 127,702,080 |
| Size | 819.4 MB | 121.8 MB |
| Events in quadrant A | 4,828,866 | 799,648 |
| Events in quadrant B | 7,066,523 | 795,796 |
| Events in quadrant C | 5,782,554 | 795,497 |
| Events in quadrant D | 7,632,511 | 748,936 |
| Mode M0 | |||
|---|---|---|---|
| Quadrant | BADHDUFLAG | Total packets | Discarded packets |
| A | 0 | 21489 | 0 |
| B | 0 | 27857 | 0 |
| C | 0 | 23852 | 0 |
| D | 0 | 29879 | 0 |
| Mode SS | |||
|---|---|---|---|
| Quadrant | BADHDUFLAG | Total packets | Discarded packets |
| A | 0 | 214 | 0 |
| B | 0 | 214 | 0 |
| C | 0 | 214 | 0 |
| D | 0 | 214 | 0 |
| Mode M9 | |||
|---|---|---|---|
| Quadrant | BADHDUFLAG | Total packets | Discarded packets |
| A | 0 | 27 | 0 |
| B | 0 | 27 | 0 |
| C | 0 | 27 | 0 |
| D | 0 | 27 | 0 |
| Quadrant | Total seconds | Saturated seconds | Saturation percentage |
|---|---|---|---|
| A | 10503 | 38 | 0.361801% |
| B | 10503 | 550 | 5.236599% |
| C | 10503 | 48 | 0.457012% |
| D | 10503 | 257 | 2.446920% |
Noise dominated data is calculated using 1-second bins in cleaned event files. If a bin has >2000 counts, and if more than 50% of those come from <1% of pixels, then it is considered to be noise-dominated and hence unusable.
| Quadrant | # 1 sec bins | Bins with >0 counts | Bins with >2000 counts | High rate bins dominated by noise | Noise dominated (total time) | Noise dominated (detector-on time) | Marked lightcurve |
|---|---|---|---|---|---|---|---|
| A | 13277 | 10505 | 23 | 23 | 0.17% | 0.22% | 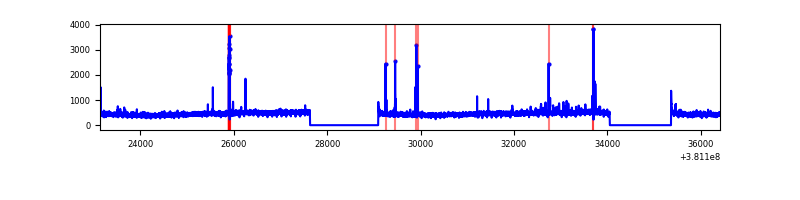 |
| B | 13277 | 10505 | 386 | 386 | 2.91% | 3.67% | 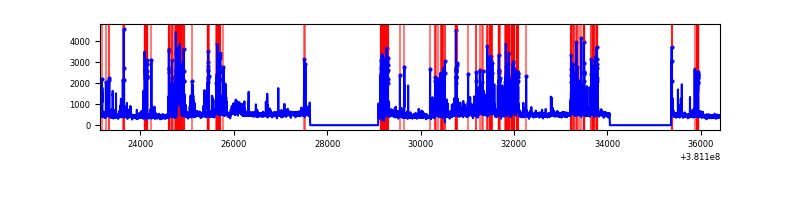 |
| C | 13277 | 10505 | 41 | 41 | 0.31% | 0.39% | 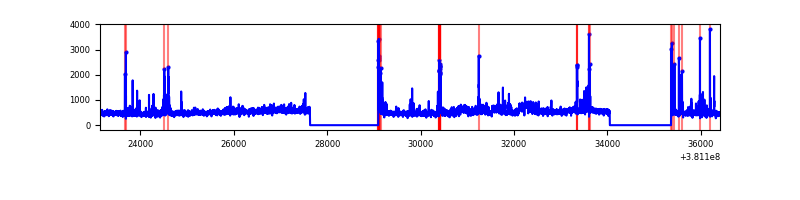 |
| D | 13277 | 10505 | 201 | 201 | 1.51% | 1.91% | 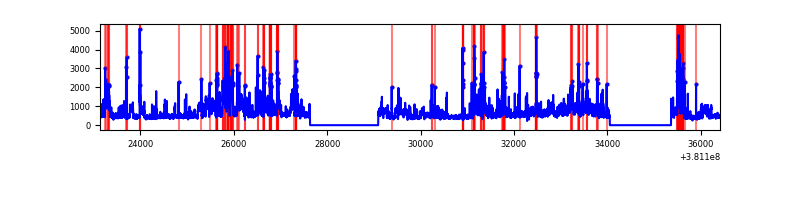 |
Top three noisy pixels from each quadrant. If the there are fewer than three noisy pixels in the level2.evt file, extra rows are filled as -1
| Pixel properties | Quadrant properties | ||||||
|---|---|---|---|---|---|---|---|
| Quadrant | DetID | PixID | Counts | Sigma | Mean | Median | Sigma |
| A | 9 | 143 | 132794 | 549.79 | 1203 | 1179 | 239.4 |
| A | 10 | 83 | 29650 | 118.93 | 1203 | 1179 | 239.4 |
| A | 13 | 254 | 17893 | 69.82 | 1203 | 1179 | 239.4 |
| B | 5 | 172 | 1832309 | 8107.54 | 1175 | 1144 | 225.9 |
| B | 0 | 189 | 250000 | 1101.82 | 1175 | 1144 | 225.9 |
| B | 0 | 229 | 174777 | 768.77 | 1175 | 1144 | 225.9 |
| C | 15 | 214 | 451976 | 1686.14 | 1164 | 1173 | 267.4 |
| C | 14 | 67 | 398728 | 1486.98 | 1164 | 1173 | 267.4 |
| C | 14 | 254 | 230985 | 859.57 | 1164 | 1173 | 267.4 |
| D | 8 | 195 | 2025331 | 7145.39 | 1159 | 1127 | 283.3 |
| D | 2 | 250 | 435257 | 1532.47 | 1159 | 1127 | 283.3 |
| D | 13 | 249 | 259941 | 913.61 | 1159 | 1127 | 283.3 |
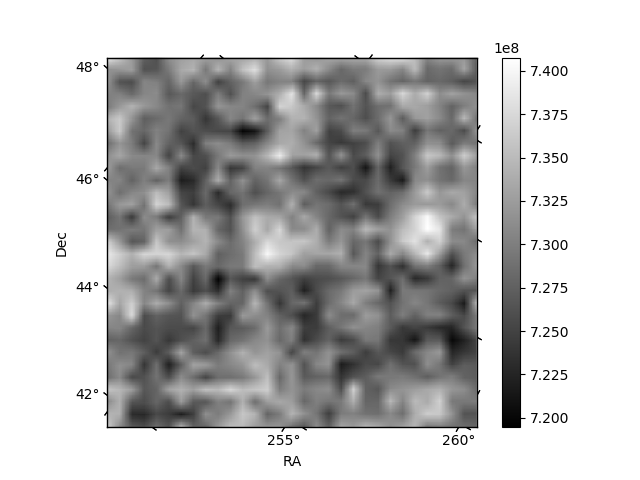
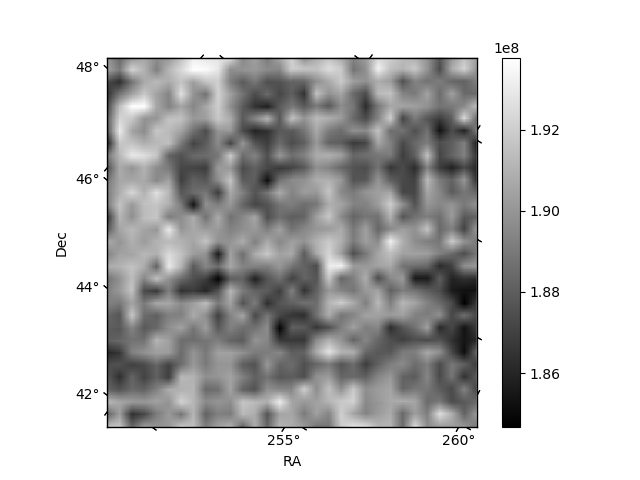
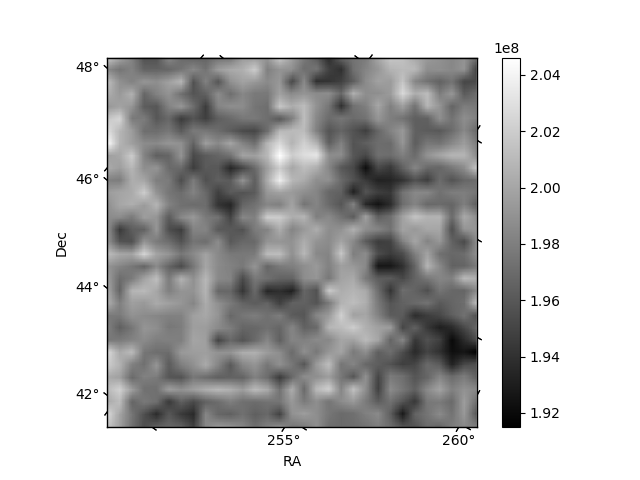
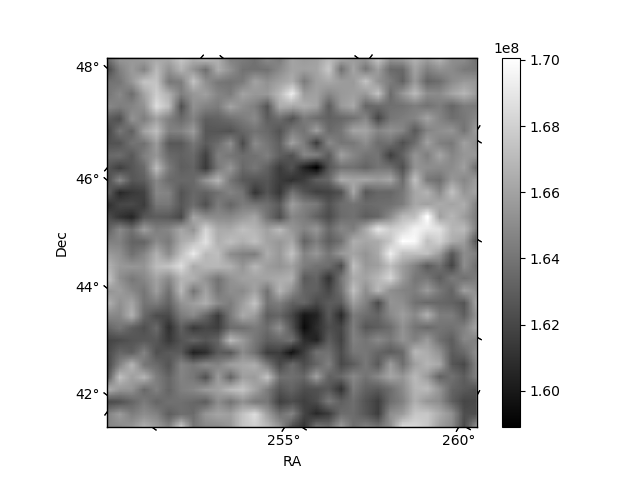
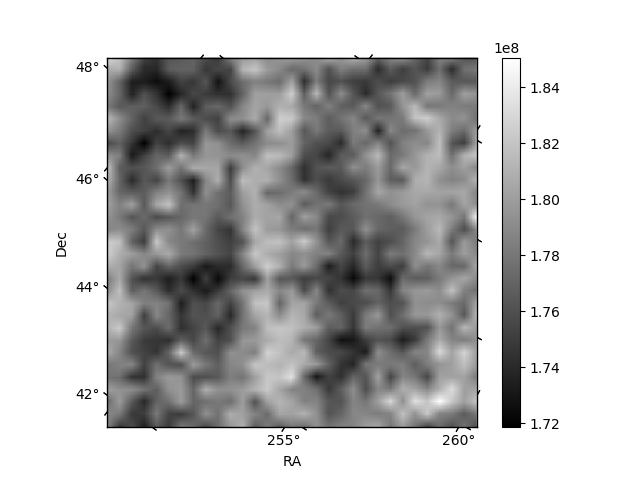
Histogram calculated using DETX and DETY for each event in the final _common_clean file
| Quadrant A | 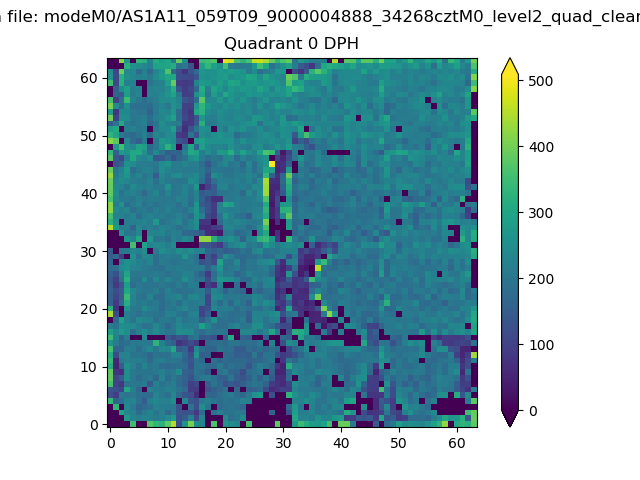 |
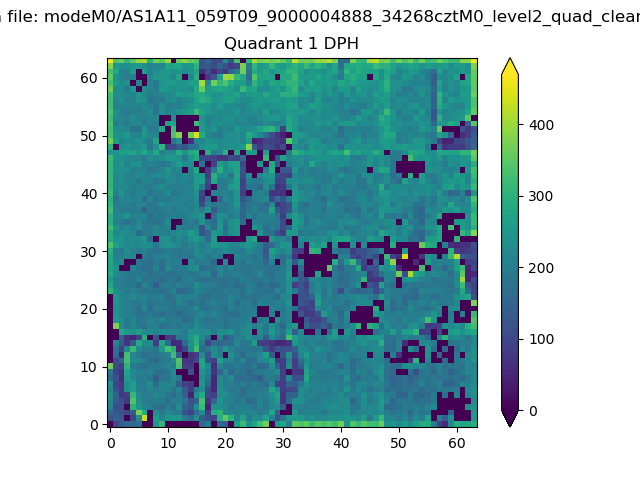 |
Quadrant B |
|---|---|---|---|
| Quadrant D | 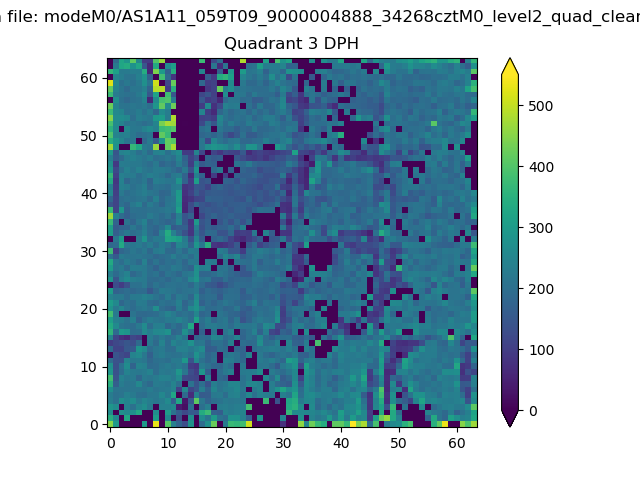 |
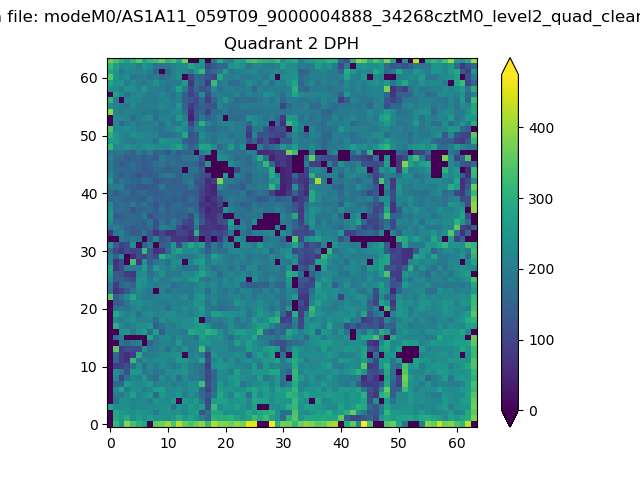 |
Quadrant C |
| Plot type | Count rate plots | Images |
|---|---|---|
| Comparison with Poisson distribution Blue bars denote a histogram of data divided into 1 sec bins. Red curve is a Poisson curve with rate = median count rate of data. |
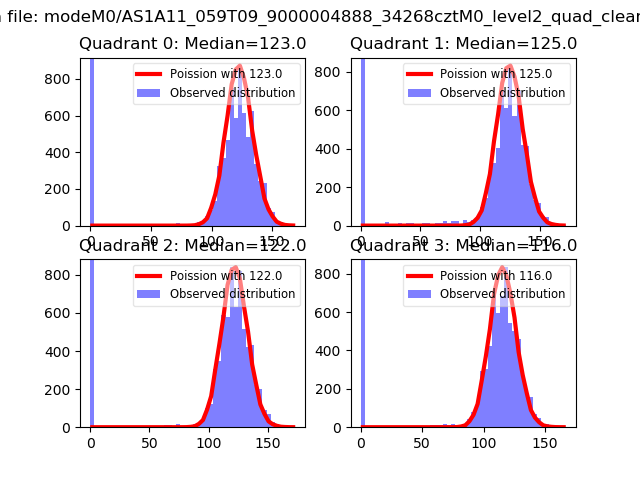 |
 |
| Quadrant-wise count rates Data is divided into 100 sec bins |
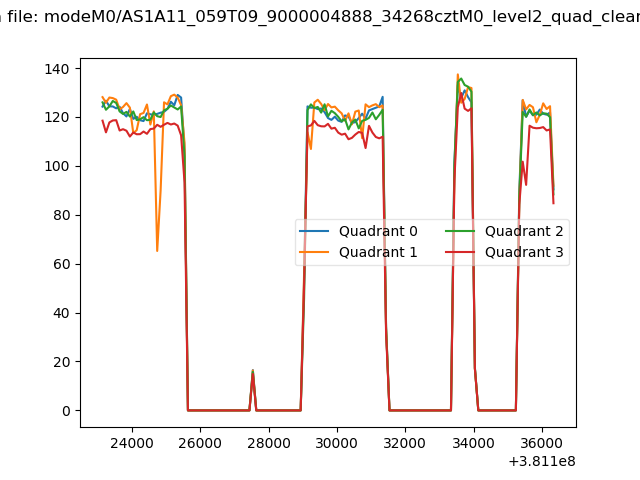 |
|
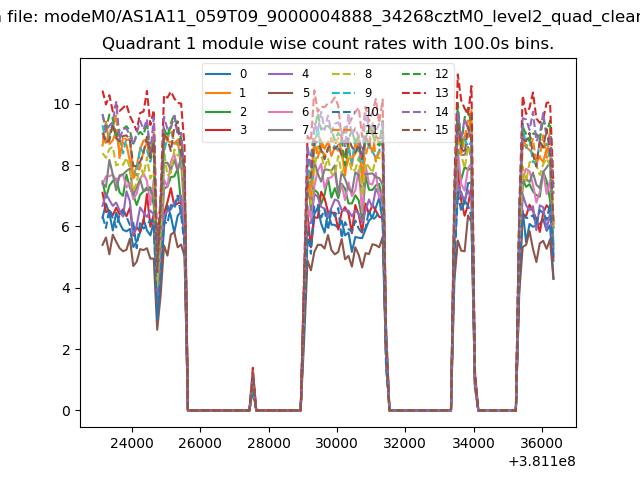
| Module-wise count rates for Quadrant A Data is divided into 100 sec bins |
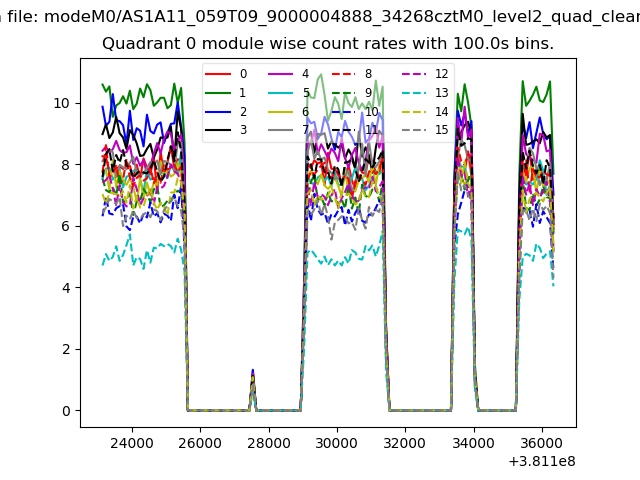 |
 |
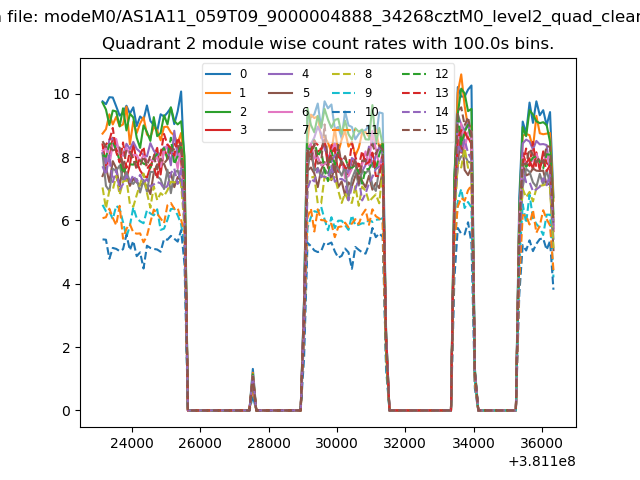
| Module-wise count rates for Quadrant B Data is divided into 100 sec bins |
 |
 |
| Module-wise count rates for Quadrant C Data is divided into 100 sec bins |
 |
 |
| Module-wise count rates for Quadrant D Data is divided into 100 sec bins |
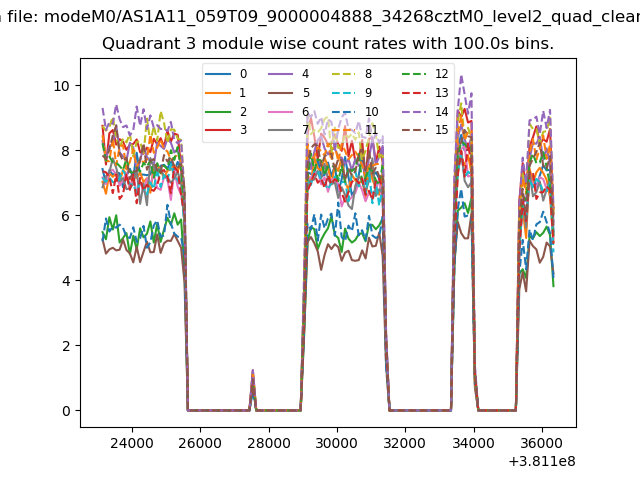 |
 |
| Parameter | Plot |
|---|---|
| CZT HV Monitor | 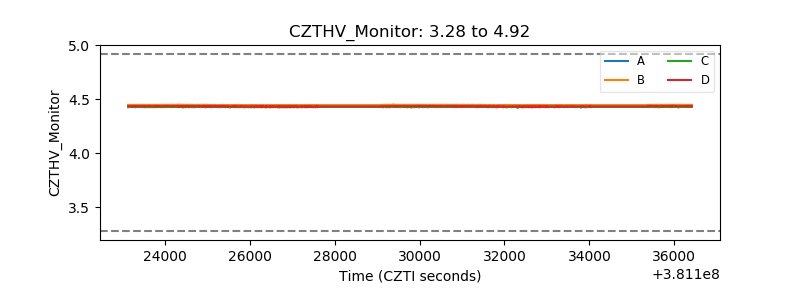 |
| D_VDD | 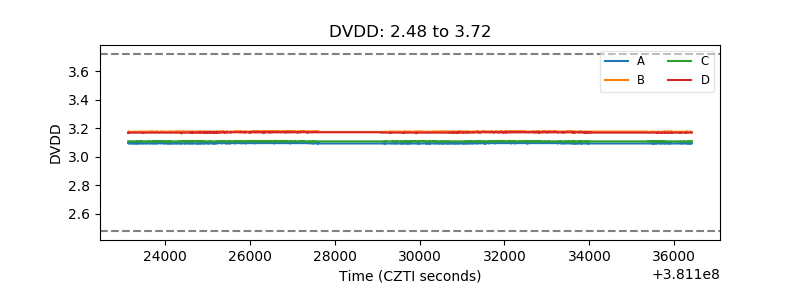 |
| Temperature 1 | 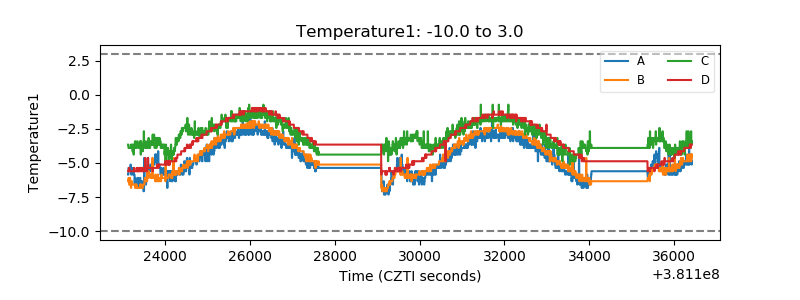 |
| Veto HV Monitor | 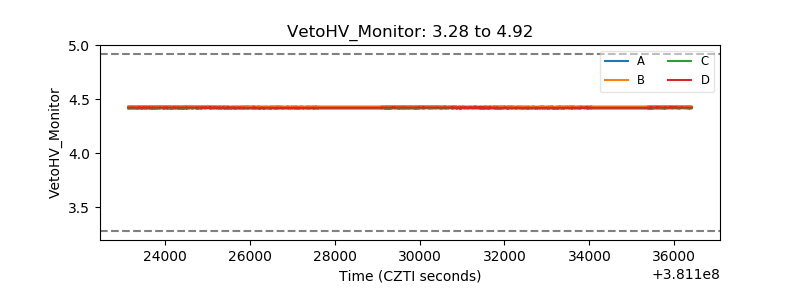 |
| Veto LLD | 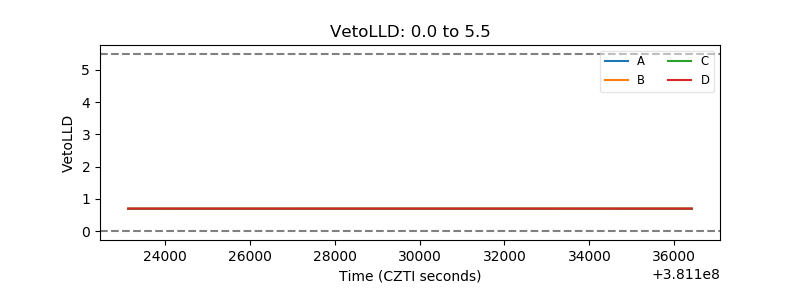 |
| Alpha Counter | 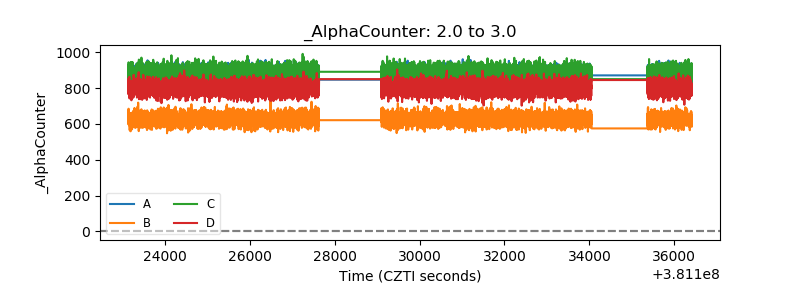 |
| _CPM_Rate | 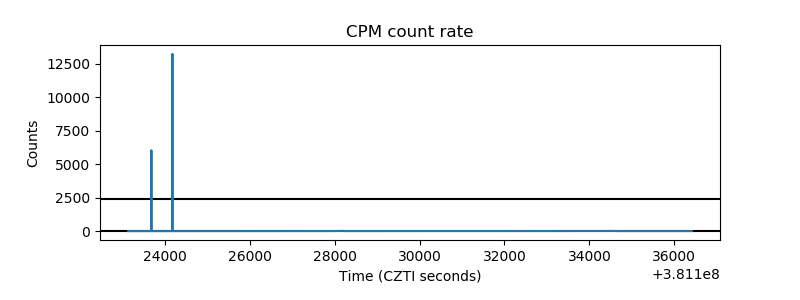 |
| CZT Counter | 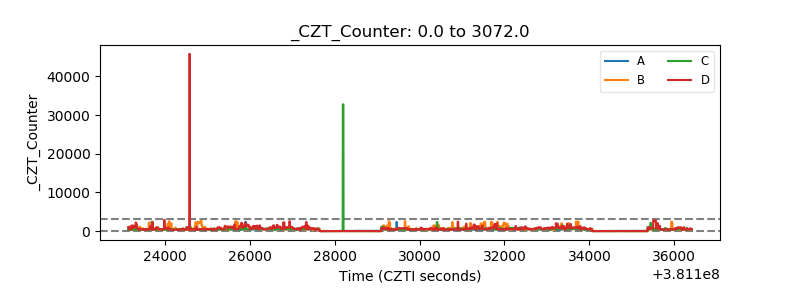 |
| +2.5 Volts monitor | 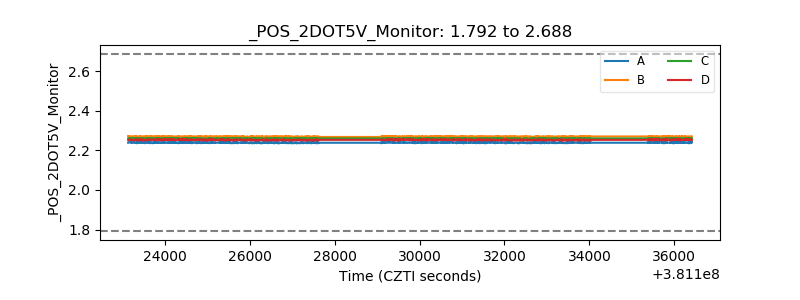 |
| +5 Volts monitor |  |
| _ROLL_ROT | 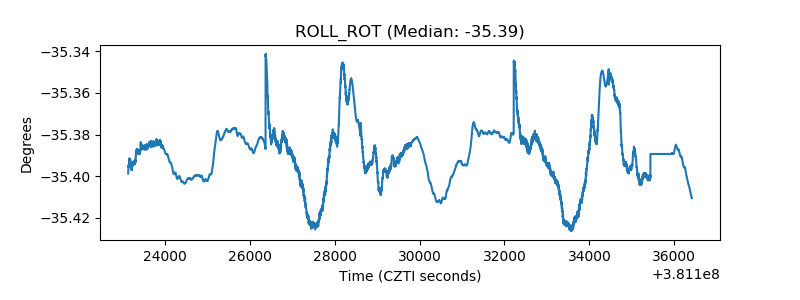 |
| _Roll_DEC | 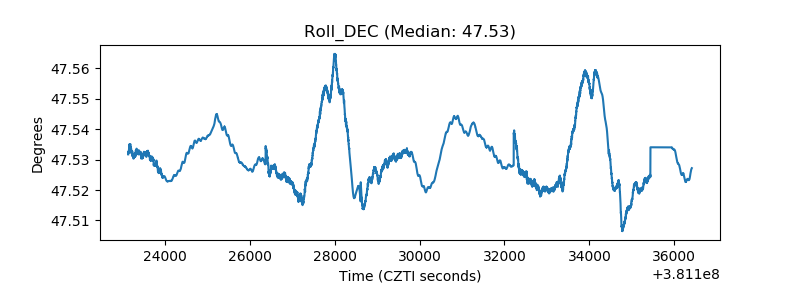 |
| _Roll_RA | 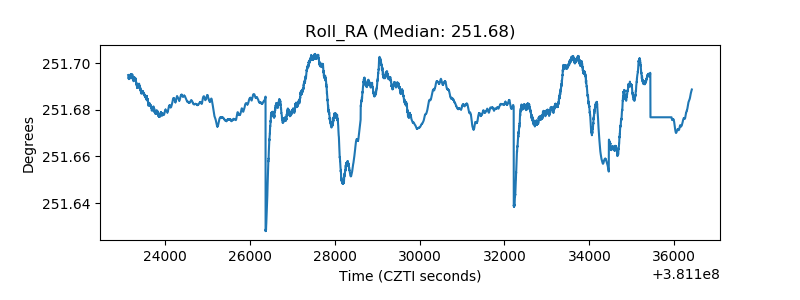 |
| Veto Counter | 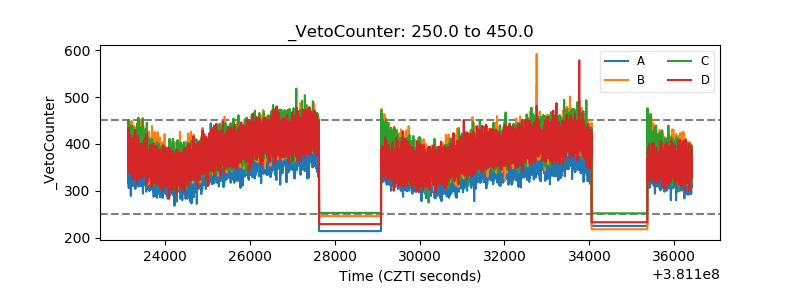 |