| Param | Original file | Final file |
|---|---|---|
| Filename | modeM0/AS1A11_059T09_9000004888_34267cztM0_level2.evt | modeM0/AS1A11_059T09_9000004888_34267cztM0_level2_quad_clean.evt |
| Size (bytes) | 242,976,960 | 31,135,680 |
| Size | 231.7 MB | 29.7 MB |
| Events in quadrant A | 1,463,829 | 190,647 |
| Events in quadrant B | 1,834,492 | 179,294 |
| Events in quadrant C | 1,605,684 | 187,212 |
| Events in quadrant D | 2,249,158 | 172,077 |
| Mode M0 | |||
|---|---|---|---|
| Quadrant | BADHDUFLAG | Total packets | Discarded packets |
| A | 0 | 11080 | 4751 |
| B | 0 | 14226 | 6913 |
| C | 0 | 11981 | 5396 |
| D | 0 | 15971 | 7323 |
| Mode SS | |||
|---|---|---|---|
| Quadrant | BADHDUFLAG | Total packets | Discarded packets |
| A | 0 | 109 | 43 |
| B | 0 | 112 | 44 |
| C | 0 | 116 | 50 |
| D | 0 | 114 | 48 |
| Mode M9 | |||
|---|---|---|---|
| Quadrant | BADHDUFLAG | Total packets | Discarded packets |
| A | 0 | 16 | 3 |
| B | 0 | 16 | 3 |
| C | 0 | 16 | 4 |
| D | 0 | 15 | 1 |
| Quadrant | Total seconds | Saturated seconds | Saturation percentage |
|---|---|---|---|
| A | 3065 | 21 | 0.685155% |
| B | 2924 | 93 | 3.180575% |
| C | 3009 | 10 | 0.332336% |
| D | 2867 | 71 | 2.476456% |
Noise dominated data is calculated using 1-second bins in cleaned event files. If a bin has >2000 counts, and if more than 50% of those come from <1% of pixels, then it is considered to be noise-dominated and hence unusable.
| Quadrant | # 1 sec bins | Bins with >0 counts | Bins with >2000 counts | High rate bins dominated by noise | Noise dominated (total time) | Noise dominated (detector-on time) | Marked lightcurve |
|---|---|---|---|---|---|---|---|
| A | 6910 | 3562 | 17 | 17 | 0.25% | 0.48% |  |
| B | 6710 | 3417 | 57 | 57 | 0.85% | 1.67% | 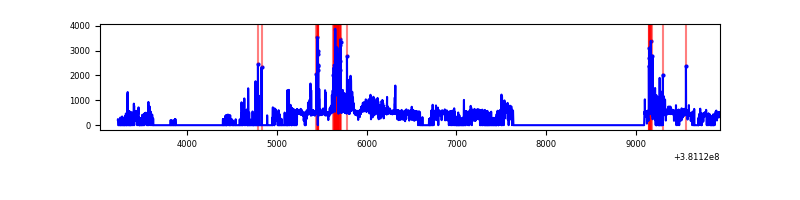 |
| C | 6716 | 3499 | 8 | 8 | 0.12% | 0.23% | 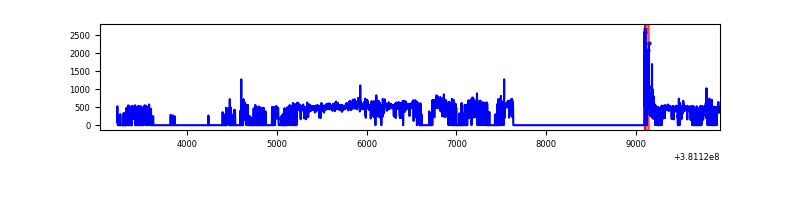 |
| D | 6748 | 3368 | 51 | 51 | 0.76% | 1.51% | 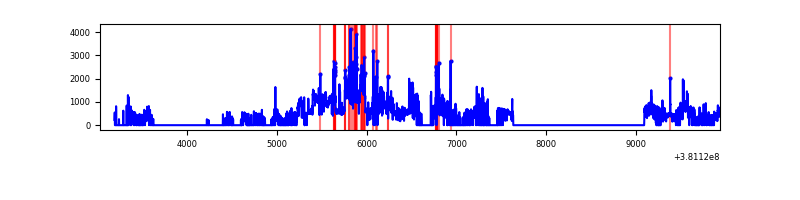 |
Top three noisy pixels from each quadrant. If the there are fewer than three noisy pixels in the level2.evt file, extra rows are filled as -1
| Pixel properties | Quadrant properties | ||||||
|---|---|---|---|---|---|---|---|
| Quadrant | DetID | PixID | Counts | Sigma | Mean | Median | Sigma |
| A | 9 | 143 | 61175 | 835.86 | 358 | 351 | 72.8 |
| A | 10 | 83 | 11852 | 158.05 | 358 | 351 | 72.8 |
| A | 13 | 6 | 5300 | 68.01 | 358 | 351 | 72.8 |
| B | 5 | 172 | 312495 | 4746.1 | 337 | 328 | 65.8 |
| B | 0 | 189 | 120145 | 1821.67 | 337 | 328 | 65.8 |
| B | 0 | 229 | 41550 | 626.73 | 337 | 328 | 65.8 |
| C | 15 | 214 | 130940 | 1634.06 | 341 | 343 | 79.9 |
| C | 14 | 67 | 66077 | 822.48 | 341 | 343 | 79.9 |
| C | 0 | 10 | 49260 | 612.06 | 341 | 343 | 79.9 |
| D | 8 | 195 | 753800 | 9149.78 | 323 | 313 | 82.4 |
| D | 13 | 249 | 81286 | 983.28 | 323 | 313 | 82.4 |
| D | 10 | 199 | 40400 | 486.79 | 323 | 313 | 82.4 |
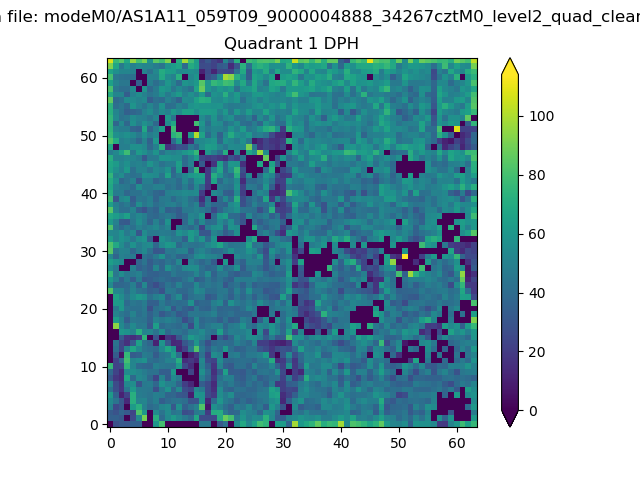
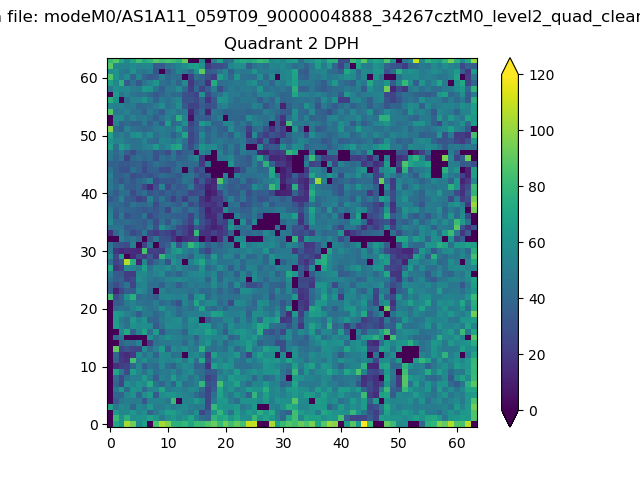
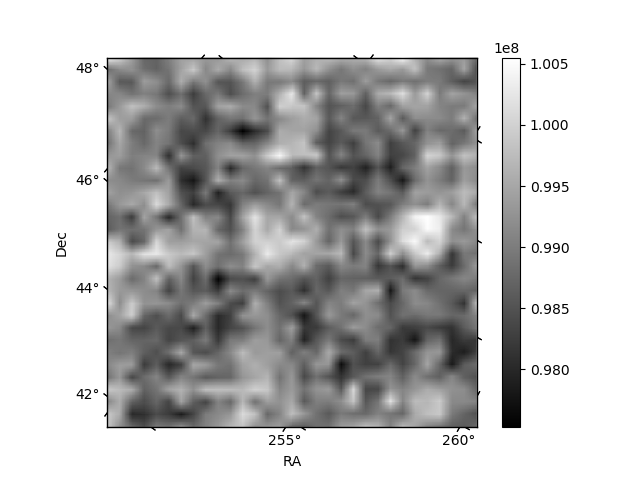
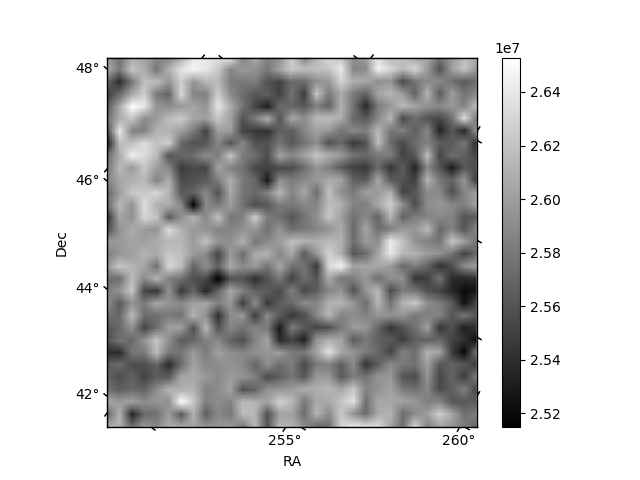
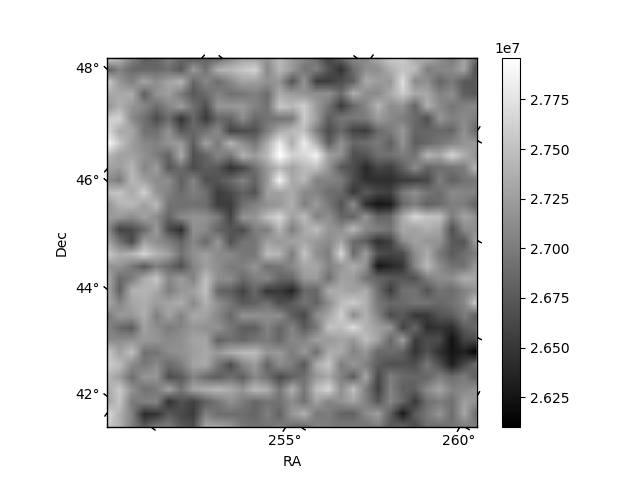
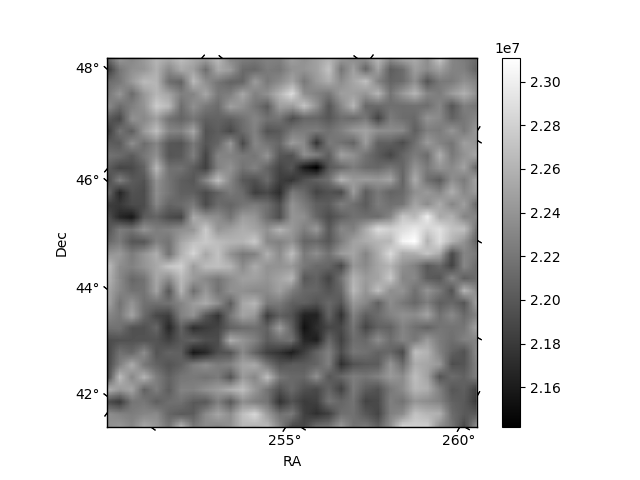
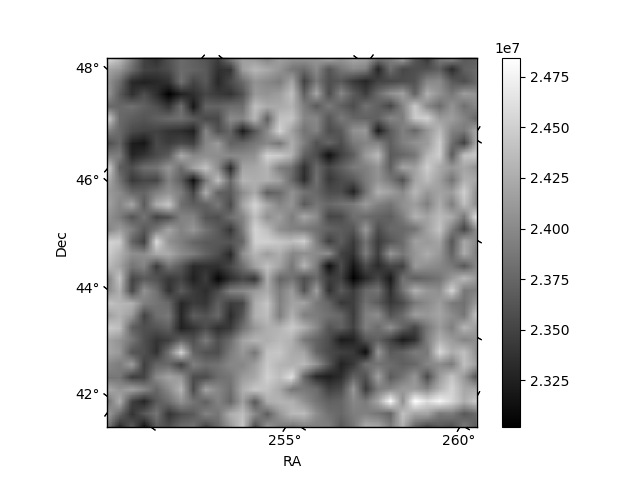
Histogram calculated using DETX and DETY for each event in the final _common_clean file
| Quadrant A | 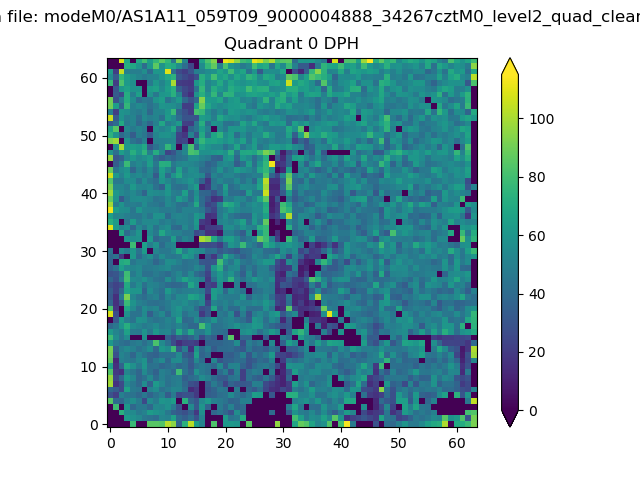 |
 |
Quadrant B |
|---|---|---|---|
| Quadrant D | 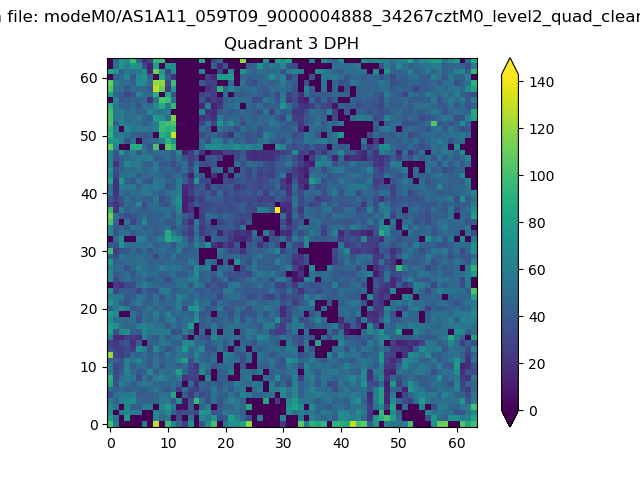 |
 |
Quadrant C |
| Plot type | Count rate plots | Images |
|---|---|---|
| Comparison with Poisson distribution Blue bars denote a histogram of data divided into 1 sec bins. Red curve is a Poisson curve with rate = median count rate of data. |
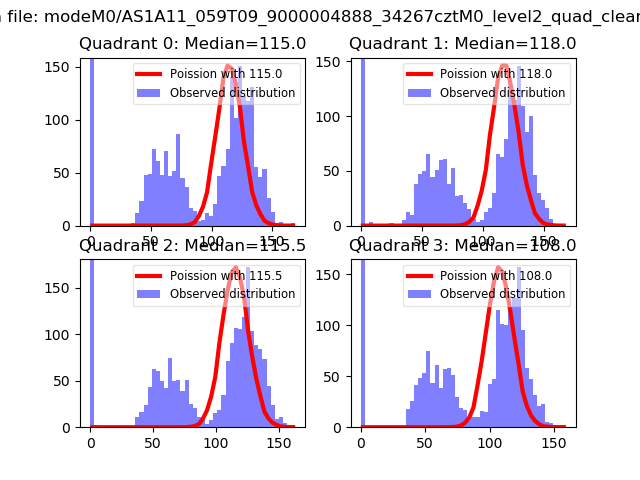 |
 |
| Quadrant-wise count rates Data is divided into 100 sec bins |
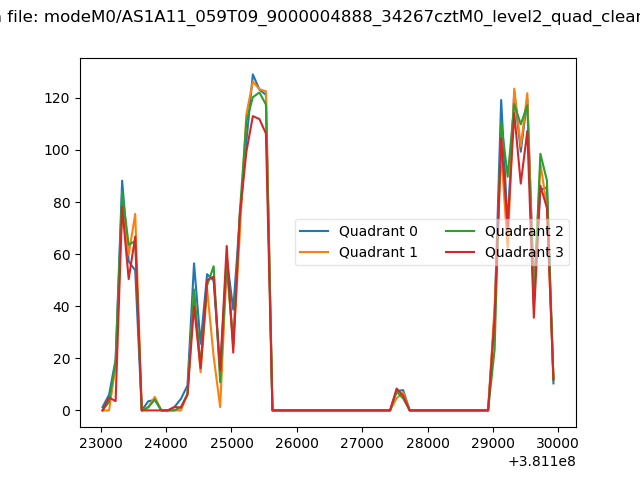 |
|
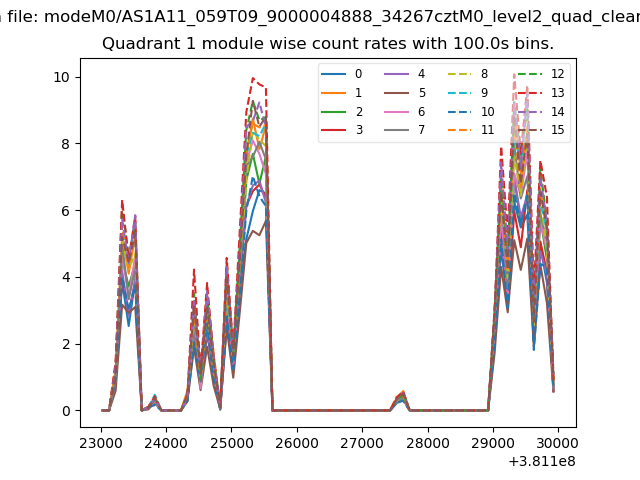
| Module-wise count rates for Quadrant A Data is divided into 100 sec bins |
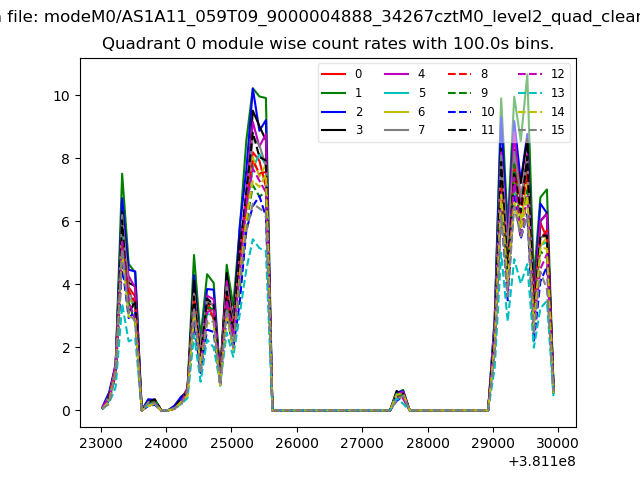 |
 |
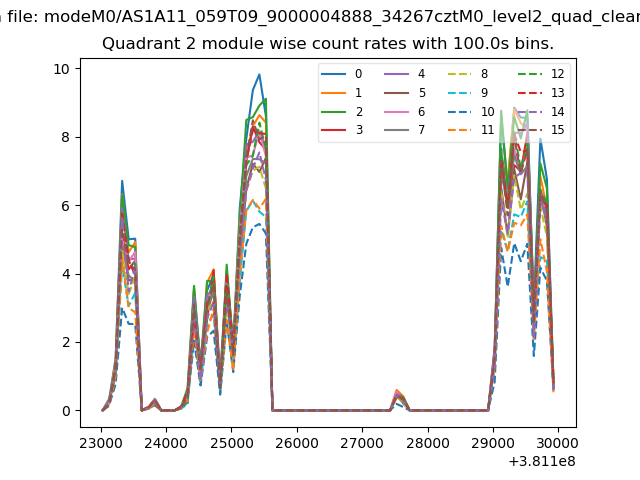
| Module-wise count rates for Quadrant B Data is divided into 100 sec bins |
 |
 |
| Module-wise count rates for Quadrant C Data is divided into 100 sec bins |
 |
 |
| Module-wise count rates for Quadrant D Data is divided into 100 sec bins |
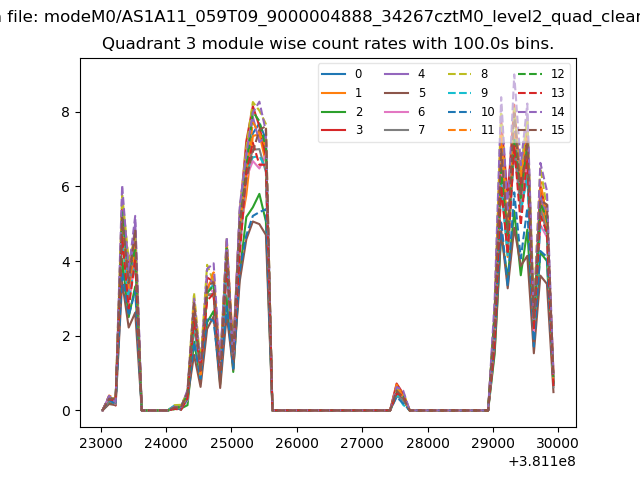 |
 |
| Parameter | Plot |
|---|---|
| CZT HV Monitor | 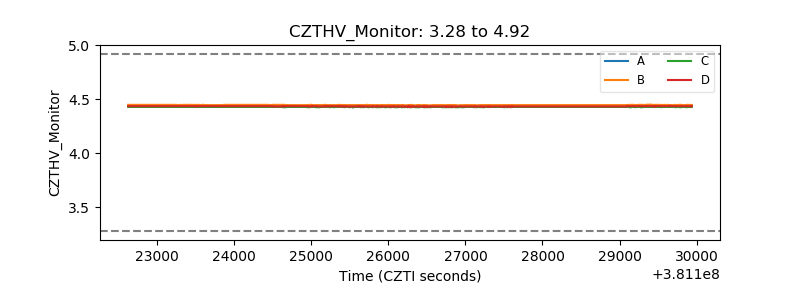 |
| D_VDD | 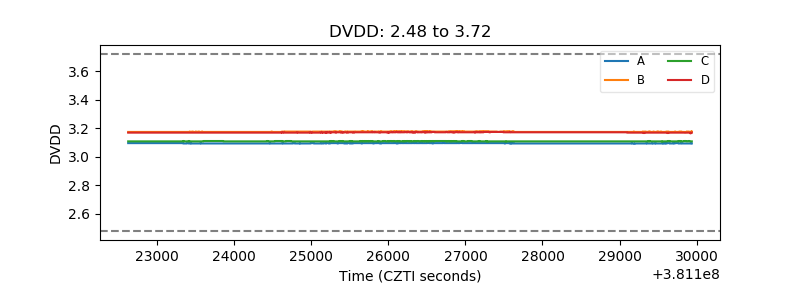 |
| Temperature 1 | 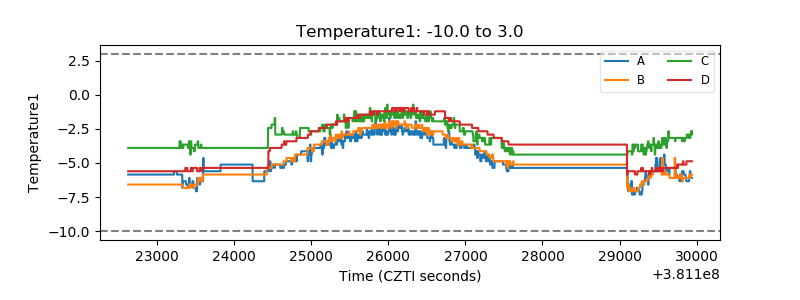 |
| Veto HV Monitor | 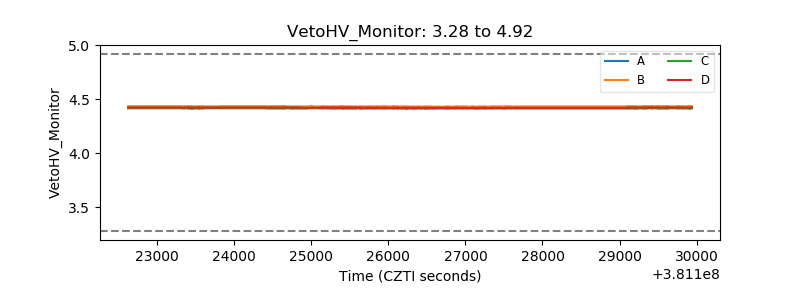 |
| Veto LLD | 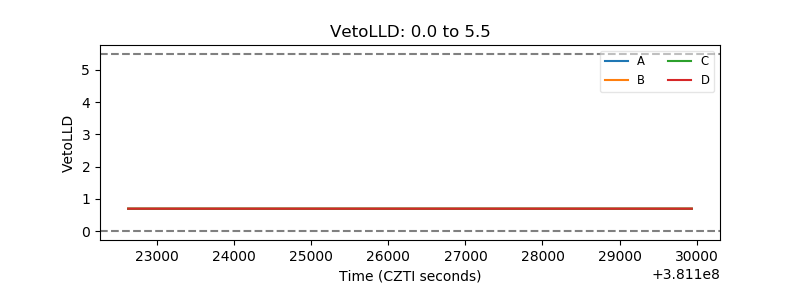 |
| Alpha Counter | 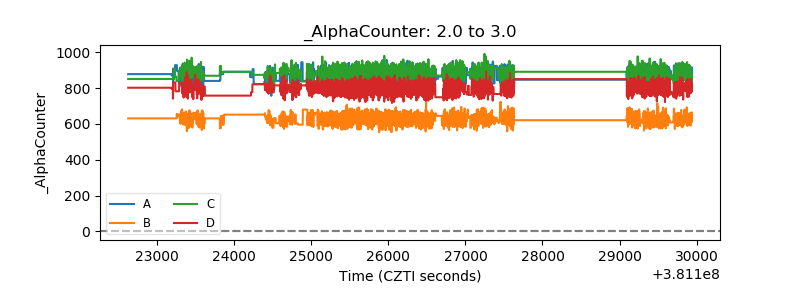 |
| _CPM_Rate | 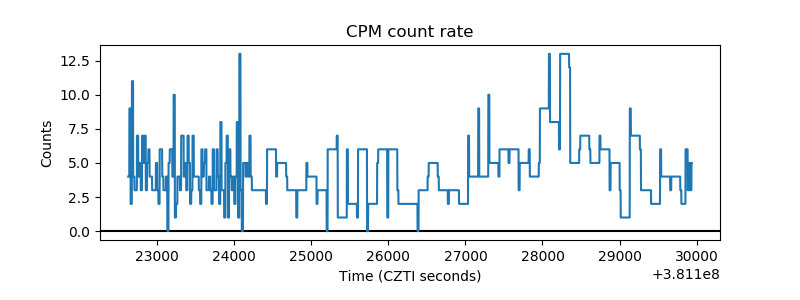 |
| CZT Counter | 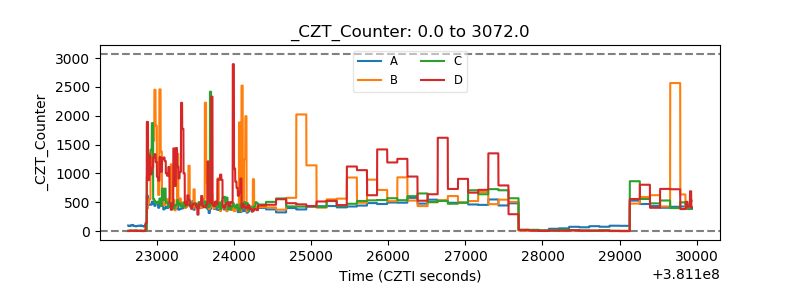 |
| +2.5 Volts monitor | 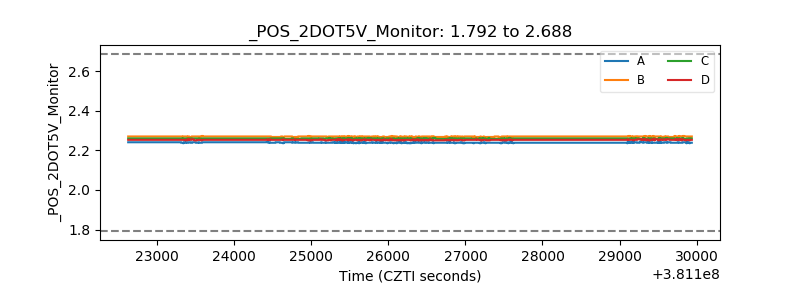 |
| +5 Volts monitor | 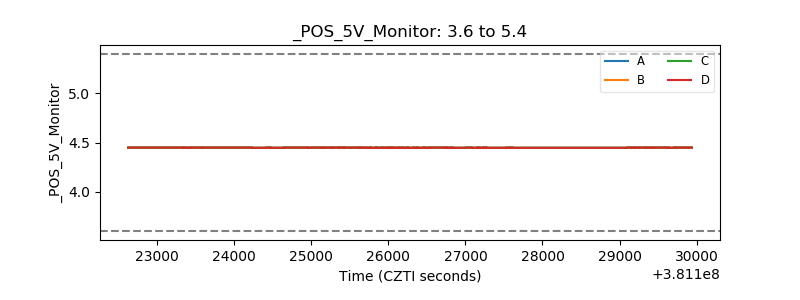 |
| _ROLL_ROT | 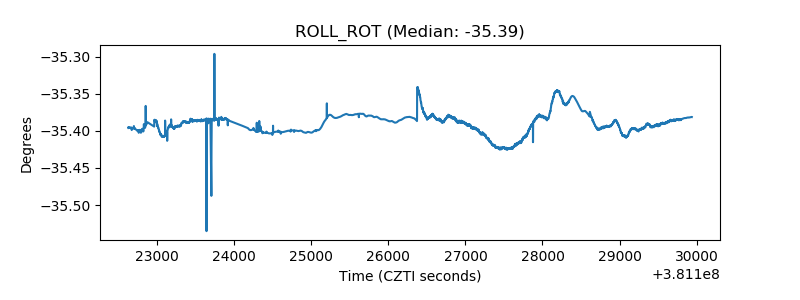 |
| _Roll_DEC | 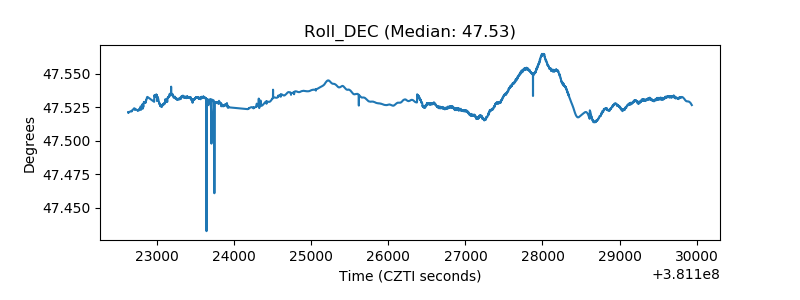 |
| _Roll_RA | 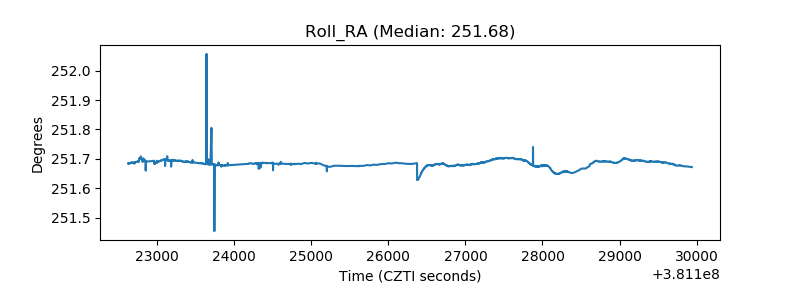 |
| Veto Counter | 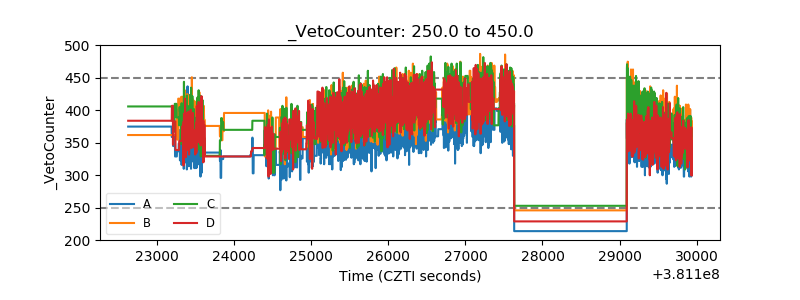 |