| Param | Original file | Final file |
|---|---|---|
| Filename | modeM0/AS1A11_059T09_9000004888_34263cztM0_level2.evt | modeM0/AS1A11_059T09_9000004888_34263cztM0_level2_quad_clean.evt |
| Size (bytes) | 478,713,600 | 89,807,040 |
| Size | 456.5 MB | 85.6 MB |
| Events in quadrant A | 2,536,842 | 598,590 |
| Events in quadrant B | 3,645,980 | 608,541 |
| Events in quadrant C | 3,641,526 | 603,553 |
| Events in quadrant D | 4,338,855 | 562,655 |
| Mode M0 | |||
|---|---|---|---|
| Quadrant | BADHDUFLAG | Total packets | Discarded packets |
| A | 0 | 10500 | 0 |
| B | 0 | 13989 | 0 |
| C | 0 | 14130 | 0 |
| D | 0 | 16259 | 0 |
| Mode SS | |||
|---|---|---|---|
| Quadrant | BADHDUFLAG | Total packets | Discarded packets |
| A | 0 | 100 | 0 |
| B | 0 | 100 | 0 |
| C | 0 | 100 | 0 |
| D | 0 | 100 | 0 |
| Mode M9 | |||
|---|---|---|---|
| Quadrant | BADHDUFLAG | Total packets | Discarded packets |
| A | 0 | 35 | 0 |
| B | 0 | 35 | 0 |
| C | 0 | 35 | 0 |
| D | 0 | 36 | 0 |
| Quadrant | Total seconds | Saturated seconds | Saturation percentage |
|---|---|---|---|
| A | 4941 | 15 | 0.303582% |
| B | 4941 | 352 | 7.124064% |
| C | 4941 | 156 | 3.157256% |
| D | 4941 | 311 | 6.294272% |
Noise dominated data is calculated using 1-second bins in cleaned event files. If a bin has >2000 counts, and if more than 50% of those come from <1% of pixels, then it is considered to be noise-dominated and hence unusable.
| Quadrant | # 1 sec bins | Bins with >0 counts | Bins with >2000 counts | High rate bins dominated by noise | Noise dominated (total time) | Noise dominated (detector-on time) | Marked lightcurve |
|---|---|---|---|---|---|---|---|
| A | 7063 | 4942 | 8 | 8 | 0.11% | 0.16% | 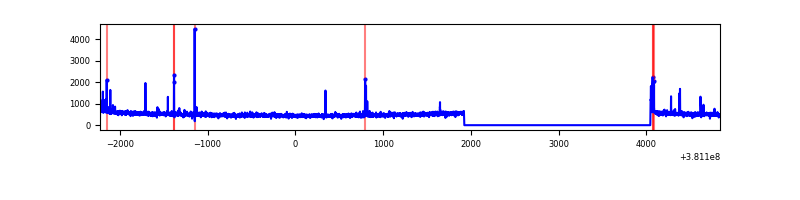 |
| B | 7063 | 4942 | 219 | 219 | 3.10% | 4.43% | 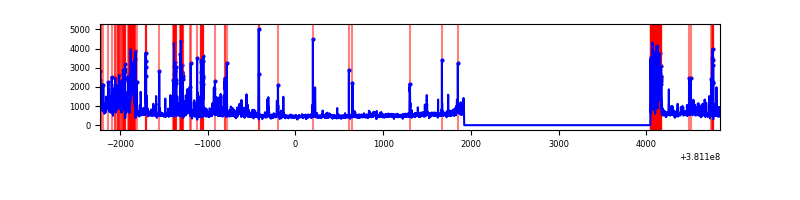 |
| C | 7063 | 4942 | 127 | 127 | 1.80% | 2.57% | 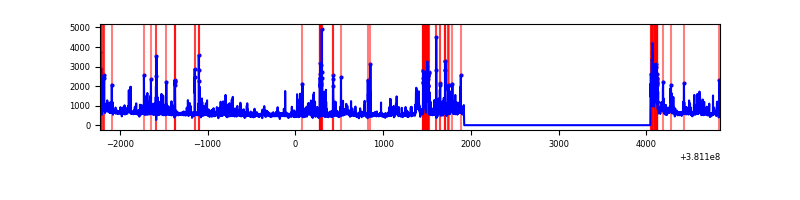 |
| D | 7063 | 4942 | 255 | 255 | 3.61% | 5.16% | 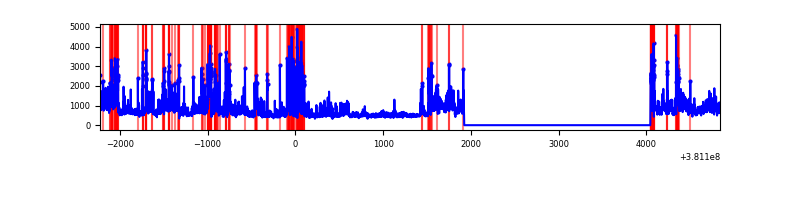 |
Top three noisy pixels from each quadrant. If the there are fewer than three noisy pixels in the level2.evt file, extra rows are filled as -1
| Pixel properties | Quadrant properties | ||||||
|---|---|---|---|---|---|---|---|
| Quadrant | DetID | PixID | Counts | Sigma | Mean | Median | Sigma |
| A | 15 | 169 | 59114 | 472.86 | 622 | 613 | 123.7 |
| A | 10 | 83 | 25432 | 200.61 | 622 | 613 | 123.7 |
| A | 9 | 143 | 24037 | 189.33 | 622 | 613 | 123.7 |
| B | 5 | 172 | 1003949 | 8816.41 | 607 | 594 | 113.8 |
| B | 0 | 182 | 102184 | 892.66 | 607 | 594 | 113.8 |
| B | 0 | 189 | 77588 | 676.54 | 607 | 594 | 113.8 |
| C | 0 | 207 | 388775 | 2781.23 | 613 | 621 | 139.6 |
| C | 0 | 239 | 386523 | 2765.1 | 613 | 621 | 139.6 |
| C | 15 | 214 | 217214 | 1551.95 | 613 | 621 | 139.6 |
| D | 8 | 195 | 832873 | 5386.7 | 593 | 583 | 154.5 |
| D | 10 | 199 | 319084 | 2061.39 | 593 | 583 | 154.5 |
| D | 2 | 250 | 176606 | 1139.25 | 593 | 583 | 154.5 |
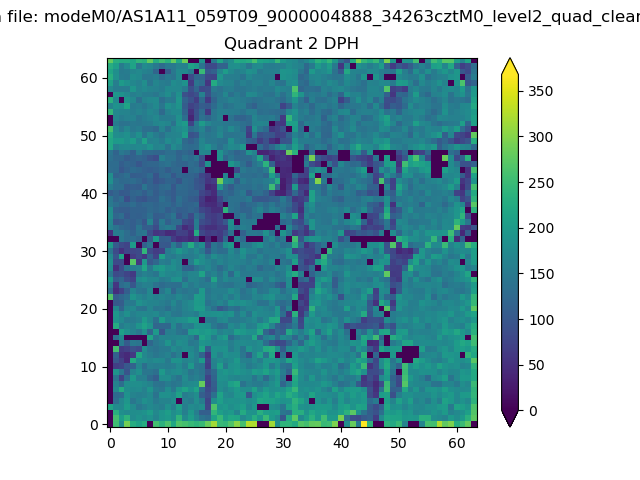
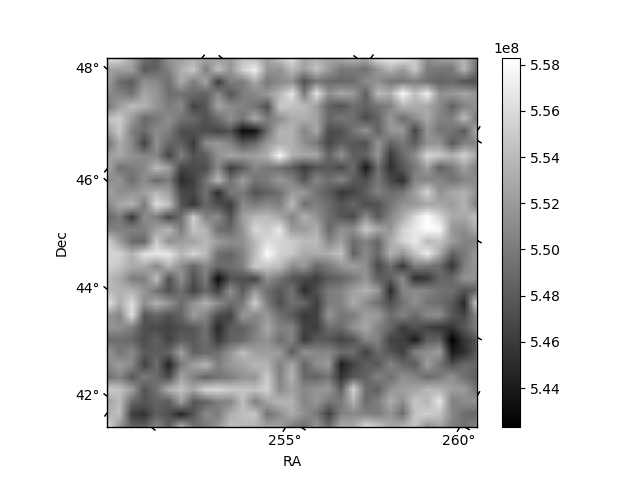
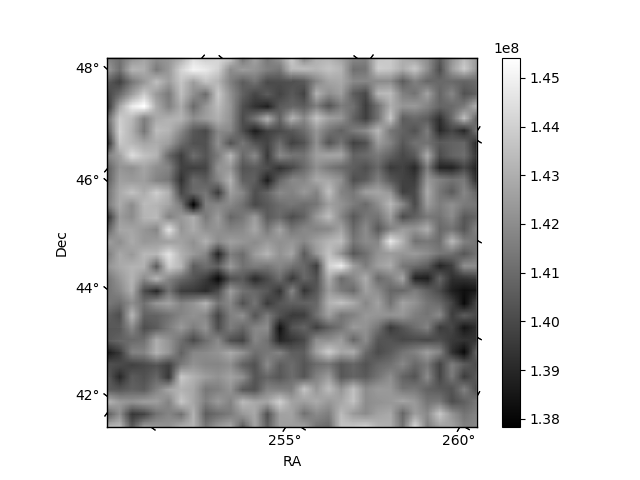
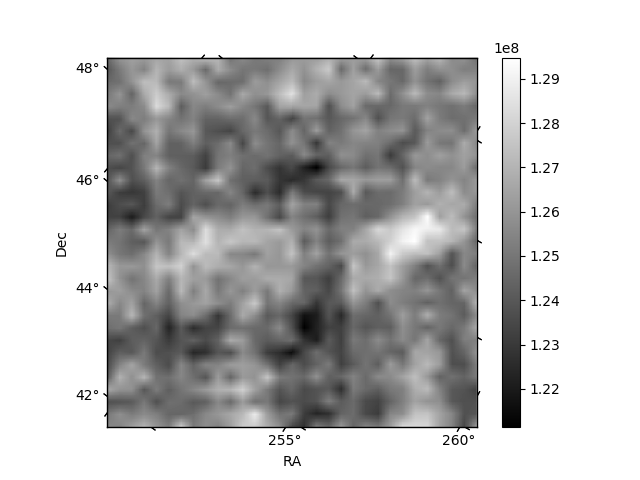
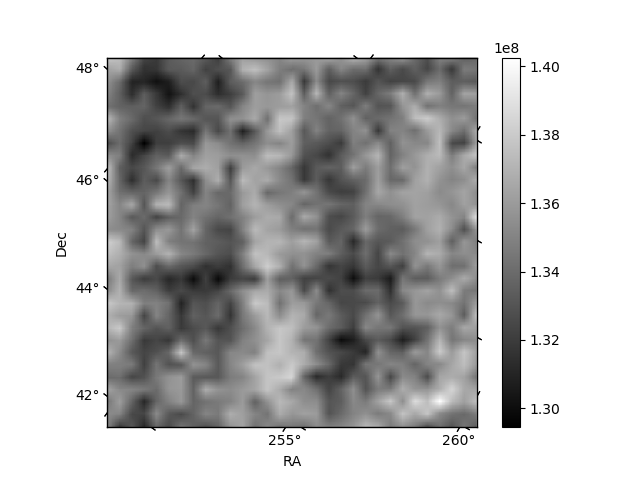
Histogram calculated using DETX and DETY for each event in the final _common_clean file
| Quadrant A | 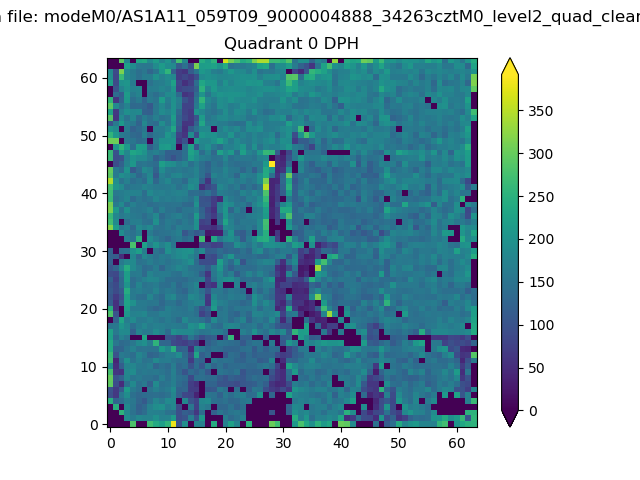 |
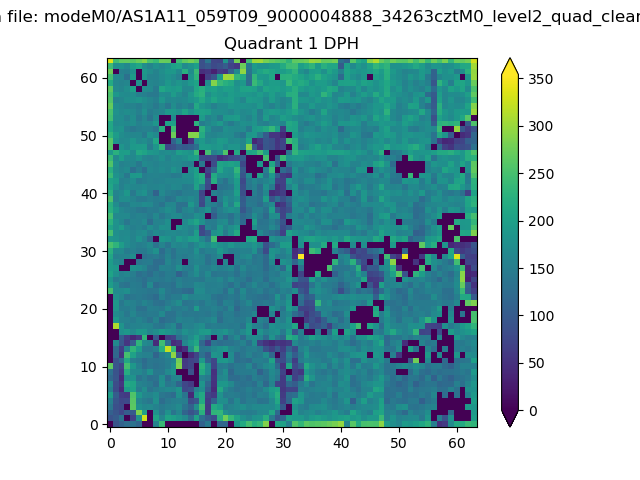 |
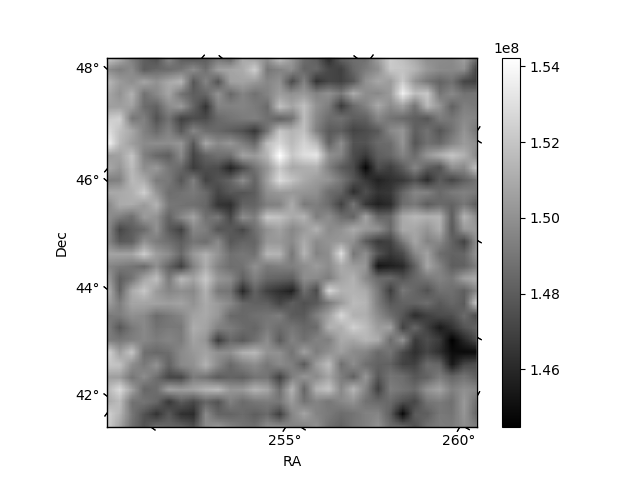
Quadrant B |
|---|---|---|---|
| Quadrant D | 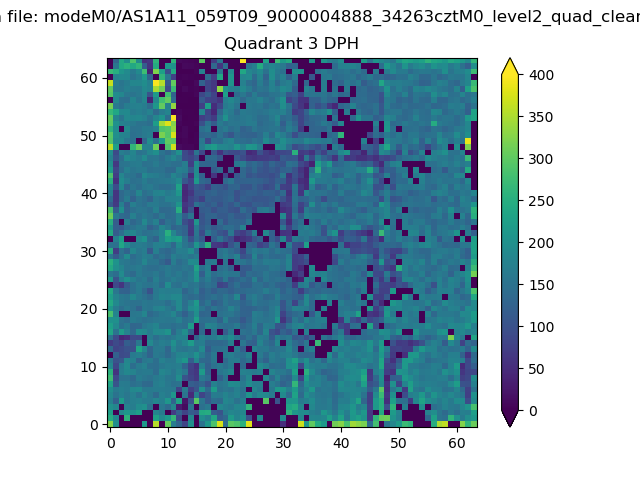 |
 |
Quadrant C |
| Plot type | Count rate plots | Images |
|---|---|---|
| Comparison with Poisson distribution Blue bars denote a histogram of data divided into 1 sec bins. Red curve is a Poisson curve with rate = median count rate of data. |
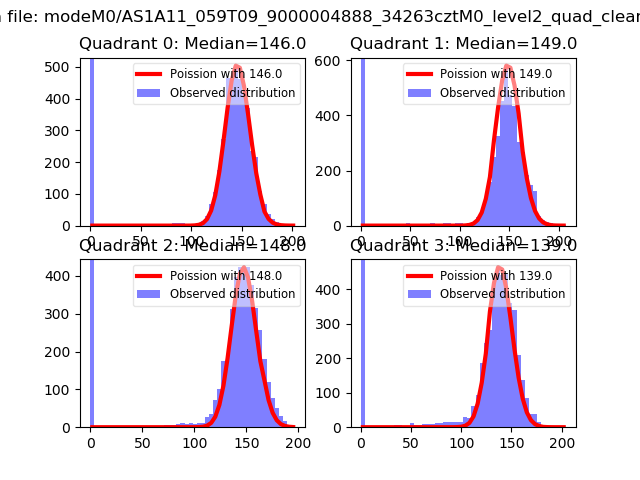 |
 |
| Quadrant-wise count rates Data is divided into 100 sec bins |
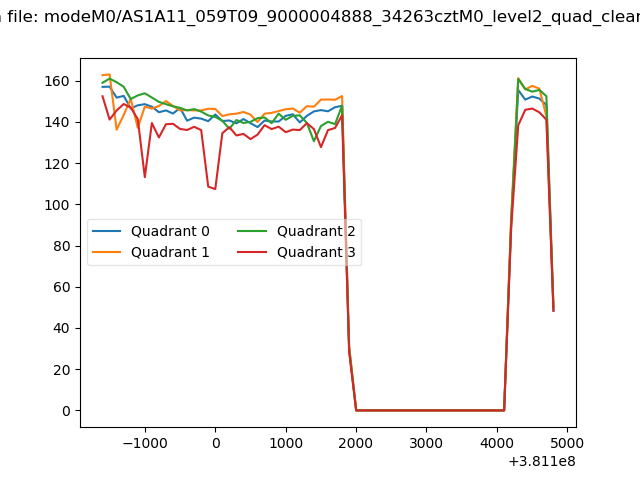 |
|
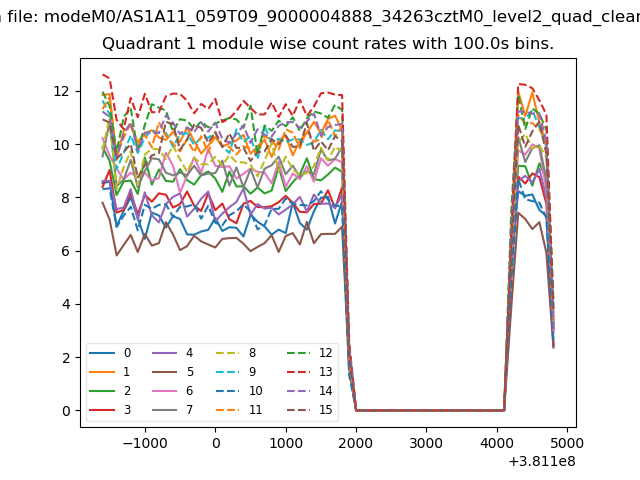
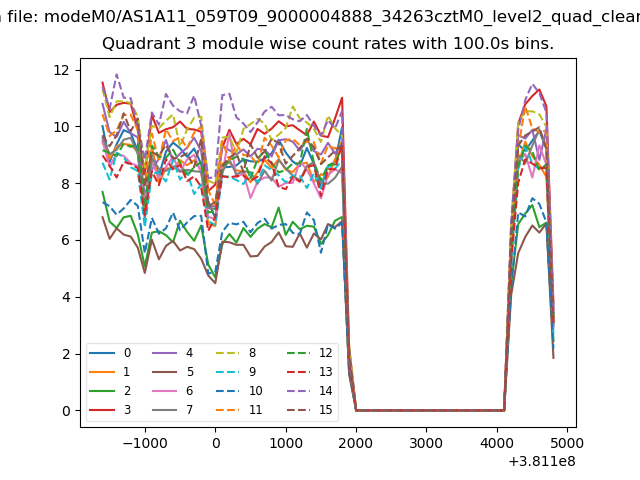
| Module-wise count rates for Quadrant A Data is divided into 100 sec bins |
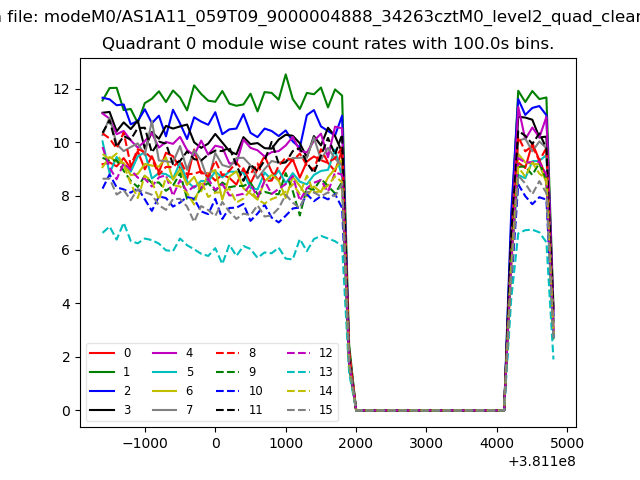 |
 |
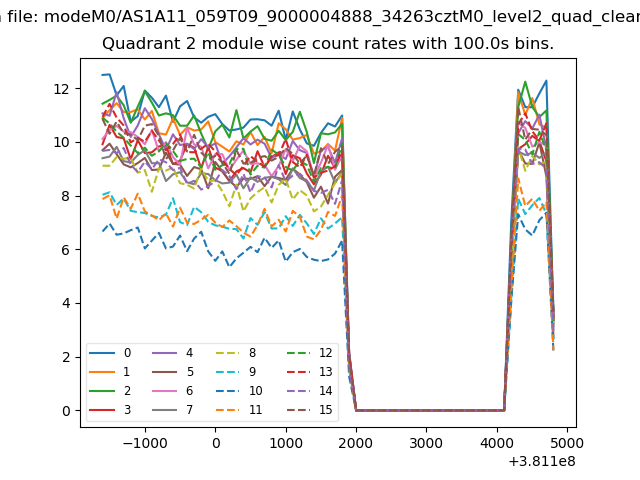
| Module-wise count rates for Quadrant B Data is divided into 100 sec bins |
 |
 |
| Module-wise count rates for Quadrant C Data is divided into 100 sec bins |
 |
 |
| Module-wise count rates for Quadrant D Data is divided into 100 sec bins |
 |
 |
| Parameter | Plot |
|---|---|
| CZT HV Monitor | 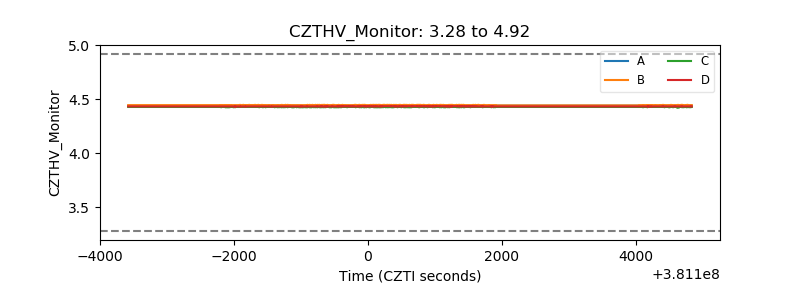 |
| D_VDD | 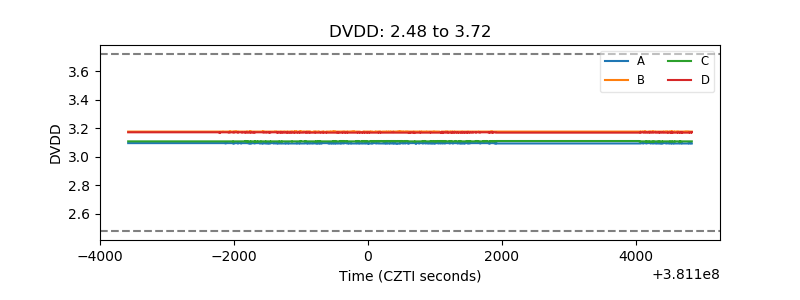 |
| Temperature 1 | 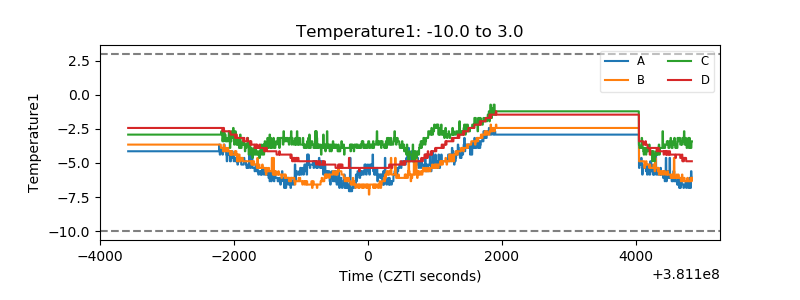 |
| Veto HV Monitor | 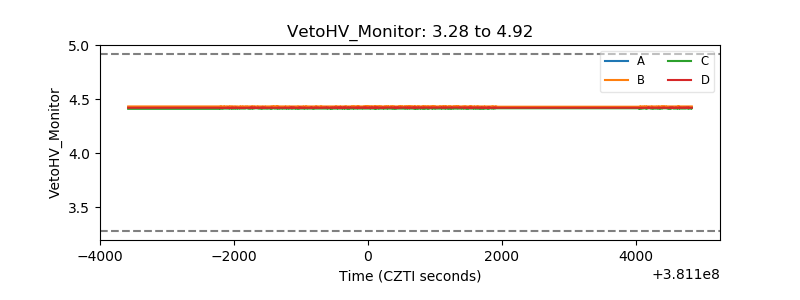 |
| Veto LLD | 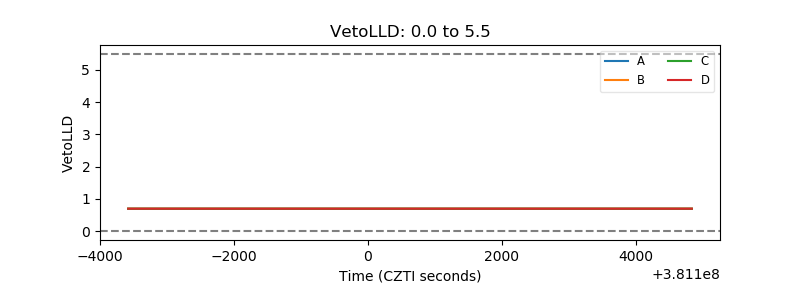 |
| Alpha Counter | 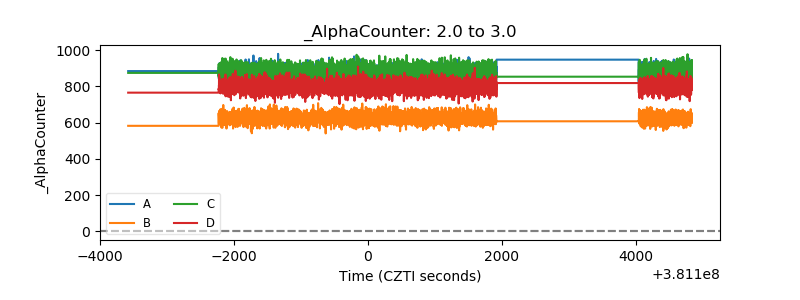 |
| _CPM_Rate | 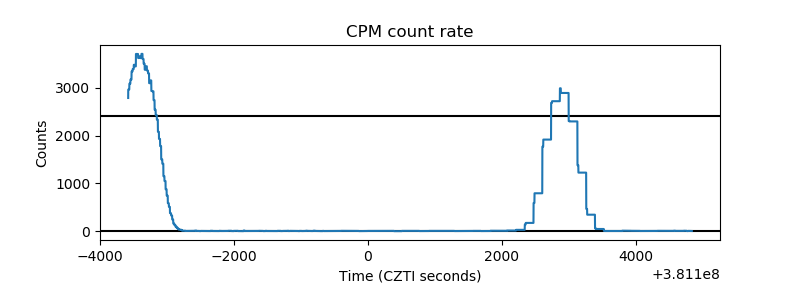 |
| CZT Counter | 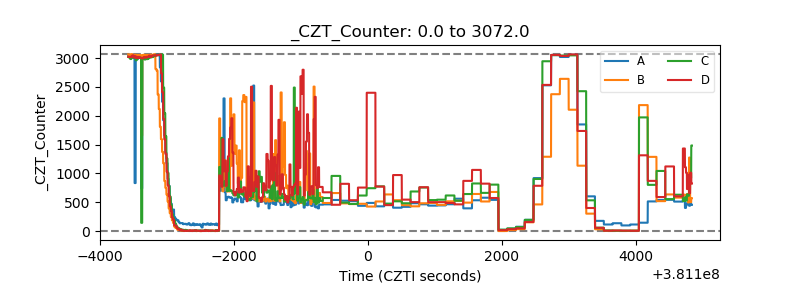 |
| +2.5 Volts monitor | 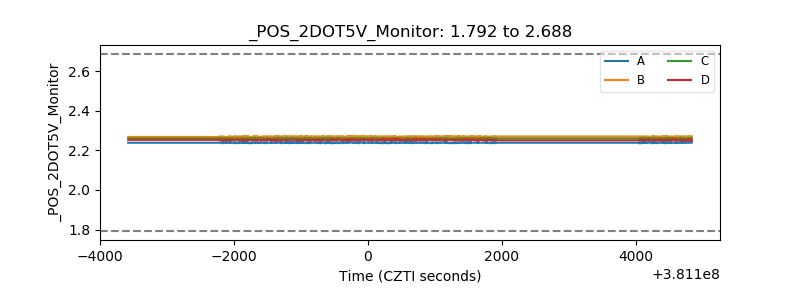 |
| +5 Volts monitor | 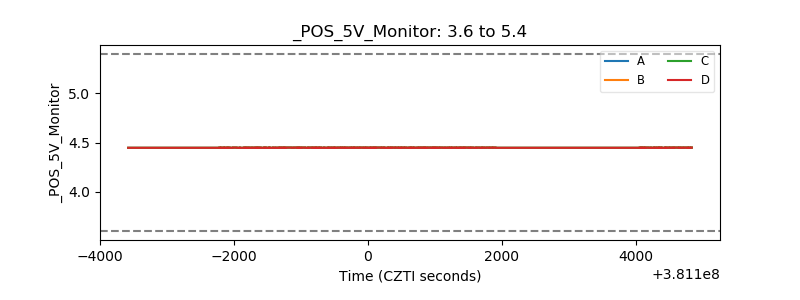 |
| _ROLL_ROT |  |
| _Roll_DEC | 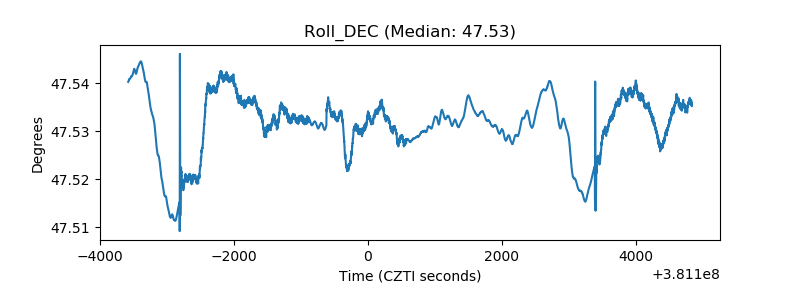 |
| _Roll_RA | 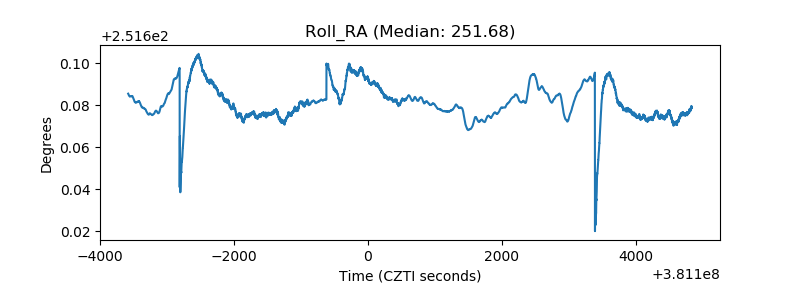 |
| Veto Counter | 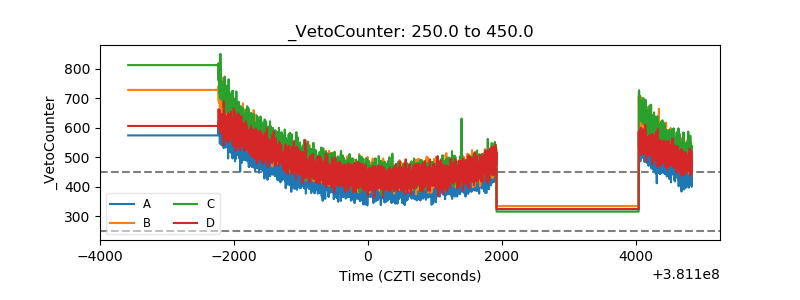 |