| Param | Original file | Final file |
|---|---|---|
| Filename | modeM0/AS1A11_059T09_9000004888_34262cztM0_level2.evt | modeM0/AS1A11_059T09_9000004888_34262cztM0_level2_quad_clean.evt |
| Size (bytes) | 496,180,800 | 72,066,240 |
| Size | 473.2 MB | 68.7 MB |
| Events in quadrant A | 2,609,949 | 462,239 |
| Events in quadrant B | 4,830,767 | 463,254 |
| Events in quadrant C | 3,530,241 | 467,206 |
| Events in quadrant D | 3,722,174 | 444,056 |
| Mode M0 | |||
|---|---|---|---|
| Quadrant | BADHDUFLAG | Total packets | Discarded packets |
| A | 0 | 10800 | 0 |
| B | 0 | 17488 | 0 |
| C | 0 | 13839 | 0 |
| D | 0 | 14438 | 0 |
| Mode SS | |||
|---|---|---|---|
| Quadrant | BADHDUFLAG | Total packets | Discarded packets |
| A | 0 | 102 | 0 |
| B | 0 | 102 | 0 |
| C | 0 | 102 | 0 |
| D | 0 | 102 | 0 |
| Mode M9 | |||
|---|---|---|---|
| Quadrant | BADHDUFLAG | Total packets | Discarded packets |
| A | 0 | 33 | 0 |
| B | 0 | 33 | 0 |
| C | 0 | 33 | 0 |
| D | 0 | 34 | 0 |
| Quadrant | Total seconds | Saturated seconds | Saturation percentage |
|---|---|---|---|
| A | 4917 | 31 | 0.630466% |
| B | 4917 | 1038 | 21.110433% |
| C | 4917 | 115 | 2.338824% |
| D | 4917 | 202 | 4.108196% |
Noise dominated data is calculated using 1-second bins in cleaned event files. If a bin has >2000 counts, and if more than 50% of those come from <1% of pixels, then it is considered to be noise-dominated and hence unusable.
| Quadrant | # 1 sec bins | Bins with >0 counts | Bins with >2000 counts | High rate bins dominated by noise | Noise dominated (total time) | Noise dominated (detector-on time) | Marked lightcurve |
|---|---|---|---|---|---|---|---|
| A | 6949 | 4918 | 17 | 17 | 0.24% | 0.35% | 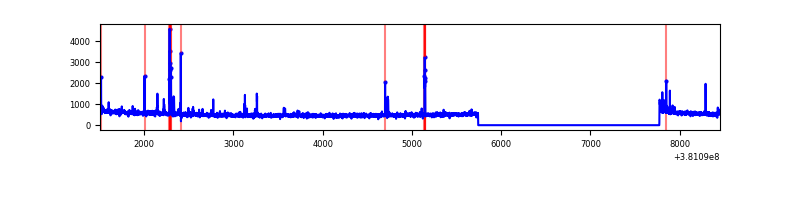 |
| B | 6949 | 4918 | 802 | 802 | 11.54% | 16.31% | 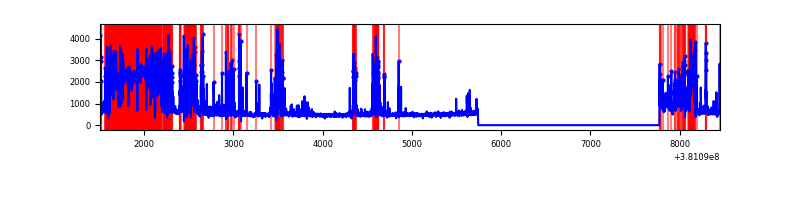 |
| C | 6949 | 4918 | 72 | 72 | 1.04% | 1.46% | 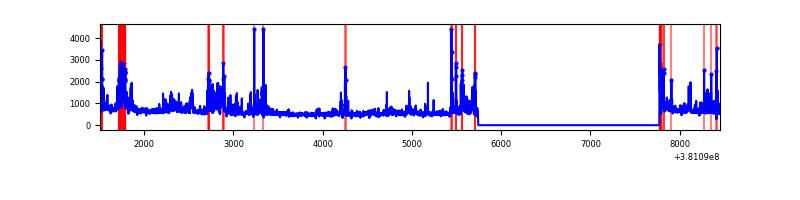 |
| D | 6949 | 4918 | 145 | 145 | 2.09% | 2.95% | 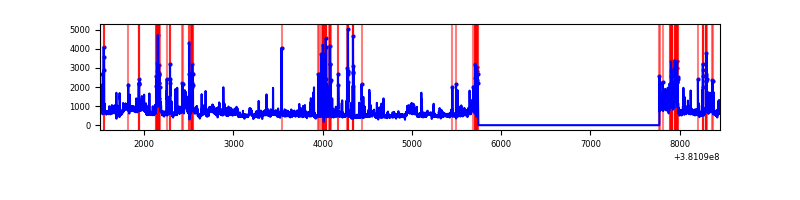 |
Top three noisy pixels from each quadrant. If the there are fewer than three noisy pixels in the level2.evt file, extra rows are filled as -1
| Pixel properties | Quadrant properties | ||||||
|---|---|---|---|---|---|---|---|
| Quadrant | DetID | PixID | Counts | Sigma | Mean | Median | Sigma |
| A | 9 | 143 | 100475 | 795.66 | 629 | 620 | 125.5 |
| A | 10 | 83 | 26088 | 202.93 | 629 | 620 | 125.5 |
| A | 15 | 169 | 24647 | 191.45 | 629 | 620 | 125.5 |
| B | 5 | 172 | 2515148 | 24635.9 | 553 | 540 | 102.1 |
| B | 0 | 182 | 93276 | 908.55 | 553 | 540 | 102.1 |
| B | 0 | 190 | 13541 | 127.37 | 553 | 540 | 102.1 |
| C | 15 | 214 | 213780 | 1499.56 | 623 | 631 | 142.1 |
| C | 0 | 239 | 203845 | 1429.67 | 623 | 631 | 142.1 |
| C | 15 | 159 | 196631 | 1378.92 | 623 | 631 | 142.1 |
| D | 8 | 195 | 580057 | 3907.04 | 612 | 595 | 148.3 |
| D | 10 | 199 | 197703 | 1329.01 | 612 | 595 | 148.3 |
| D | 13 | 249 | 165233 | 1110.08 | 612 | 595 | 148.3 |
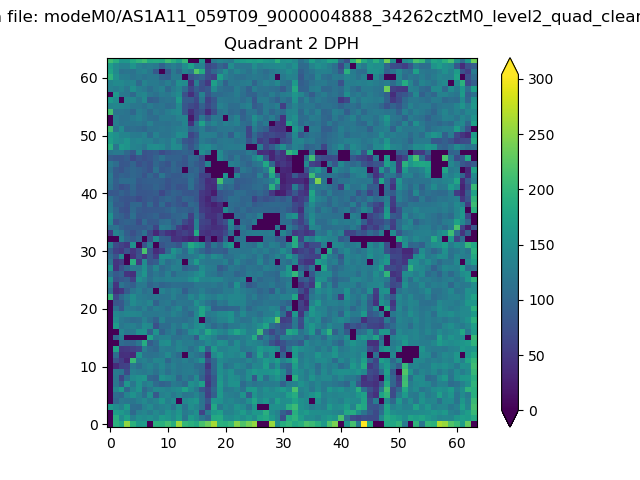
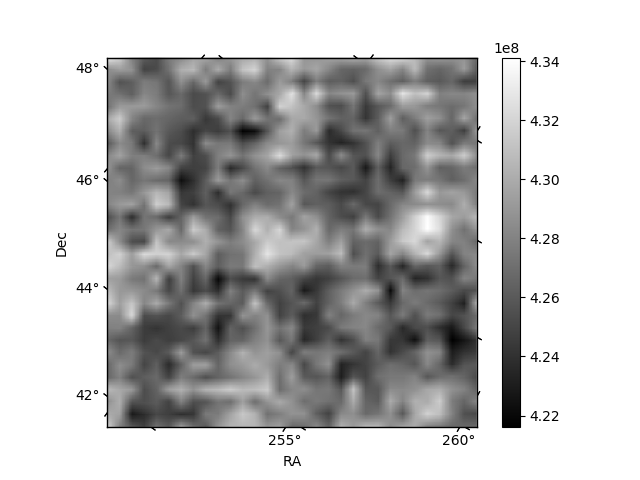
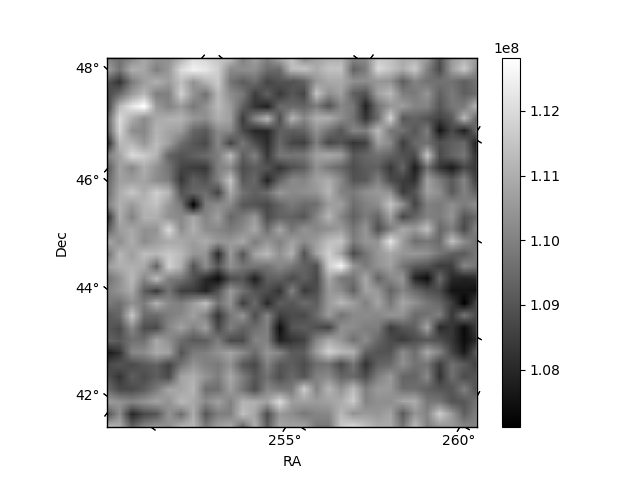
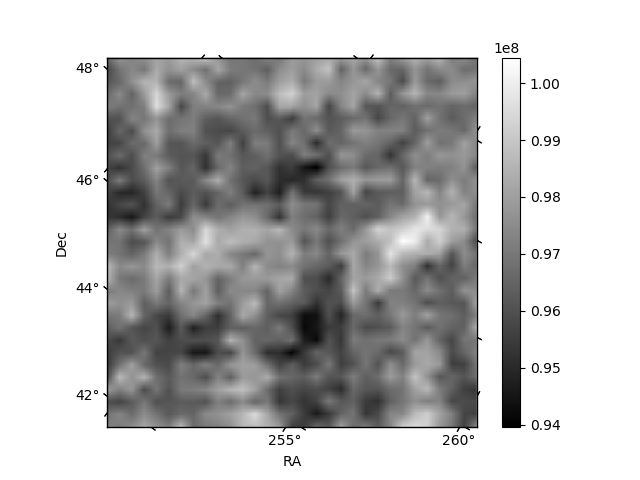
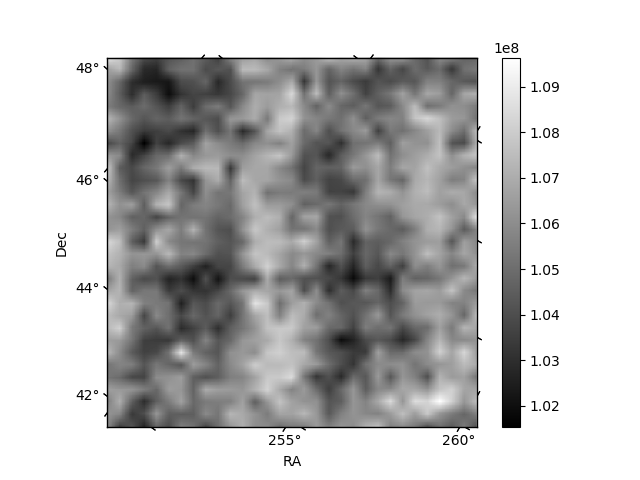
Histogram calculated using DETX and DETY for each event in the final _common_clean file
| Quadrant A | 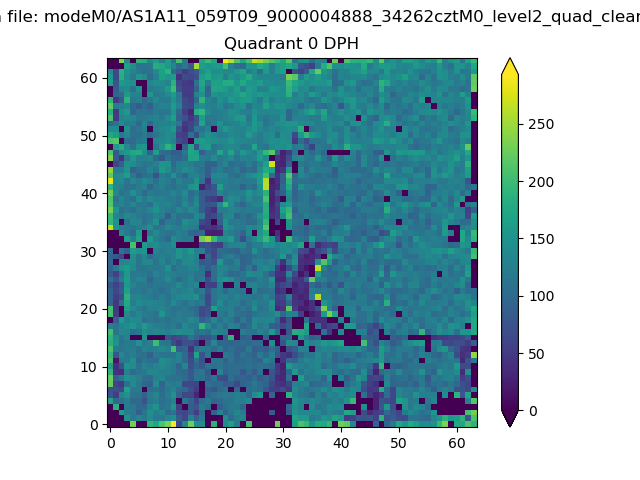 |
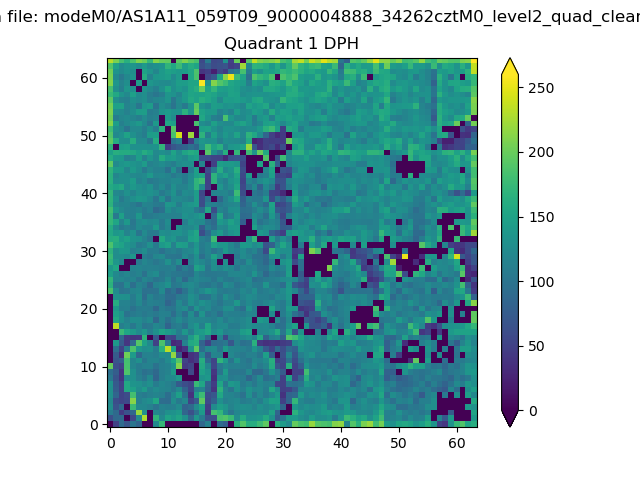 |
Quadrant B |
|---|---|---|---|
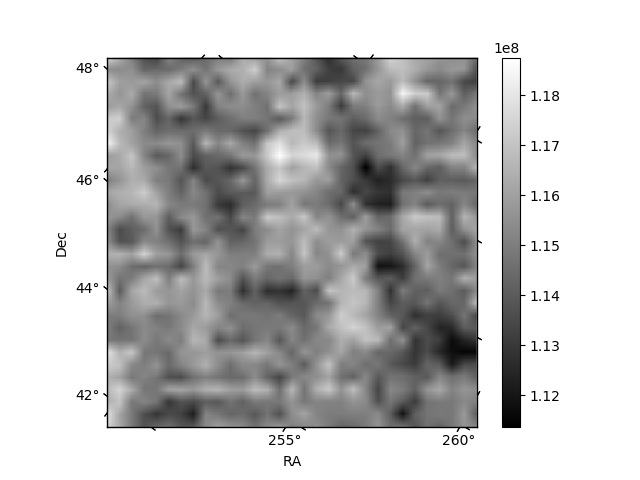
| Quadrant D | 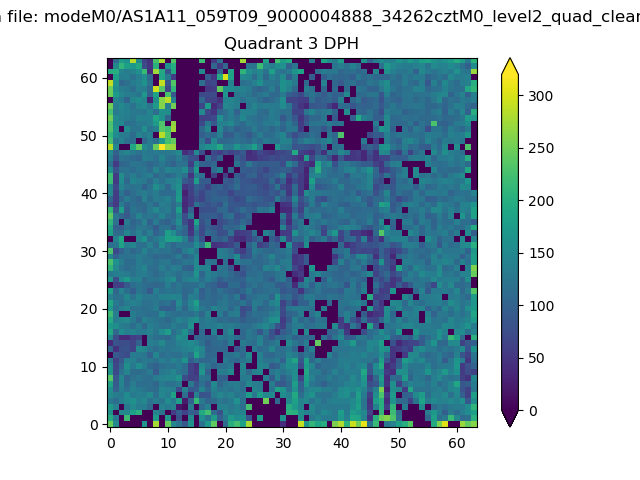 |
 |
Quadrant C |
| Plot type | Count rate plots | Images |
|---|---|---|
| Comparison with Poisson distribution Blue bars denote a histogram of data divided into 1 sec bins. Red curve is a Poisson curve with rate = median count rate of data. |
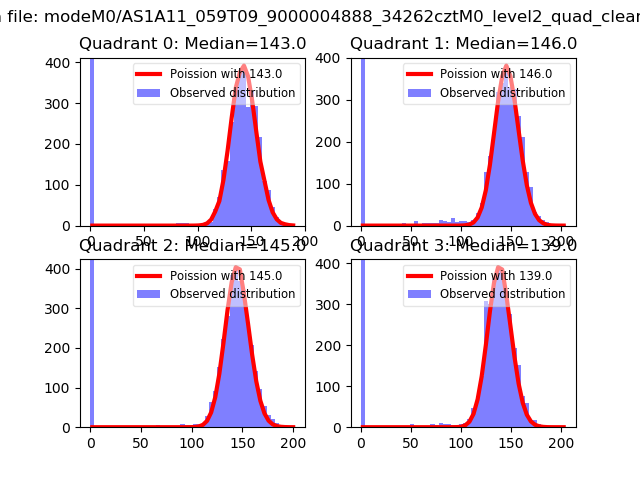 |
 |
| Quadrant-wise count rates Data is divided into 100 sec bins |
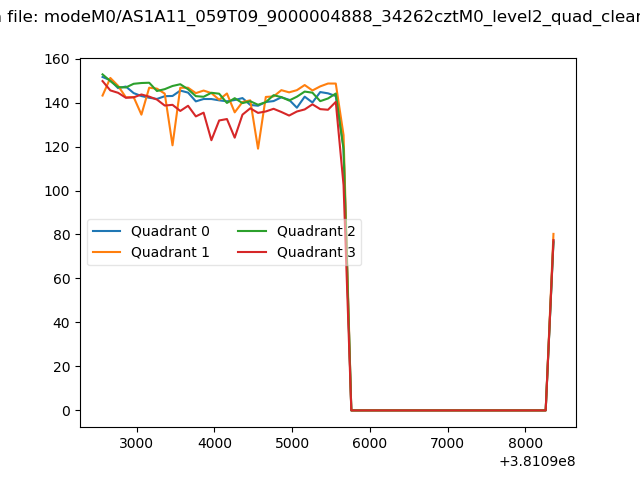 |
|
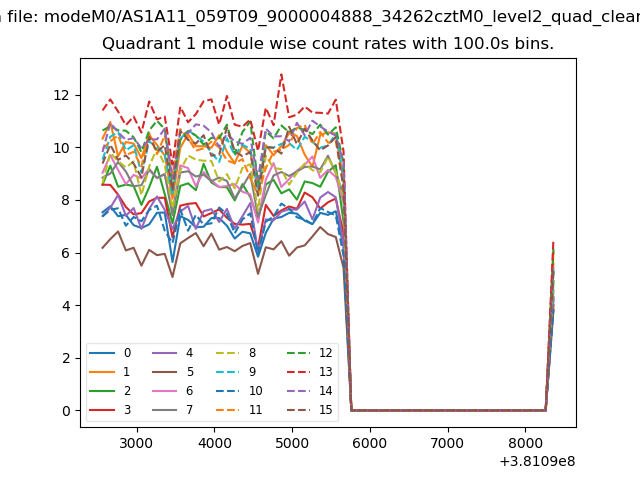
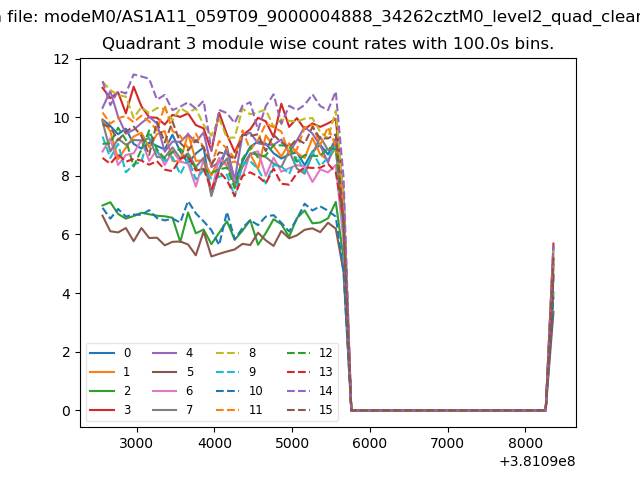
| Module-wise count rates for Quadrant A Data is divided into 100 sec bins |
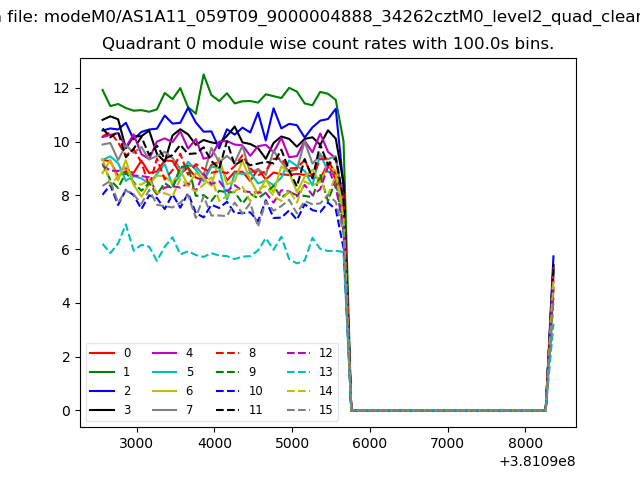 |
 |
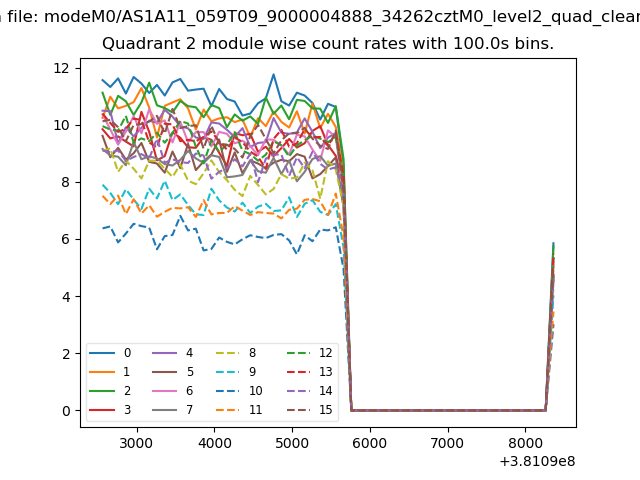
| Module-wise count rates for Quadrant B Data is divided into 100 sec bins |
 |
 |
| Module-wise count rates for Quadrant C Data is divided into 100 sec bins |
 |
 |
| Module-wise count rates for Quadrant D Data is divided into 100 sec bins |
 |
 |
| Parameter | Plot |
|---|---|
| CZT HV Monitor | 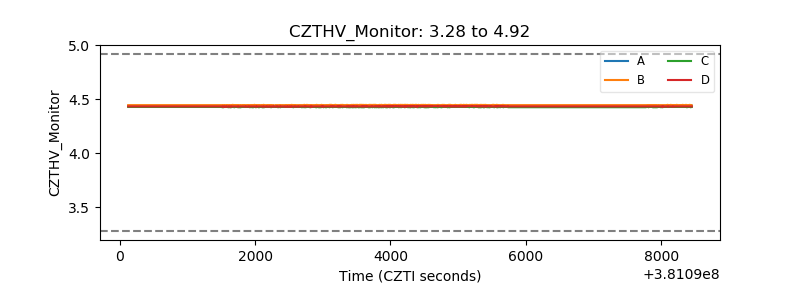 |
| D_VDD | 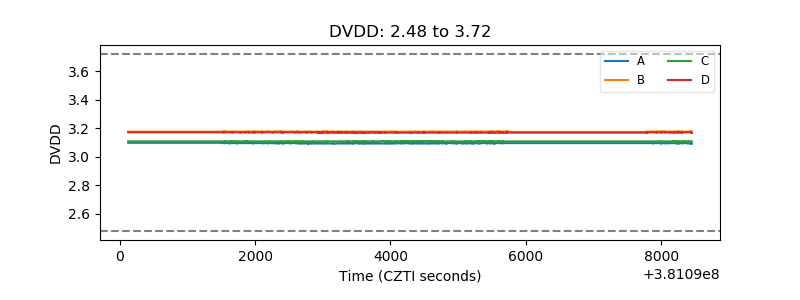 |
| Temperature 1 | 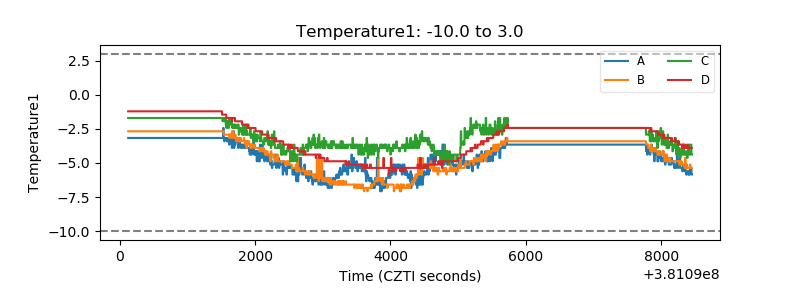 |
| Veto HV Monitor | 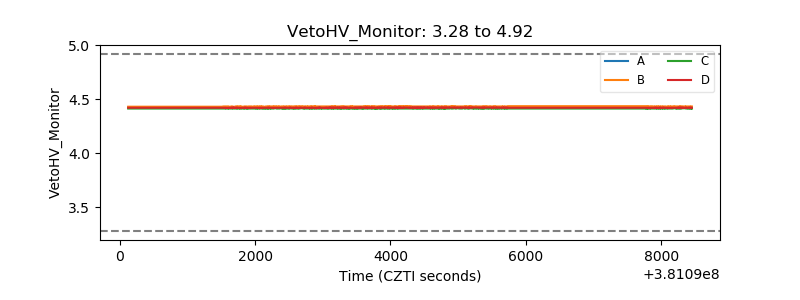 |
| Veto LLD | 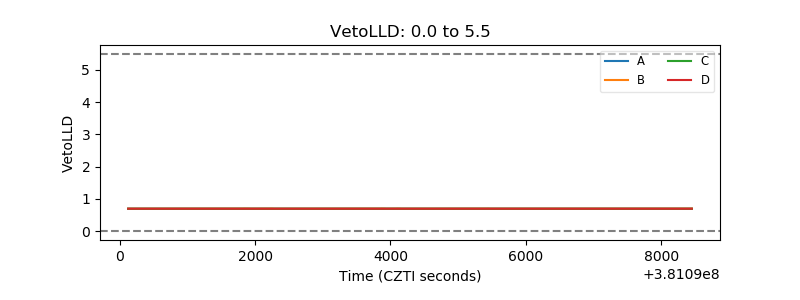 |
| Alpha Counter | 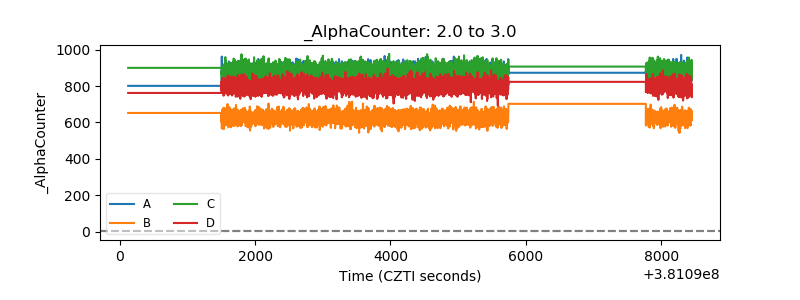 |
| _CPM_Rate | 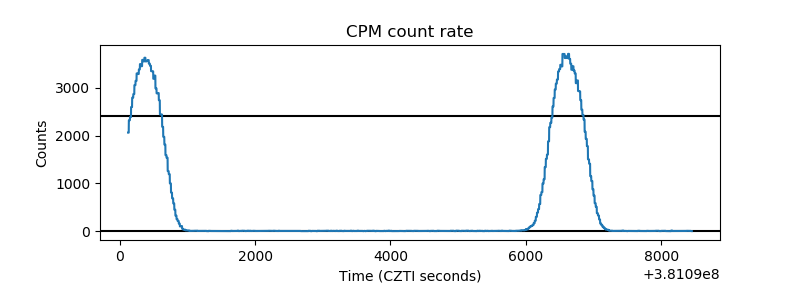 |
| CZT Counter | 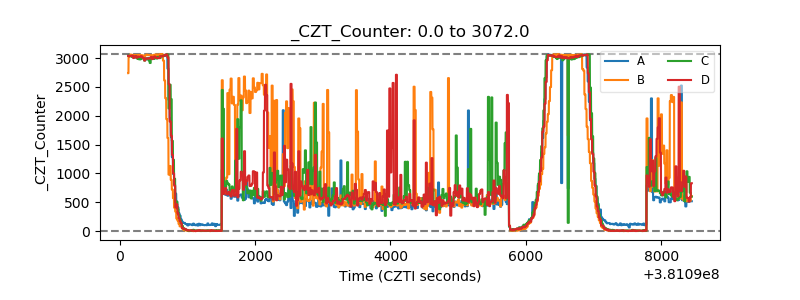 |
| +2.5 Volts monitor | 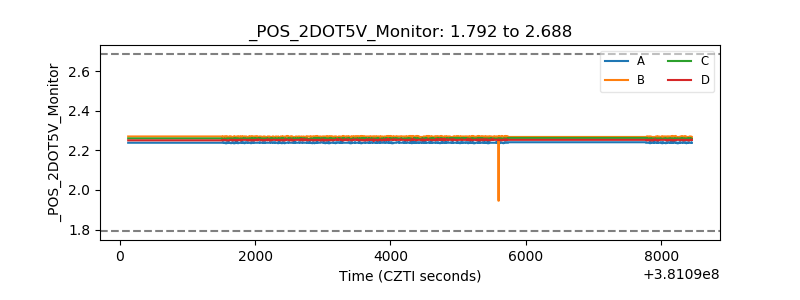 |
| +5 Volts monitor | 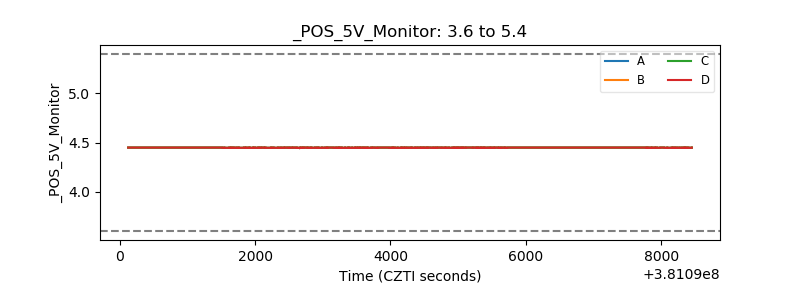 |
| _ROLL_ROT | 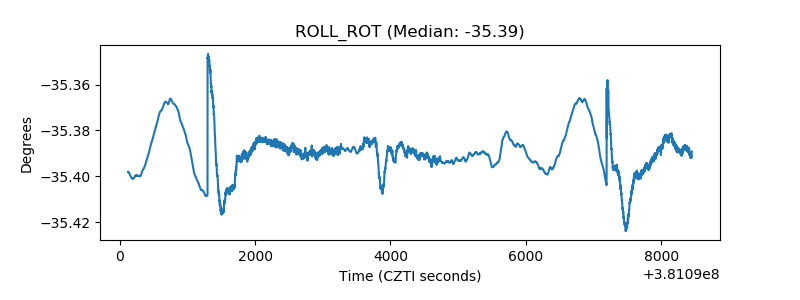 |
| _Roll_DEC | 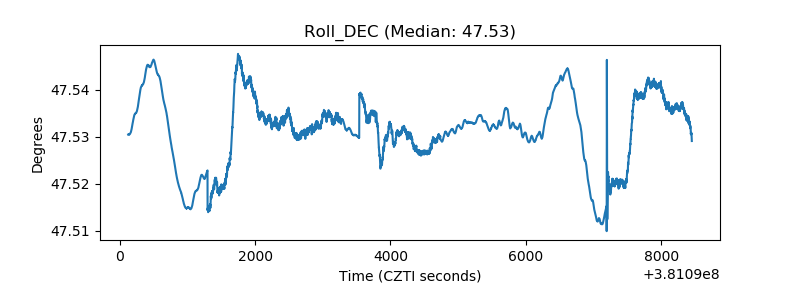 |
| _Roll_RA | 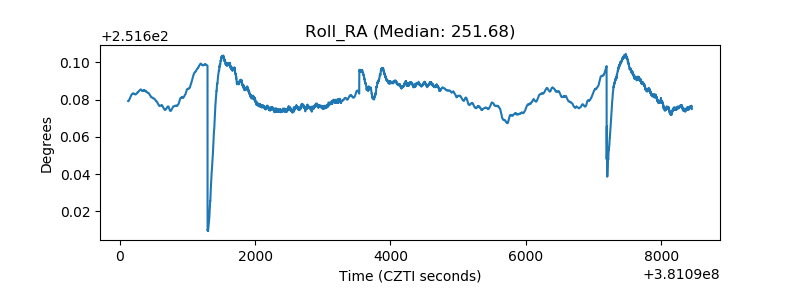 |
| Veto Counter | 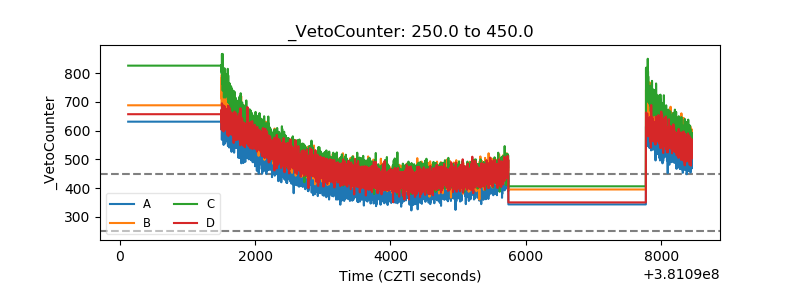 |