| Param | Original file | Final file |
|---|---|---|
| Filename | modeM0/AS1A11_059T09_9000004888_34261cztM0_level2.evt | modeM0/AS1A11_059T09_9000004888_34261cztM0_level2_quad_clean.evt |
| Size (bytes) | 527,627,520 | 62,772,480 |
| Size | 503.2 MB | 59.9 MB |
| Events in quadrant A | 2,651,125 | 393,109 |
| Events in quadrant B | 4,813,886 | 389,452 |
| Events in quadrant C | 3,741,615 | 396,070 |
| Events in quadrant D | 4,425,789 | 363,010 |
| Mode M0 | |||
|---|---|---|---|
| Quadrant | BADHDUFLAG | Total packets | Discarded packets |
| A | 0 | 11140 | 0 |
| B | 0 | 17619 | 0 |
| C | 0 | 14457 | 0 |
| D | 0 | 16607 | 0 |
| Mode SS | |||
|---|---|---|---|
| Quadrant | BADHDUFLAG | Total packets | Discarded packets |
| A | 0 | 104 | 0 |
| B | 0 | 104 | 0 |
| C | 0 | 104 | 0 |
| D | 0 | 104 | 0 |
| Mode M9 | |||
|---|---|---|---|
| Quadrant | BADHDUFLAG | Total packets | Discarded packets |
| A | 0 | 20 | 0 |
| B | 0 | 20 | 0 |
| C | 0 | 20 | 0 |
| D | 0 | 21 | 0 |
| Quadrant | Total seconds | Saturated seconds | Saturation percentage |
|---|---|---|---|
| A | 5120 | 11 | 0.214844% |
| B | 5120 | 956 | 18.671875% |
| C | 5120 | 265 | 5.175781% |
| D | 5120 | 324 | 6.328125% |
Noise dominated data is calculated using 1-second bins in cleaned event files. If a bin has >2000 counts, and if more than 50% of those come from <1% of pixels, then it is considered to be noise-dominated and hence unusable.
| Quadrant | # 1 sec bins | Bins with >0 counts | Bins with >2000 counts | High rate bins dominated by noise | Noise dominated (total time) | Noise dominated (detector-on time) | Marked lightcurve |
|---|---|---|---|---|---|---|---|
| A | 7033 | 5121 | 4 | 4 | 0.06% | 0.08% | 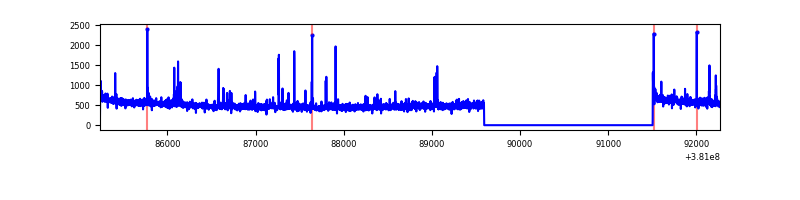 |
| B | 7033 | 5121 | 782 | 782 | 11.12% | 15.27% | 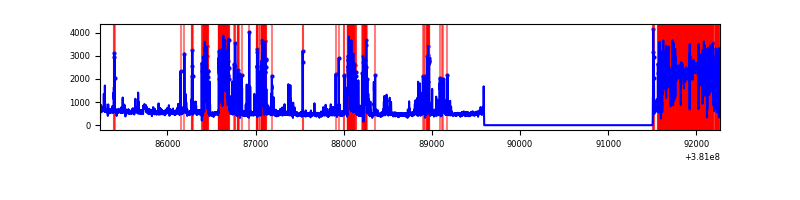 |
| C | 7033 | 5121 | 205 | 205 | 2.91% | 4.00% | 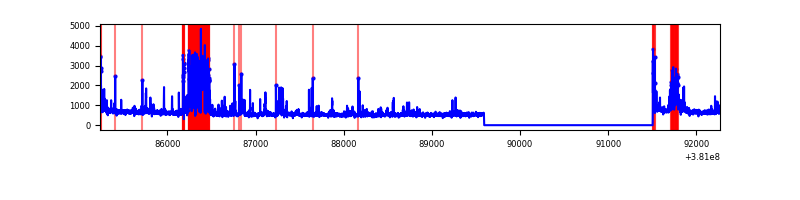 |
| D | 7033 | 5121 | 262 | 262 | 3.73% | 5.12% | 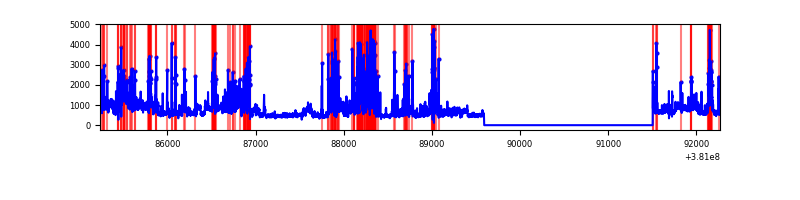 |
Top three noisy pixels from each quadrant. If the there are fewer than three noisy pixels in the level2.evt file, extra rows are filled as -1
| Pixel properties | Quadrant properties | ||||||
|---|---|---|---|---|---|---|---|
| Quadrant | DetID | PixID | Counts | Sigma | Mean | Median | Sigma |
| A | 7 | 16 | 37229 | 281.5 | 649 | 638 | 130.0 |
| A | 9 | 143 | 34748 | 262.41 | 649 | 638 | 130.0 |
| A | 15 | 169 | 31868 | 240.26 | 649 | 638 | 130.0 |
| B | 5 | 172 | 2392214 | 22376.63 | 572 | 559 | 106.9 |
| B | 0 | 189 | 46760 | 432.26 | 572 | 559 | 106.9 |
| B | 0 | 229 | 36404 | 335.37 | 572 | 559 | 106.9 |
| C | 0 | 207 | 617233 | 4303.74 | 628 | 636 | 143.3 |
| C | 15 | 214 | 221226 | 1539.68 | 628 | 636 | 143.3 |
| C | 0 | 239 | 141563 | 983.65 | 628 | 636 | 143.3 |
| D | 8 | 195 | 691145 | 4500.85 | 623 | 606 | 153.4 |
| D | 7 | 80 | 507585 | 3304.43 | 623 | 606 | 153.4 |
| D | 10 | 199 | 273928 | 1781.48 | 623 | 606 | 153.4 |
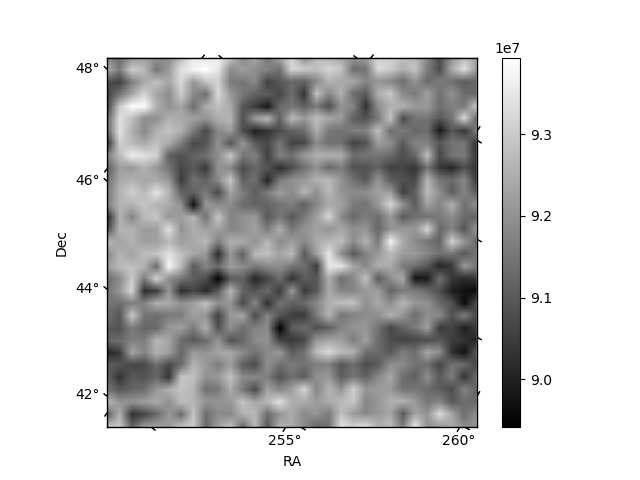
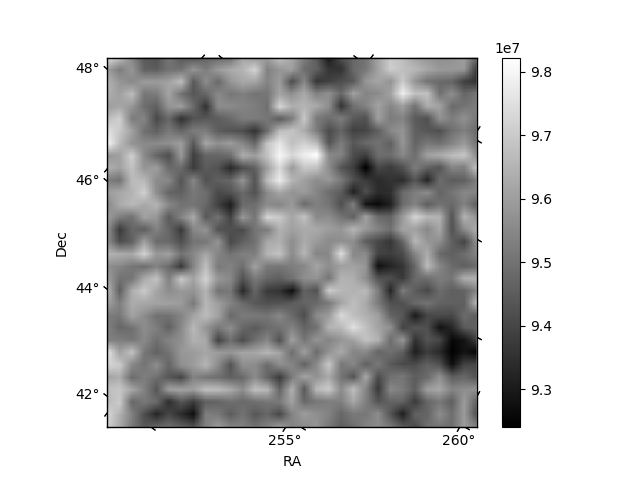
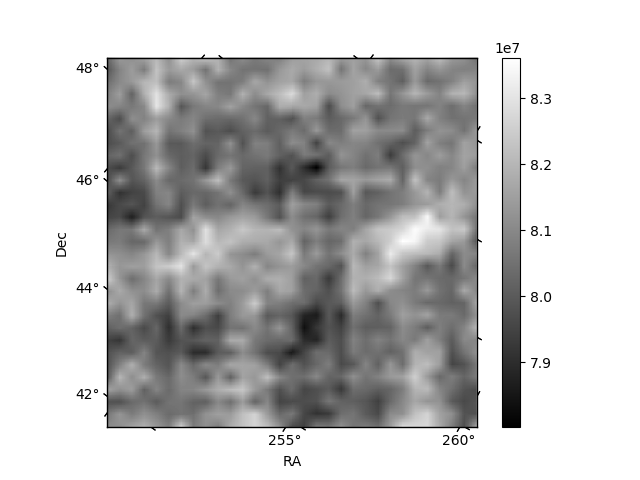
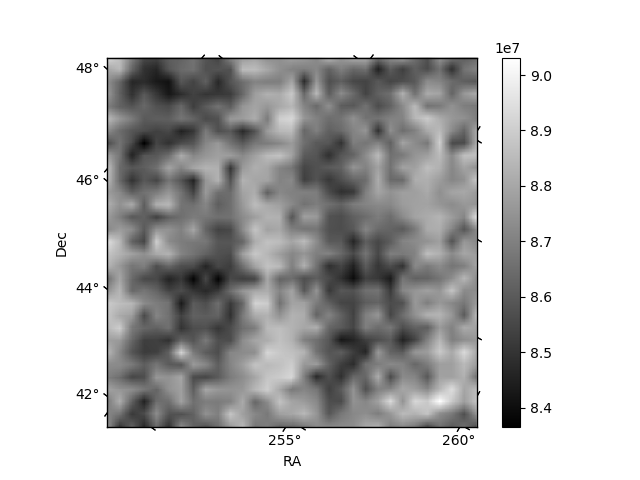
Histogram calculated using DETX and DETY for each event in the final _common_clean file
| Quadrant A | 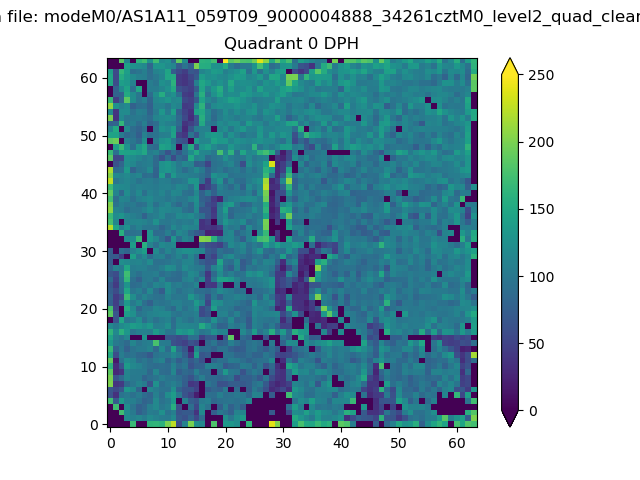 |
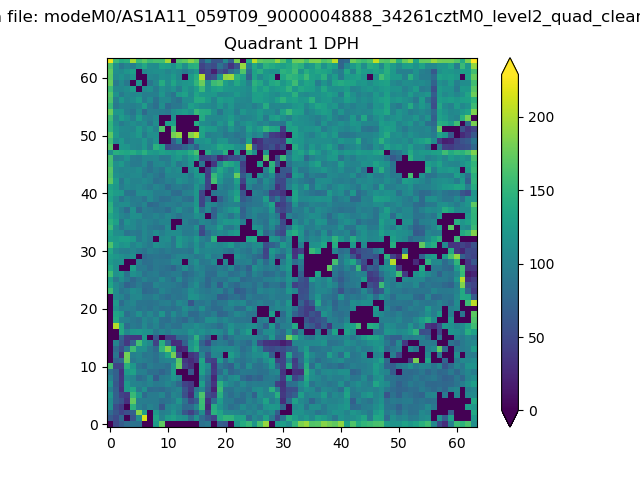 |
Quadrant B |
|---|---|---|---|
| Quadrant D | 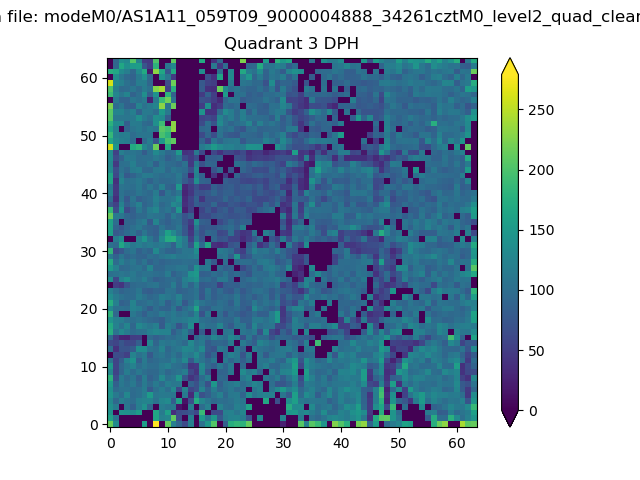 |
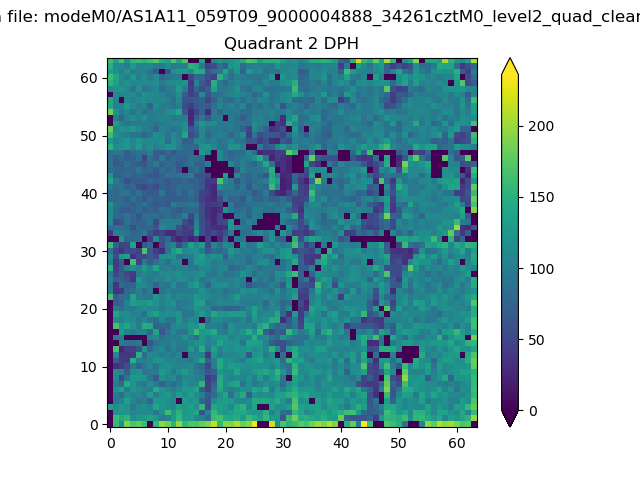 |
Quadrant C |
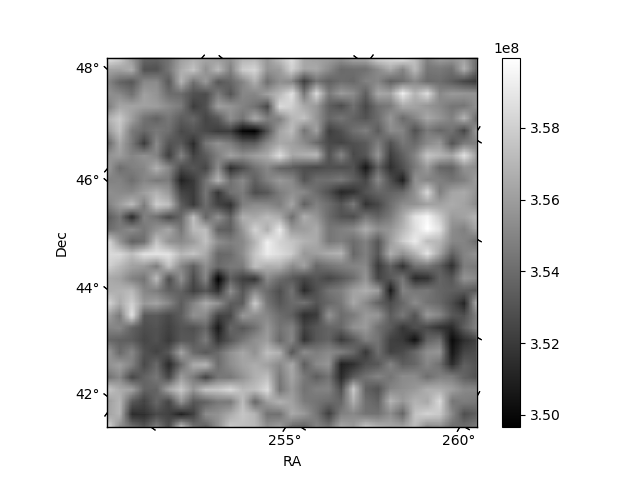
| Plot type | Count rate plots | Images |
|---|---|---|
| Comparison with Poisson distribution Blue bars denote a histogram of data divided into 1 sec bins. Red curve is a Poisson curve with rate = median count rate of data. |
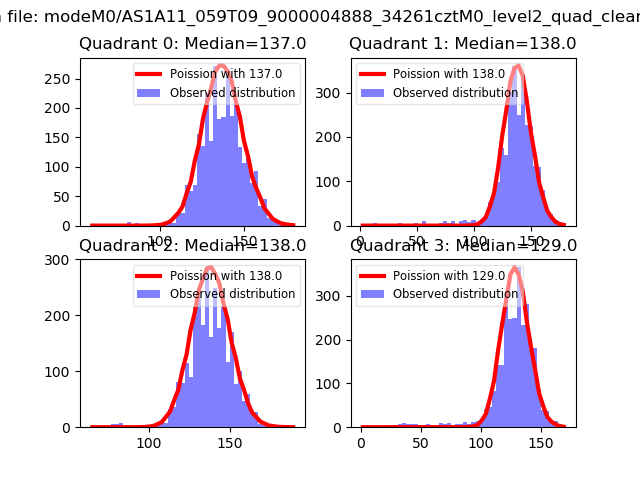 |
 |
| Quadrant-wise count rates Data is divided into 100 sec bins |
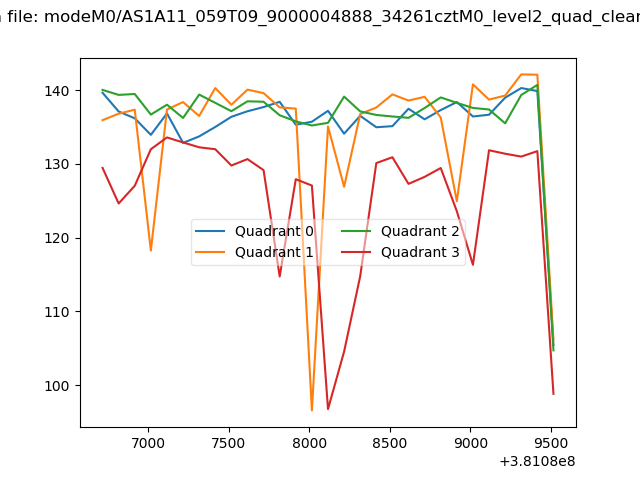 |
|
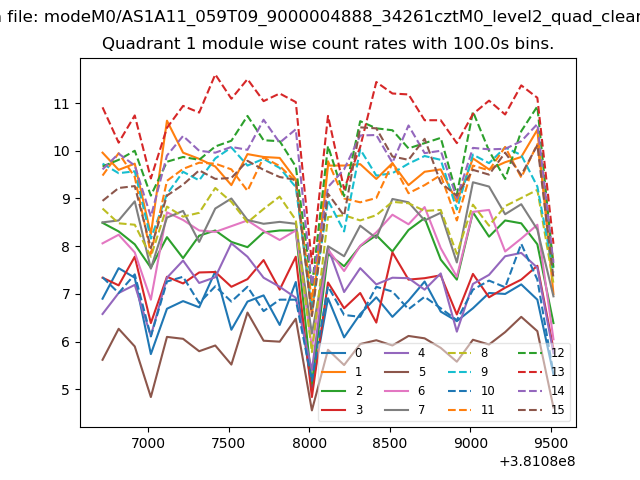
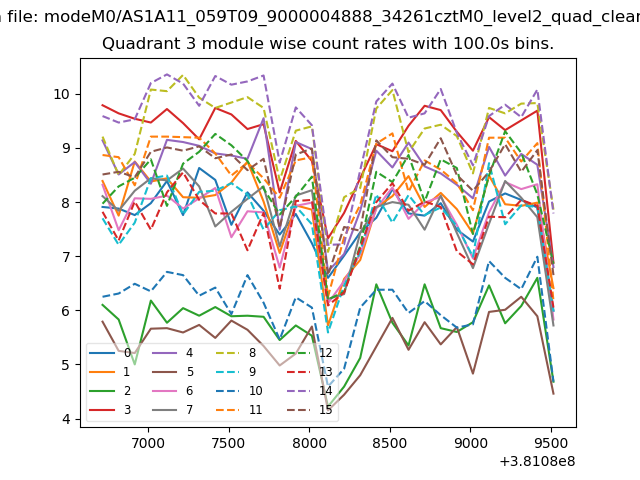
| Module-wise count rates for Quadrant A Data is divided into 100 sec bins |
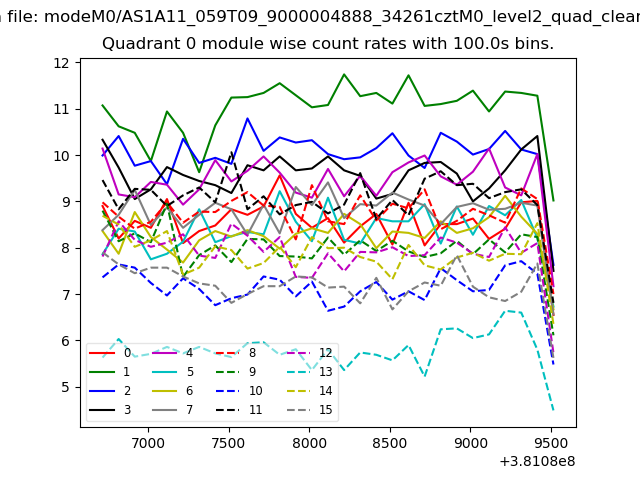 |
 |
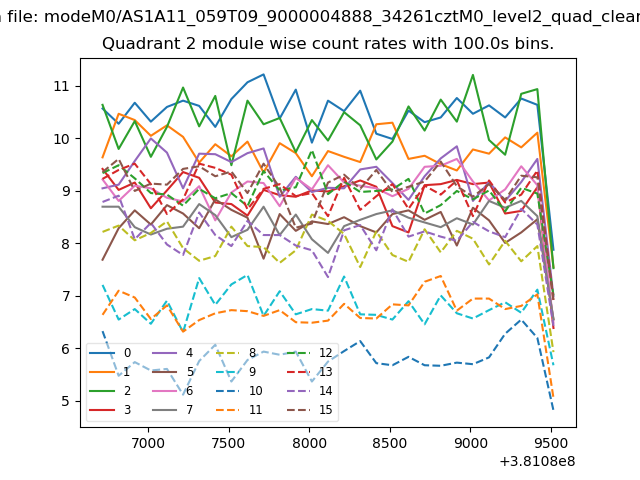
| Module-wise count rates for Quadrant B Data is divided into 100 sec bins |
 |
 |
| Module-wise count rates for Quadrant C Data is divided into 100 sec bins |
 |
 |
| Module-wise count rates for Quadrant D Data is divided into 100 sec bins |
 |
 |
| Parameter | Plot |
|---|---|
| CZT HV Monitor | 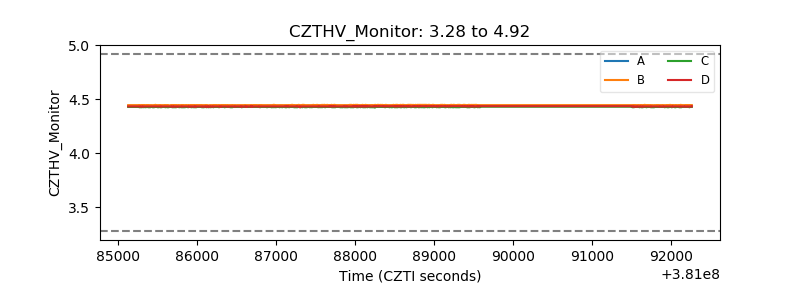 |
| D_VDD | 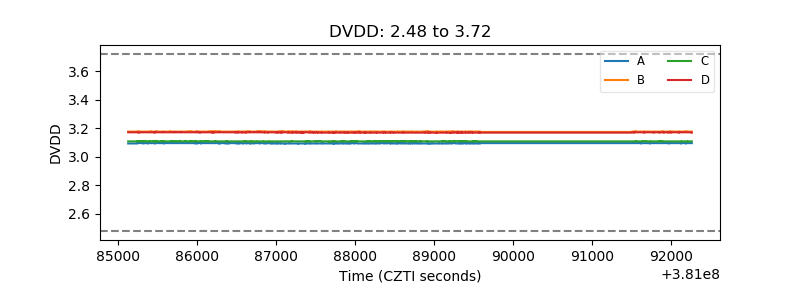 |
| Temperature 1 | 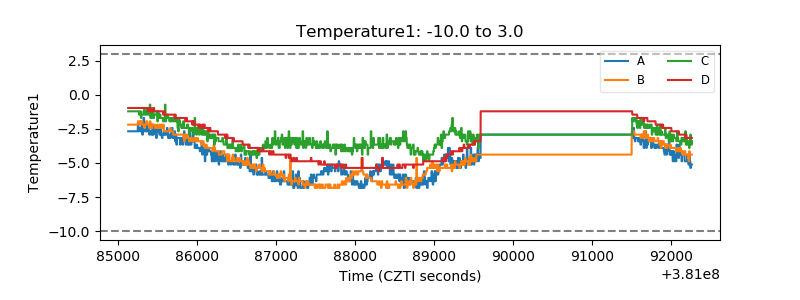 |
| Veto HV Monitor | 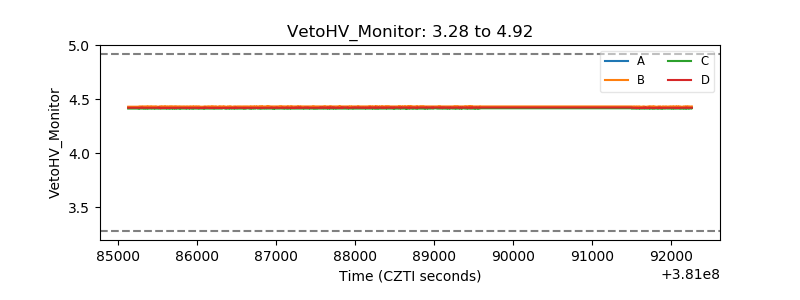 |
| Veto LLD | 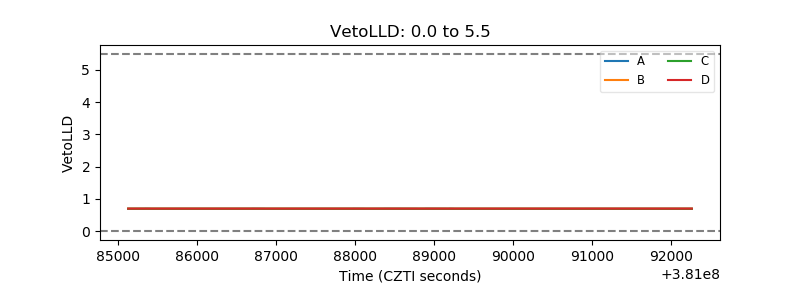 |
| Alpha Counter | 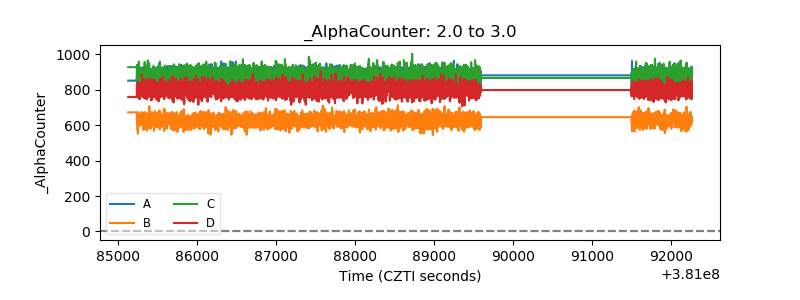 |
| _CPM_Rate | 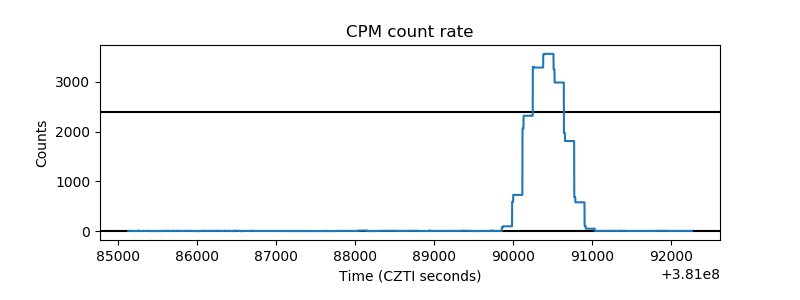 |
| CZT Counter | 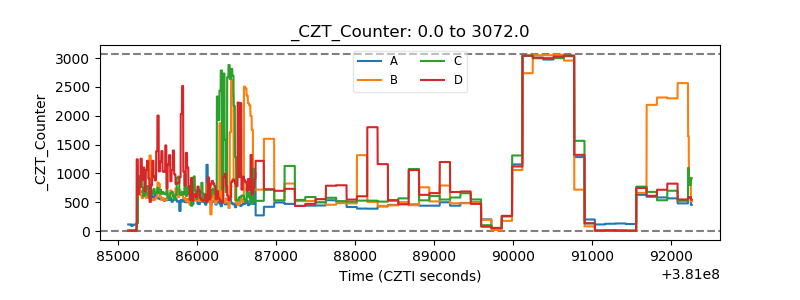 |
| +2.5 Volts monitor | 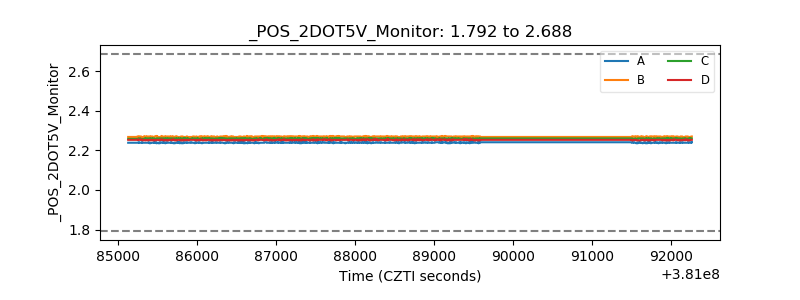 |
| +5 Volts monitor | 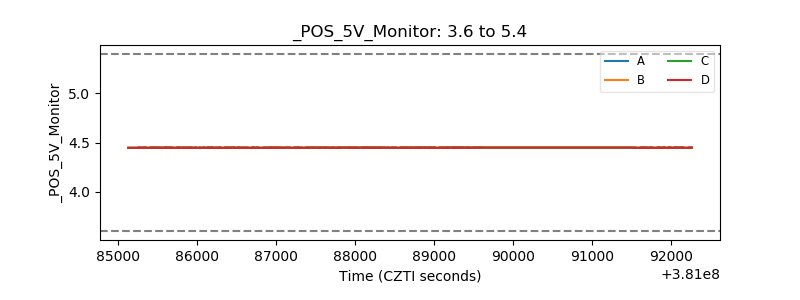 |
| _ROLL_ROT | 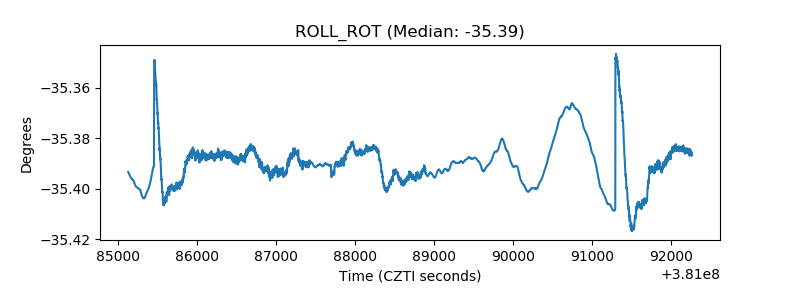 |
| _Roll_DEC | 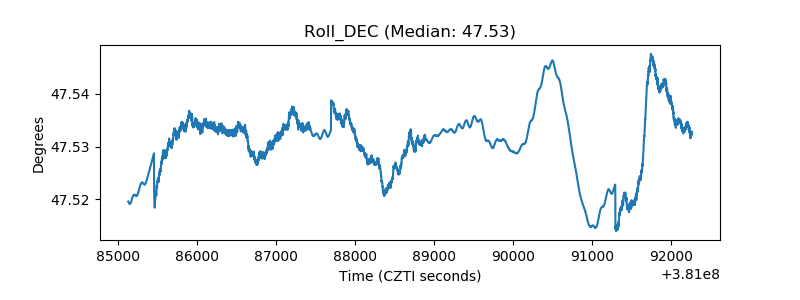 |
| _Roll_RA | 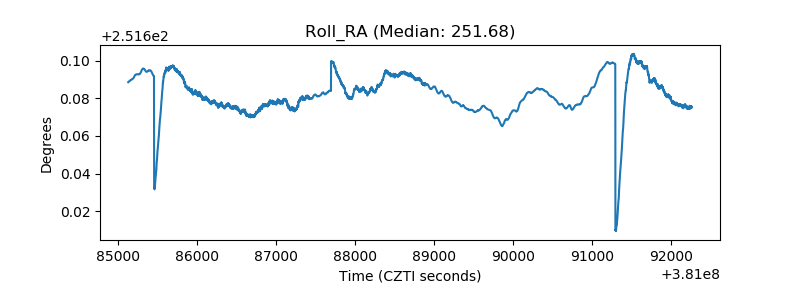 |
| Veto Counter | 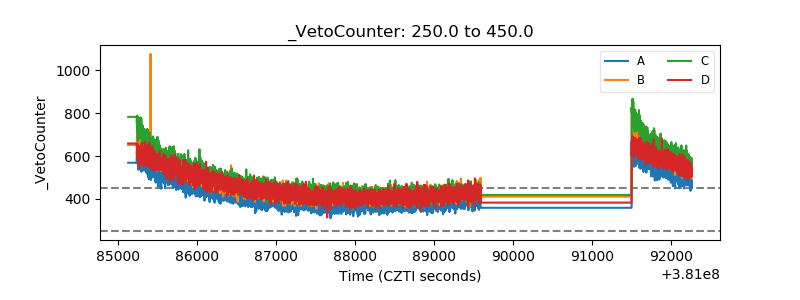 |