| Param | Original file | Final file |
|---|---|---|
| Filename | modeM0/AS1A11_059T09_9000004888_34260cztM0_level2.evt | modeM0/AS1A11_059T09_9000004888_34260cztM0_level2_quad_clean.evt |
| Size (bytes) | 482,224,320 | 56,350,080 |
| Size | 459.9 MB | 53.7 MB |
| Events in quadrant A | 2,751,710 | 334,931 |
| Events in quadrant B | 3,604,792 | 334,952 |
| Events in quadrant C | 3,488,906 | 332,051 |
| Events in quadrant D | 4,382,024 | 315,352 |
| Mode M0 | |||
|---|---|---|---|
| Quadrant | BADHDUFLAG | Total packets | Discarded packets |
| A | 0 | 11755 | 0 |
| B | 0 | 14299 | 0 |
| C | 0 | 13907 | 0 |
| D | 0 | 16748 | 0 |
| Mode SS | |||
|---|---|---|---|
| Quadrant | BADHDUFLAG | Total packets | Discarded packets |
| A | 0 | 112 | 0 |
| B | 0 | 112 | 0 |
| C | 0 | 112 | 0 |
| D | 0 | 112 | 0 |
| Mode M9 | |||
|---|---|---|---|
| Quadrant | BADHDUFLAG | Total packets | Discarded packets |
| A | 0 | 22 | 0 |
| B | 0 | 22 | 0 |
| C | 0 | 22 | 0 |
| D | 0 | 23 | 0 |
| Quadrant | Total seconds | Saturated seconds | Saturation percentage |
|---|---|---|---|
| A | 5559 | 4 | 0.071955% |
| B | 5559 | 252 | 4.533189% |
| C | 5559 | 108 | 1.942795% |
| D | 5559 | 189 | 3.399892% |
Noise dominated data is calculated using 1-second bins in cleaned event files. If a bin has >2000 counts, and if more than 50% of those come from <1% of pixels, then it is considered to be noise-dominated and hence unusable.
| Quadrant | # 1 sec bins | Bins with >0 counts | Bins with >2000 counts | High rate bins dominated by noise | Noise dominated (total time) | Noise dominated (detector-on time) | Marked lightcurve |
|---|---|---|---|---|---|---|---|
| A | 7352 | 5560 | 1 | 1 | 0.01% | 0.02% | 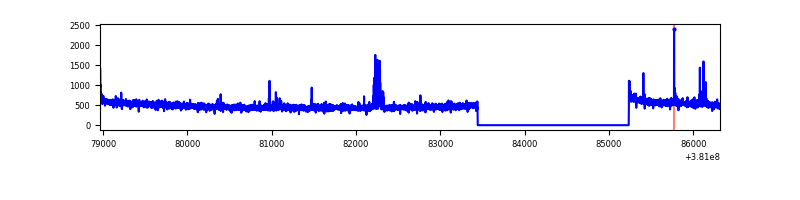 |
| B | 7352 | 5560 | 170 | 170 | 2.31% | 3.06% | 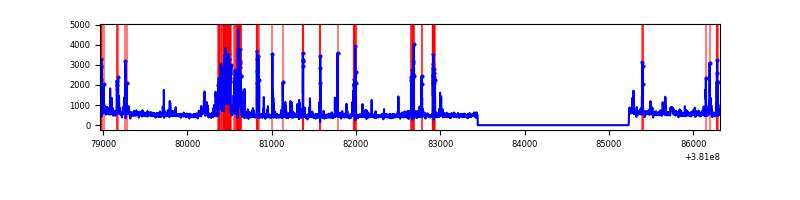 |
| C | 7352 | 5560 | 78 | 78 | 1.06% | 1.40% | 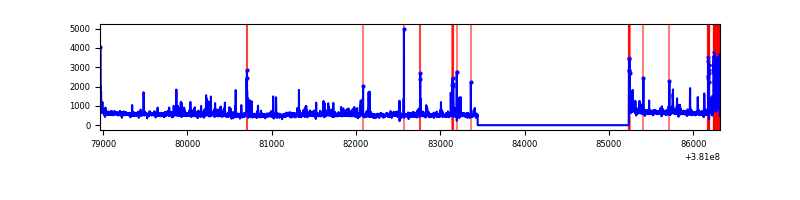 |
| D | 7352 | 5560 | 143 | 143 | 1.95% | 2.57% |  |
Top three noisy pixels from each quadrant. If the there are fewer than three noisy pixels in the level2.evt file, extra rows are filled as -1
| Pixel properties | Quadrant properties | ||||||
|---|---|---|---|---|---|---|---|
| Quadrant | DetID | PixID | Counts | Sigma | Mean | Median | Sigma |
| A | 7 | 16 | 37587 | 269.64 | 684 | 671 | 136.9 |
| A | 15 | 169 | 28512 | 203.35 | 684 | 671 | 136.9 |
| A | 10 | 83 | 26500 | 188.66 | 684 | 671 | 136.9 |
| B | 5 | 172 | 447274 | 3540.85 | 671 | 654 | 126.1 |
| B | 0 | 229 | 393074 | 3111.15 | 671 | 654 | 126.1 |
| B | 0 | 189 | 41646 | 324.99 | 671 | 654 | 126.1 |
| C | 0 | 207 | 354282 | 2306.92 | 664 | 672 | 153.3 |
| C | 15 | 214 | 241961 | 1574.15 | 664 | 672 | 153.3 |
| C | 1 | 128 | 84429 | 546.42 | 664 | 672 | 153.3 |
| D | 8 | 195 | 834362 | 5121.42 | 663 | 645 | 162.8 |
| D | 7 | 80 | 402343 | 2467.58 | 663 | 645 | 162.8 |
| D | 13 | 249 | 149021 | 911.46 | 663 | 645 | 162.8 |
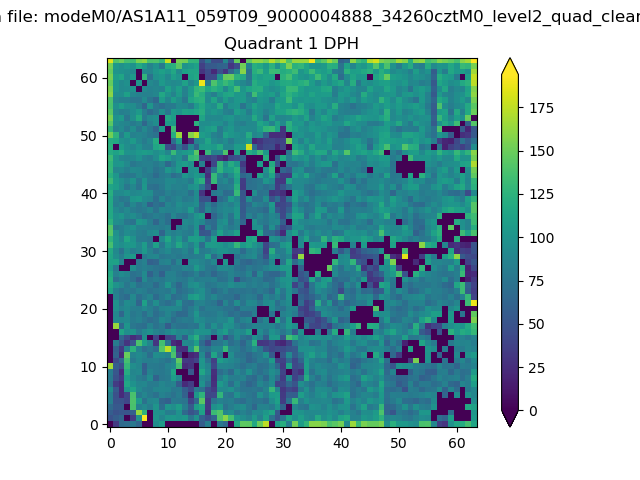
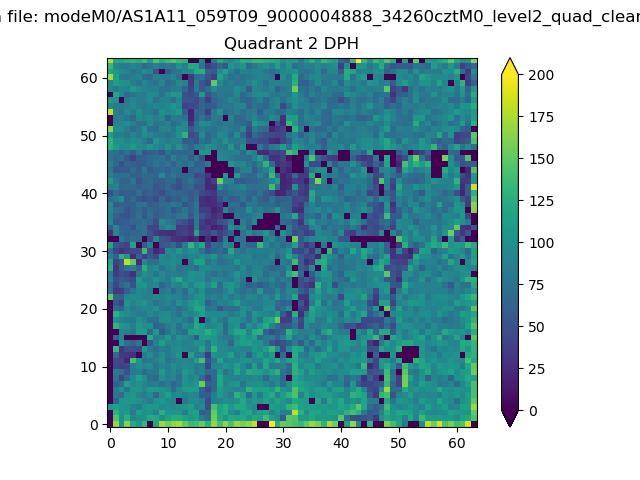
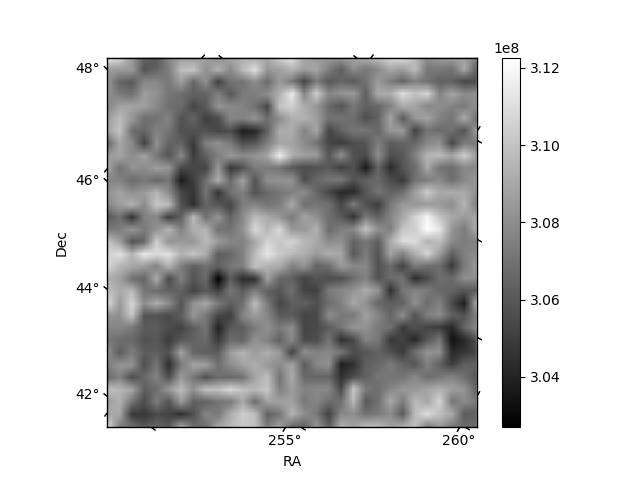
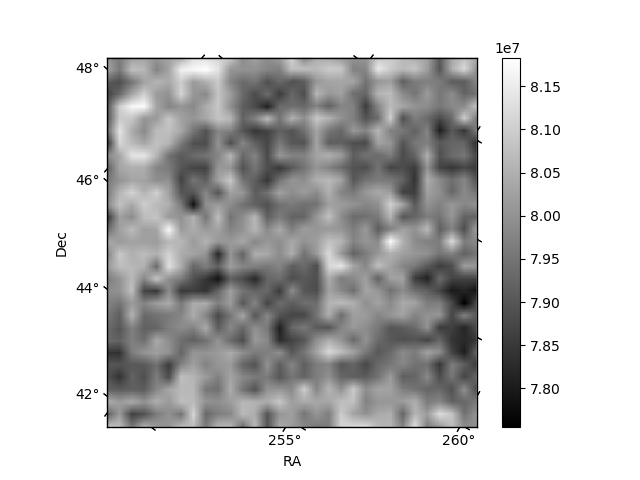
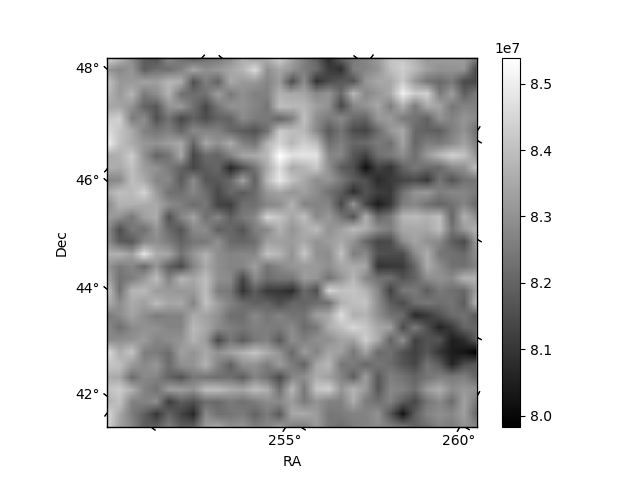
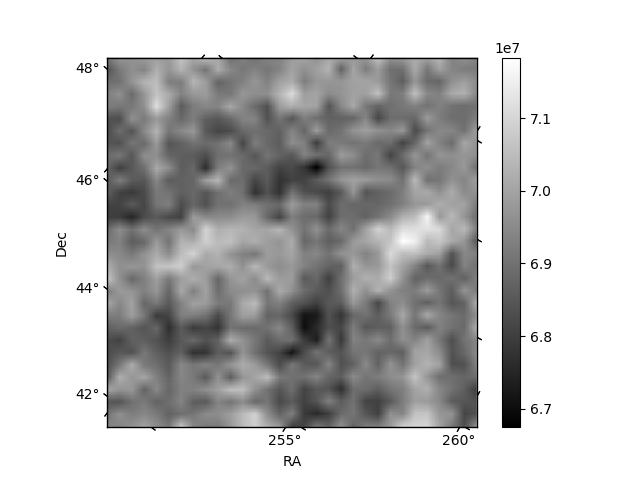
Histogram calculated using DETX and DETY for each event in the final _common_clean file
| Quadrant A | 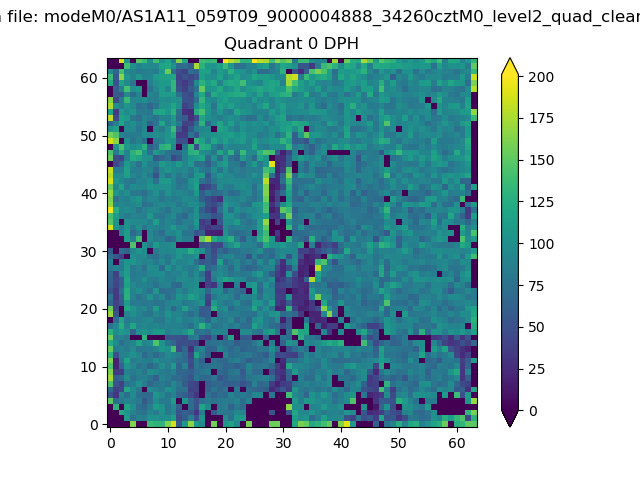 |
 |
Quadrant B |
|---|---|---|---|
| Quadrant D | 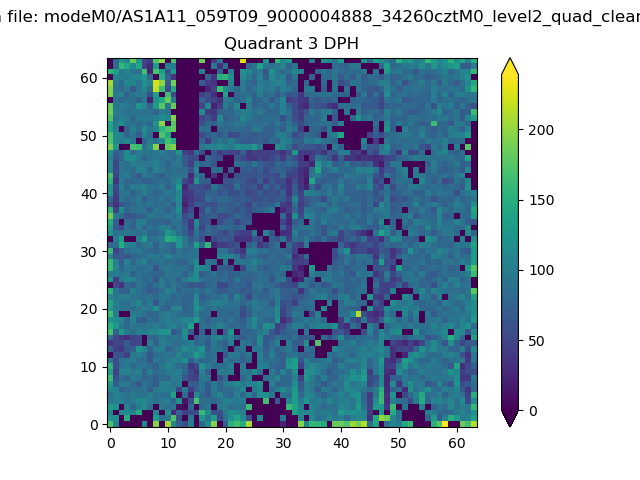 |
 |
Quadrant C |
| Plot type | Count rate plots | Images |
|---|---|---|
| Comparison with Poisson distribution Blue bars denote a histogram of data divided into 1 sec bins. Red curve is a Poisson curve with rate = median count rate of data. |
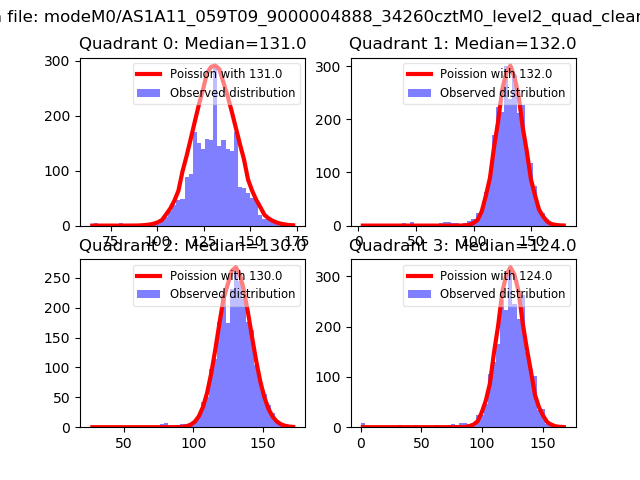 |
 |
| Quadrant-wise count rates Data is divided into 100 sec bins |
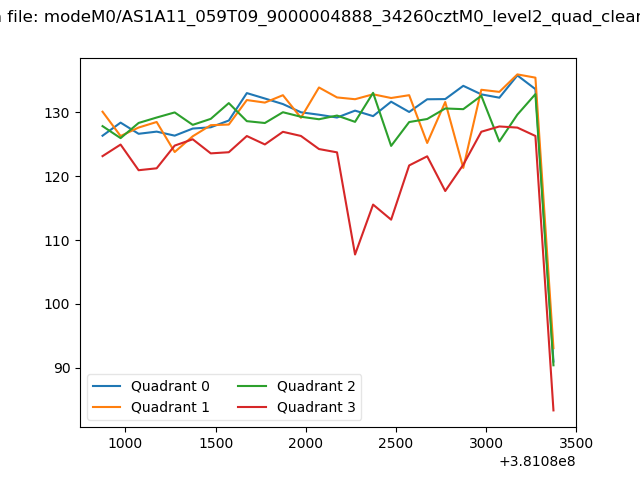 |
|
| Module-wise count rates for Quadrant A Data is divided into 100 sec bins |
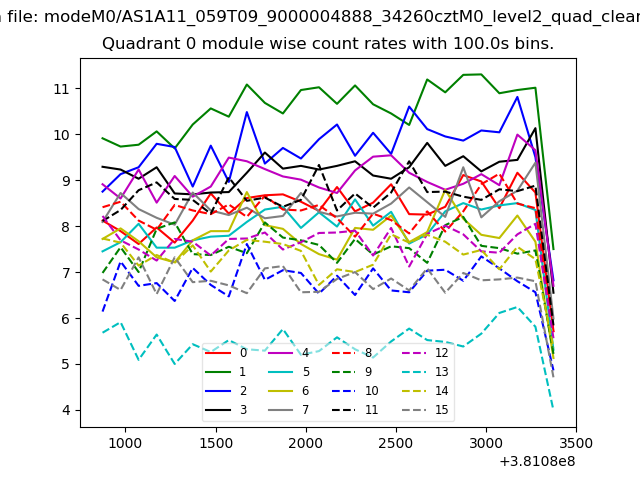 |
 |
| Module-wise count rates for Quadrant B Data is divided into 100 sec bins |
 |
 |
| Module-wise count rates for Quadrant C Data is divided into 100 sec bins |
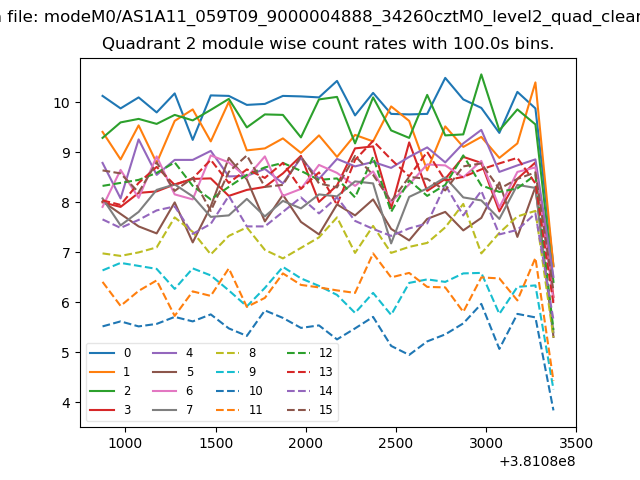 |
 |
| Module-wise count rates for Quadrant D Data is divided into 100 sec bins |
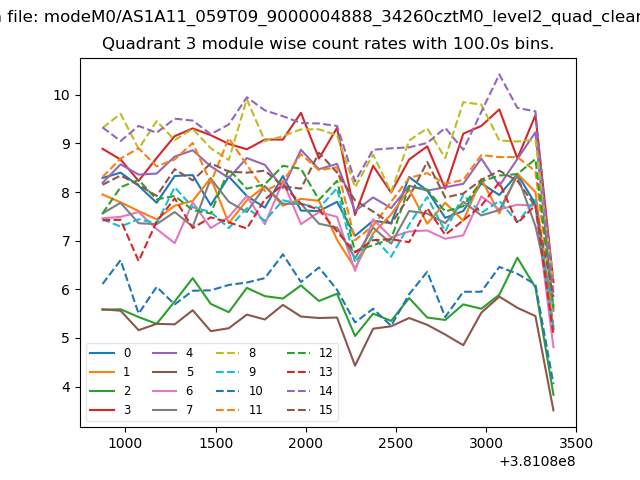 |
 |
| Parameter | Plot |
|---|---|
| CZT HV Monitor | 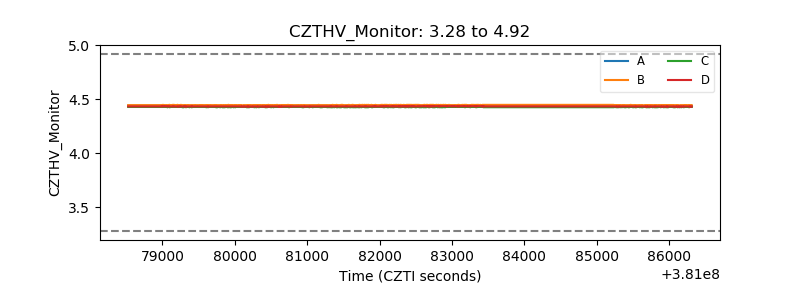 |
| D_VDD | 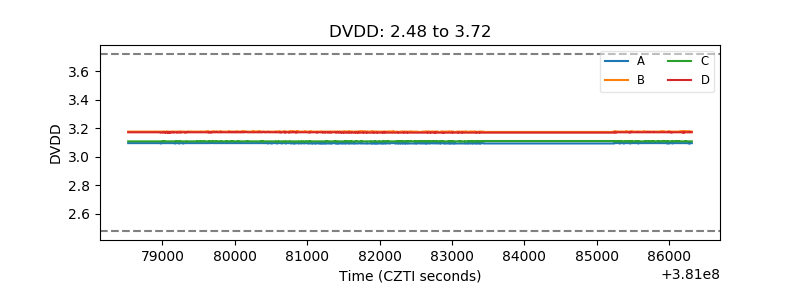 |
| Temperature 1 | 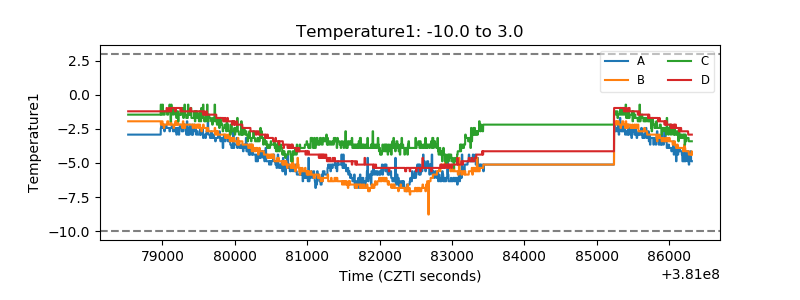 |
| Veto HV Monitor | 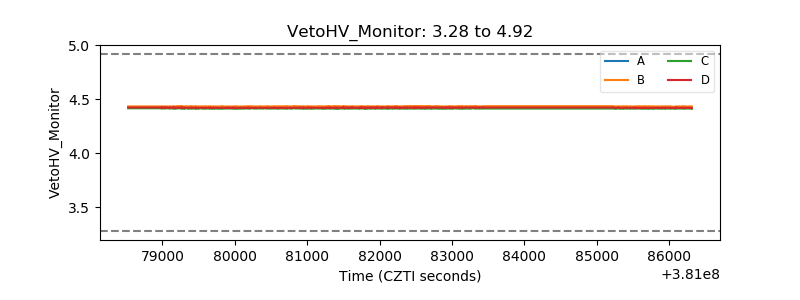 |
| Veto LLD | 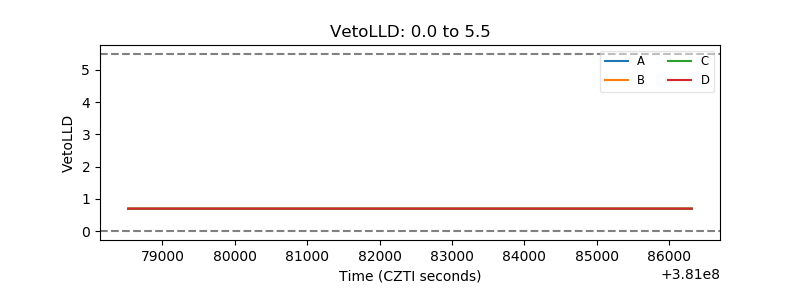 |
| Alpha Counter | 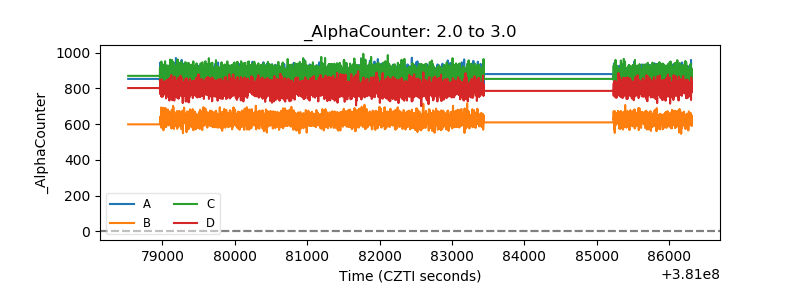 |
| _CPM_Rate | 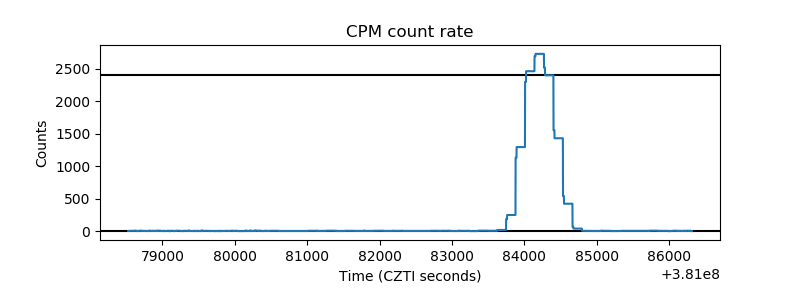 |
| CZT Counter |  |
| +2.5 Volts monitor | 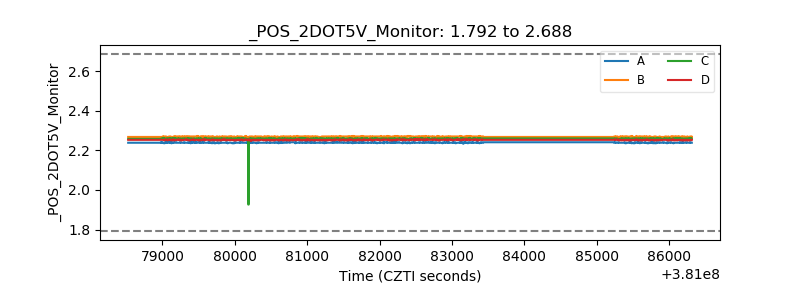 |
| +5 Volts monitor | 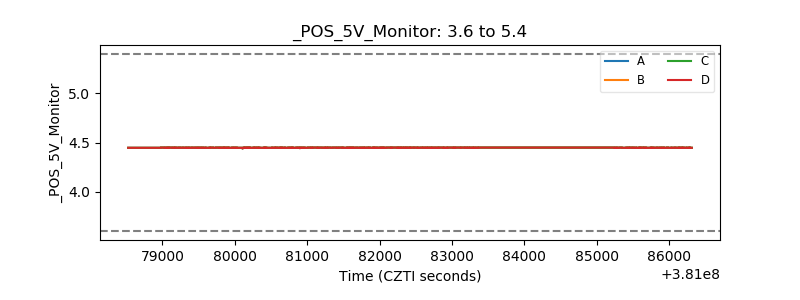 |
| _ROLL_ROT | 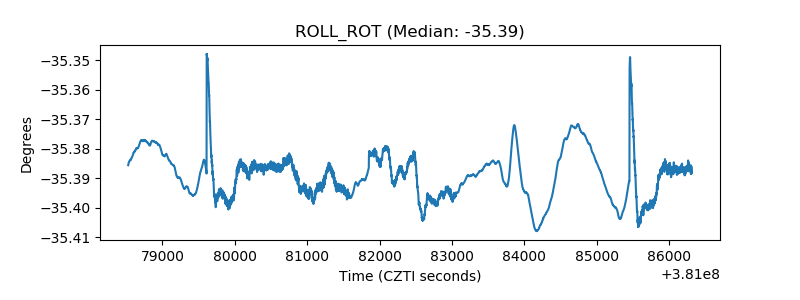 |
| _Roll_DEC | 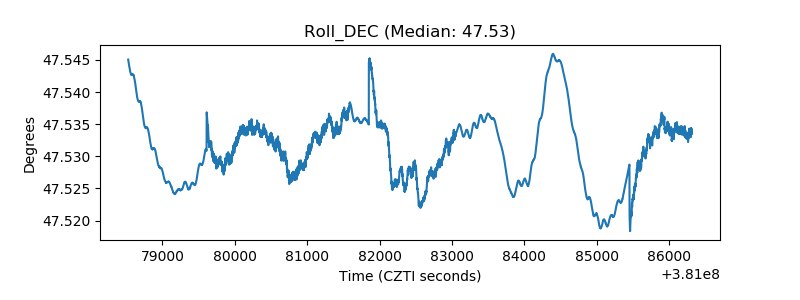 |
| _Roll_RA | 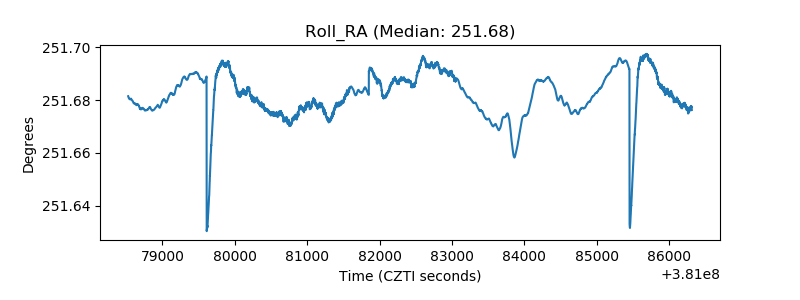 |
| Veto Counter | 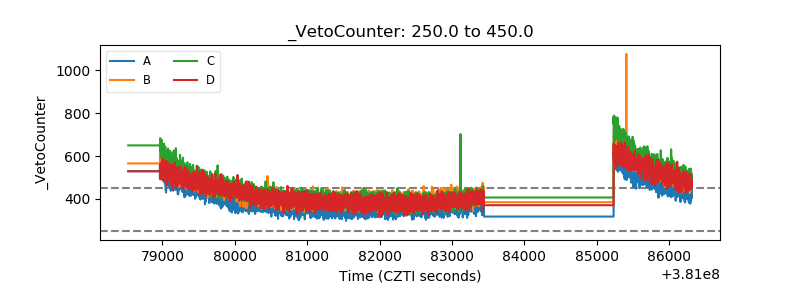 |