| Param | Original file | Final file |
|---|---|---|
| Filename | modeM0/AS1A11_059T09_9000004888_34258cztM0_level2.evt | modeM0/AS1A11_059T09_9000004888_34258cztM0_level2_quad_clean.evt |
| Size (bytes) | 478,563,840 | 55,869,120 |
| Size | 456.4 MB | 53.3 MB |
| Events in quadrant A | 2,600,615 | 332,520 |
| Events in quadrant B | 3,865,989 | 329,286 |
| Events in quadrant C | 3,126,475 | 330,929 |
| Events in quadrant D | 4,525,191 | 311,727 |
| Mode M0 | |||
|---|---|---|---|
| Quadrant | BADHDUFLAG | Total packets | Discarded packets |
| A | 0 | 11334 | 0 |
| B | 0 | 14982 | 0 |
| C | 0 | 12530 | 0 |
| D | 0 | 17035 | 0 |
| Mode SS | |||
|---|---|---|---|
| Quadrant | BADHDUFLAG | Total packets | Discarded packets |
| A | 0 | 112 | 0 |
| B | 0 | 112 | 0 |
| C | 0 | 112 | 0 |
| D | 0 | 112 | 0 |
| Mode M9 | |||
|---|---|---|---|
| Quadrant | BADHDUFLAG | Total packets | Discarded packets |
| A | 0 | 22 | 0 |
| B | 0 | 22 | 0 |
| C | 0 | 22 | 0 |
| D | 0 | 23 | 0 |
| Quadrant | Total seconds | Saturated seconds | Saturation percentage |
|---|---|---|---|
| A | 5531 | 5 | 0.090400% |
| B | 5531 | 338 | 6.111011% |
| C | 5531 | 59 | 1.066715% |
| D | 5531 | 226 | 4.086060% |
Noise dominated data is calculated using 1-second bins in cleaned event files. If a bin has >2000 counts, and if more than 50% of those come from <1% of pixels, then it is considered to be noise-dominated and hence unusable.
| Quadrant | # 1 sec bins | Bins with >0 counts | Bins with >2000 counts | High rate bins dominated by noise | Noise dominated (total time) | Noise dominated (detector-on time) | Marked lightcurve |
|---|---|---|---|---|---|---|---|
| A | 7203 | 5532 | 1 | 1 | 0.01% | 0.02% | 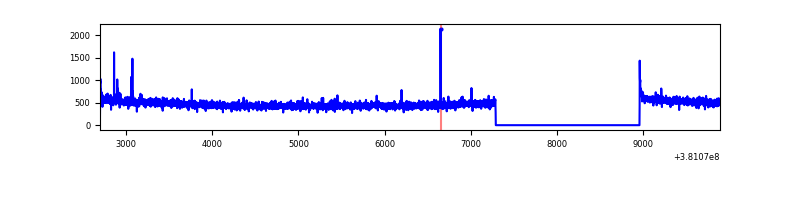 |
| B | 7203 | 5532 | 219 | 219 | 3.04% | 3.96% | 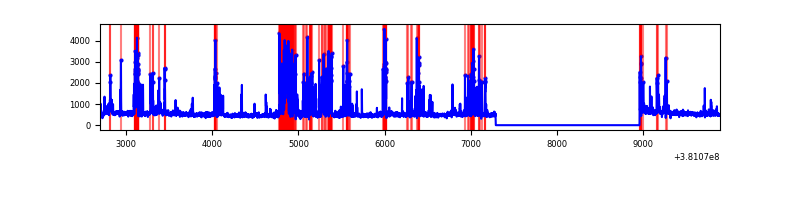 |
| C | 7203 | 5532 | 40 | 40 | 0.56% | 0.72% | 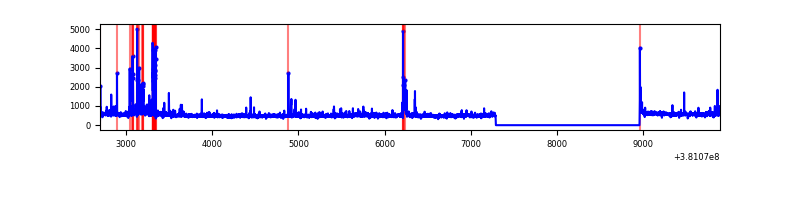 |
| D | 7203 | 5532 | 212 | 212 | 2.94% | 3.83% | 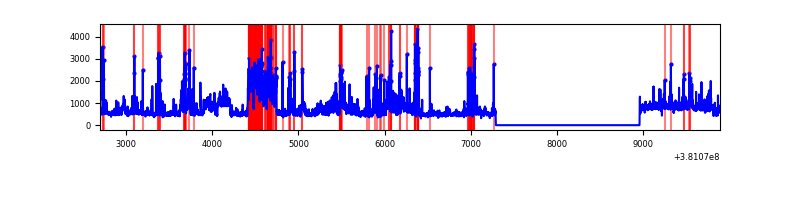 |
Top three noisy pixels from each quadrant. If the there are fewer than three noisy pixels in the level2.evt file, extra rows are filled as -1
| Pixel properties | Quadrant properties | ||||||
|---|---|---|---|---|---|---|---|
| Quadrant | DetID | PixID | Counts | Sigma | Mean | Median | Sigma |
| A | 10 | 83 | 25587 | 187.07 | 660 | 648 | 133.3 |
| A | 9 | 143 | 13695 | 97.87 | 660 | 648 | 133.3 |
| A | 13 | 254 | 10101 | 70.91 | 660 | 648 | 133.3 |
| B | 5 | 172 | 1077933 | 8712.23 | 642 | 627 | 123.7 |
| B | 0 | 189 | 100675 | 809.09 | 642 | 627 | 123.7 |
| B | 4 | 251 | 65768 | 526.8 | 642 | 627 | 123.7 |
| C | 15 | 214 | 241369 | 1623.06 | 641 | 644 | 148.3 |
| C | 0 | 207 | 210068 | 1412.02 | 641 | 644 | 148.3 |
| C | 14 | 254 | 67750 | 452.45 | 641 | 644 | 148.3 |
| D | 8 | 195 | 938540 | 5850.38 | 638 | 618 | 160.3 |
| D | 7 | 80 | 746702 | 4653.77 | 638 | 618 | 160.3 |
| D | 13 | 249 | 97007 | 601.24 | 638 | 618 | 160.3 |
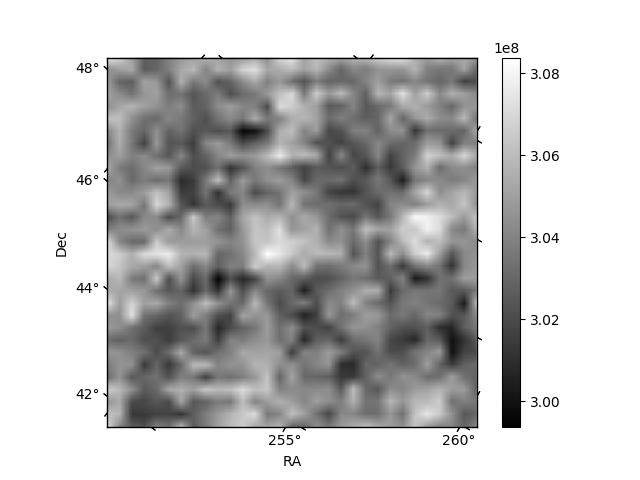
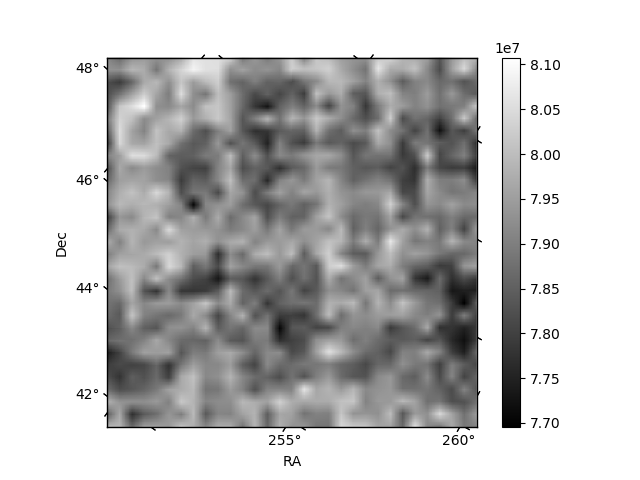
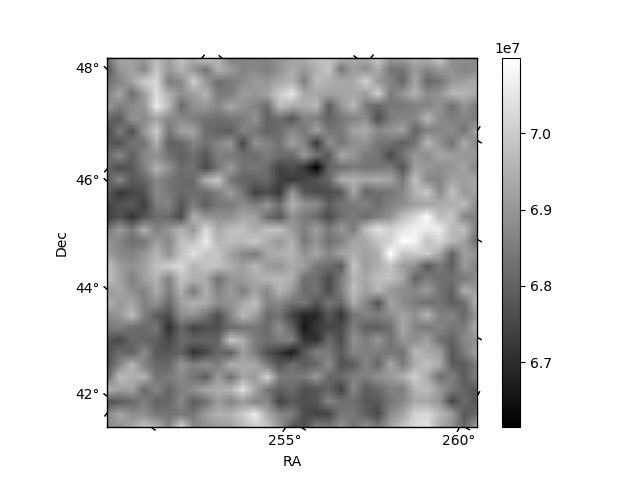
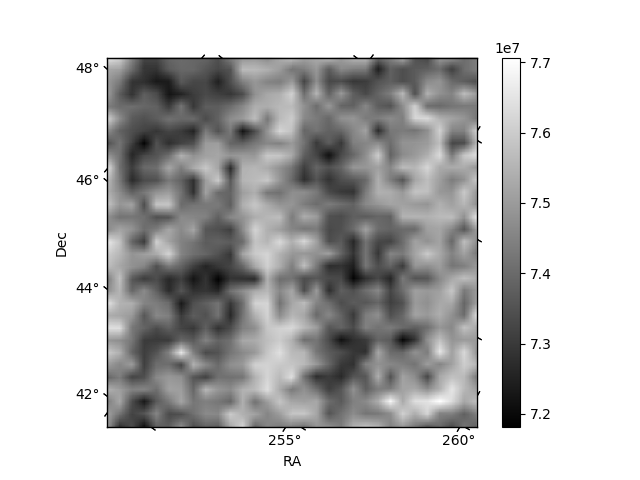
Histogram calculated using DETX and DETY for each event in the final _common_clean file
| Quadrant A | 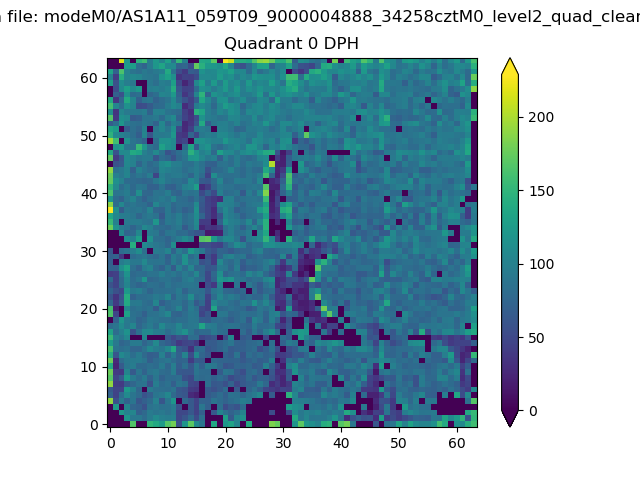 |
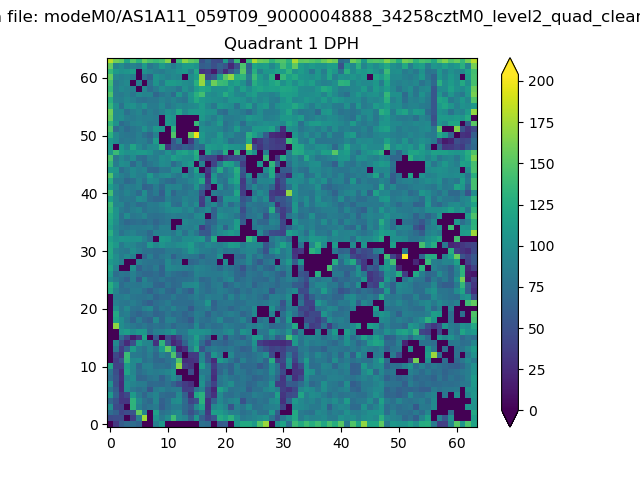 |
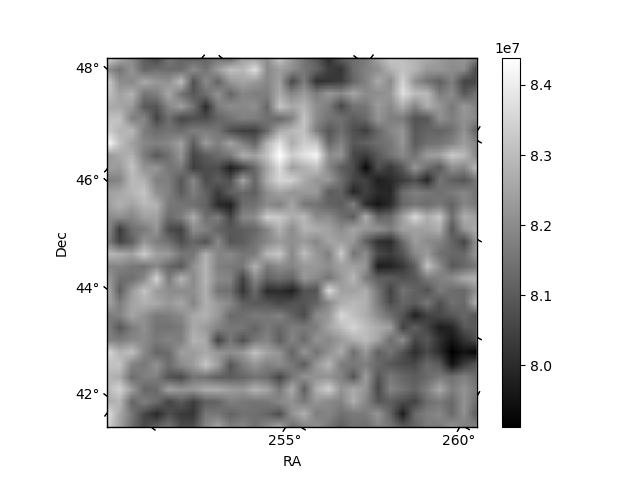
Quadrant B |
|---|---|---|---|
| Quadrant D | 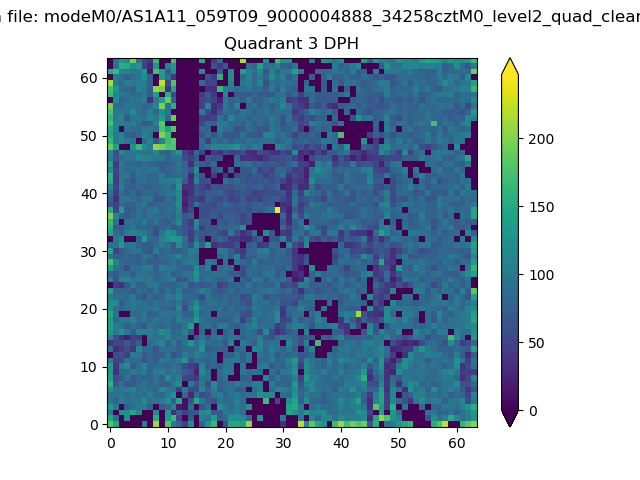 |
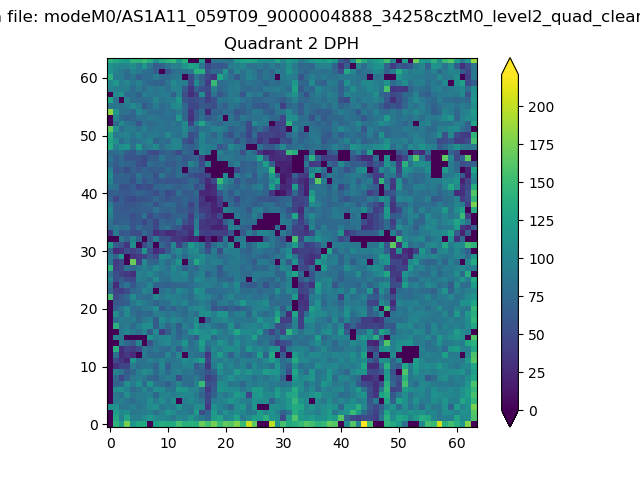 |
Quadrant C |
| Plot type | Count rate plots | Images |
|---|---|---|
| Comparison with Poisson distribution Blue bars denote a histogram of data divided into 1 sec bins. Red curve is a Poisson curve with rate = median count rate of data. |
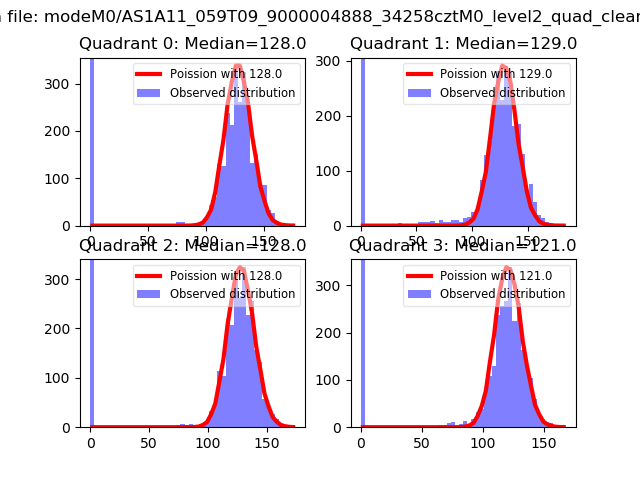 |
 |
| Quadrant-wise count rates Data is divided into 100 sec bins |
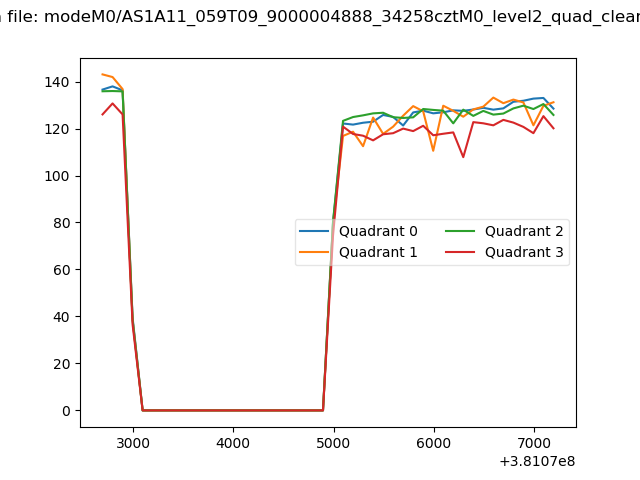 |
|
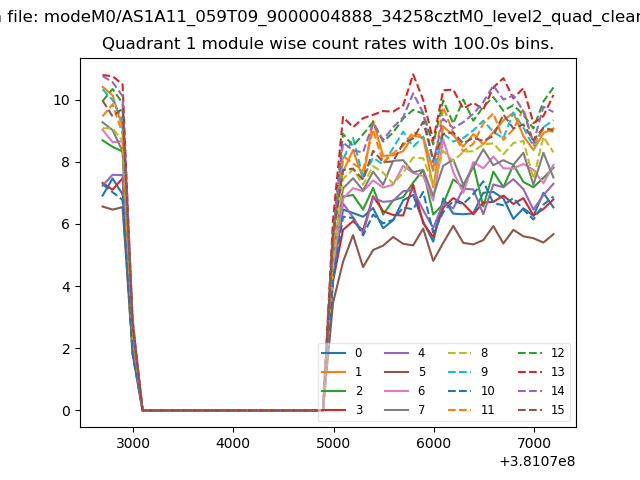
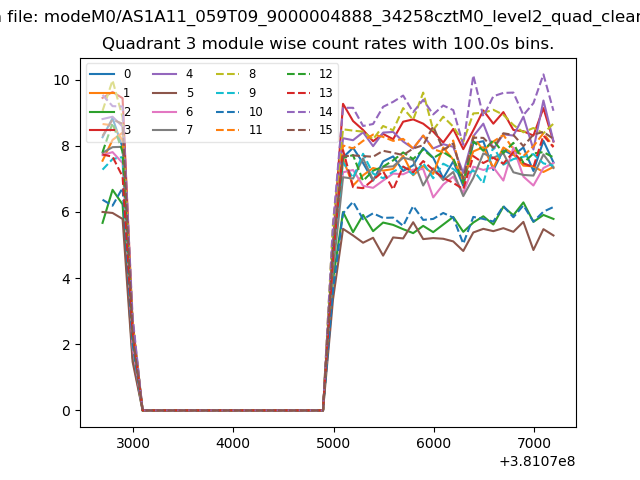
| Module-wise count rates for Quadrant A Data is divided into 100 sec bins |
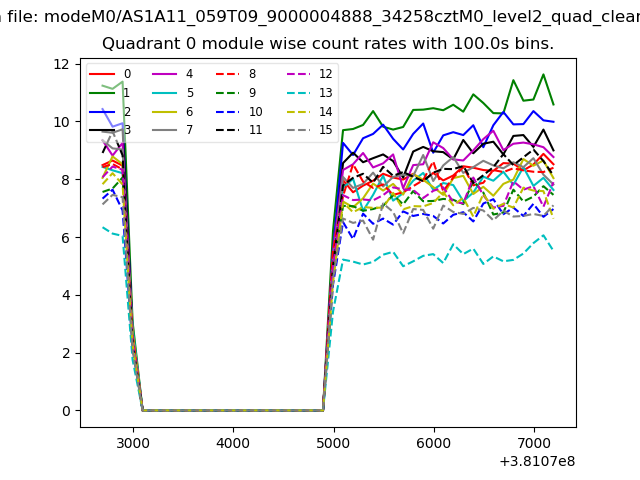 |
 |
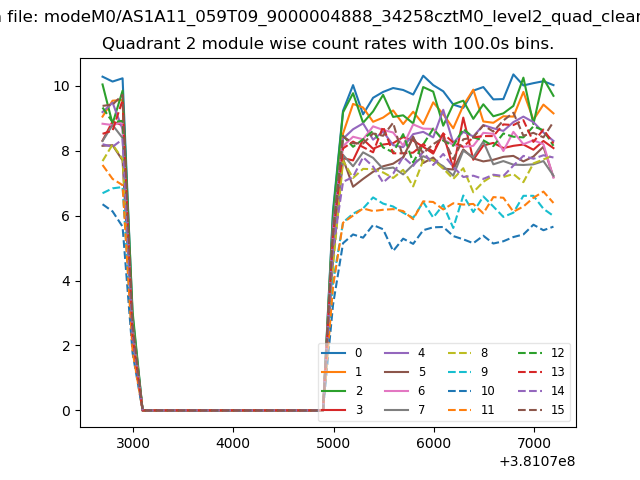
| Module-wise count rates for Quadrant B Data is divided into 100 sec bins |
 |
 |
| Module-wise count rates for Quadrant C Data is divided into 100 sec bins |
 |
 |
| Module-wise count rates for Quadrant D Data is divided into 100 sec bins |
 |
 |
| Parameter | Plot |
|---|---|
| CZT HV Monitor | 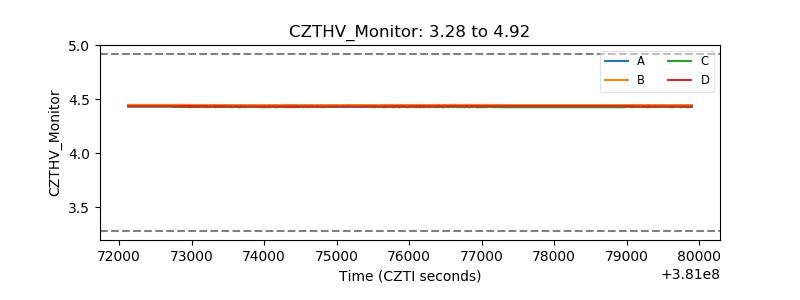 |
| D_VDD | 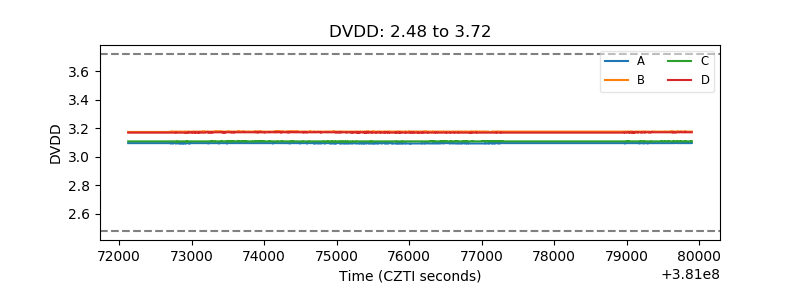 |
| Temperature 1 | 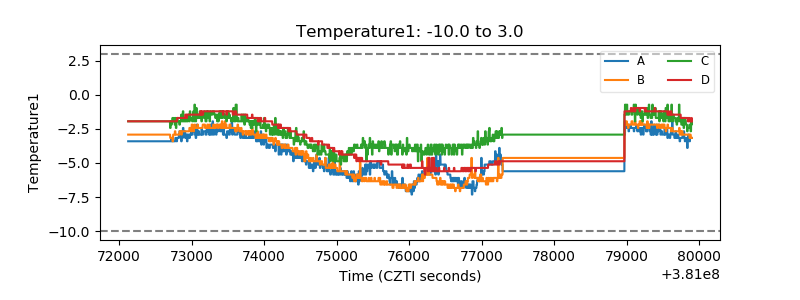 |
| Veto HV Monitor | 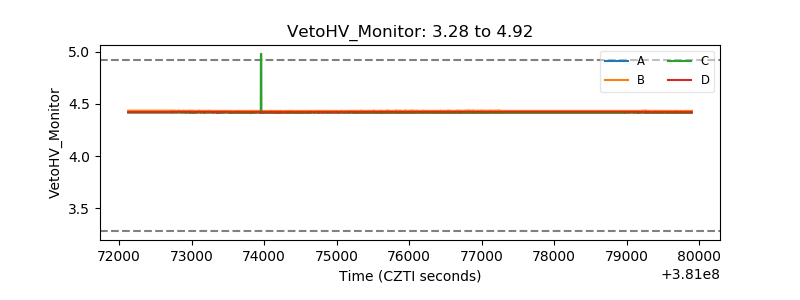 |
| Veto LLD | 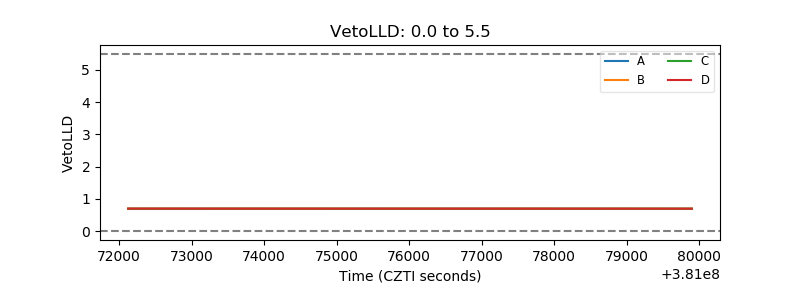 |
| Alpha Counter |  |
| _CPM_Rate | 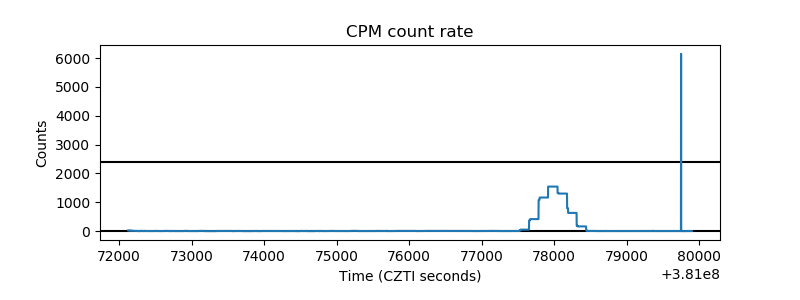 |
| CZT Counter | 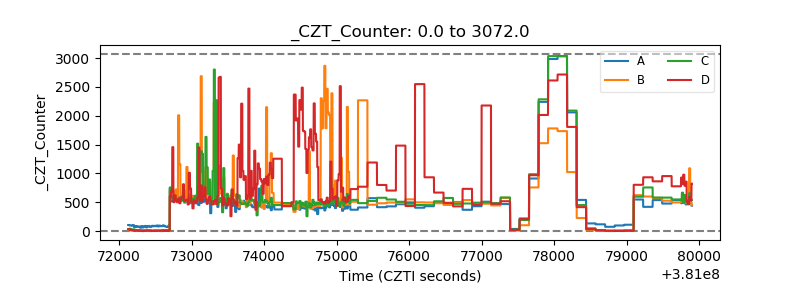 |
| +2.5 Volts monitor | 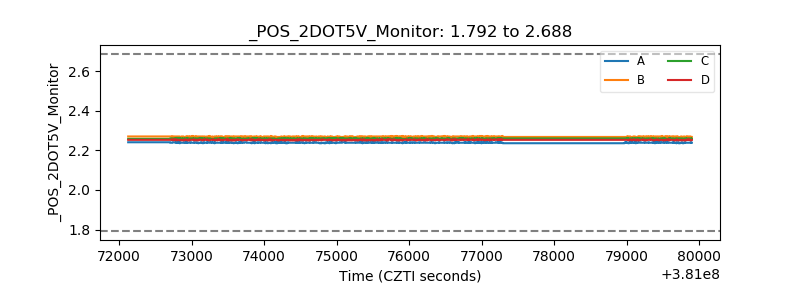 |
| +5 Volts monitor | 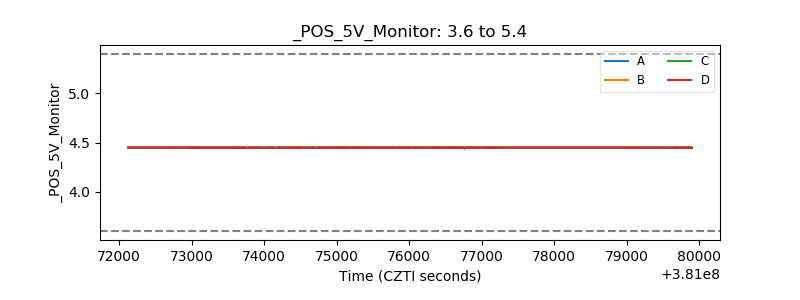 |
| _ROLL_ROT | 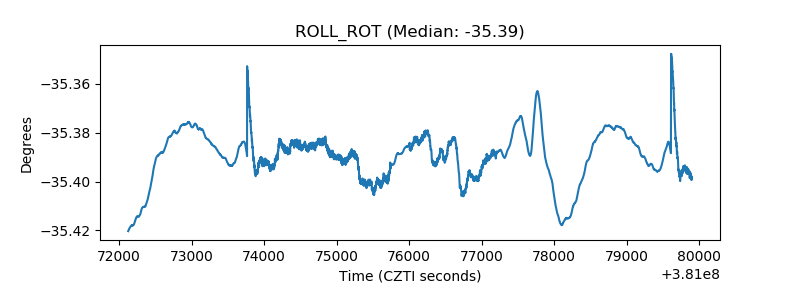 |
| _Roll_DEC | 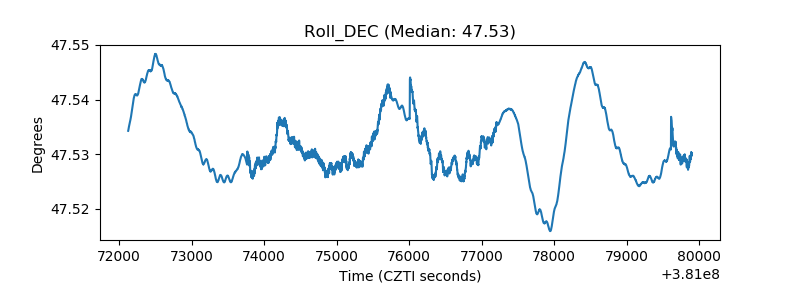 |
| _Roll_RA | 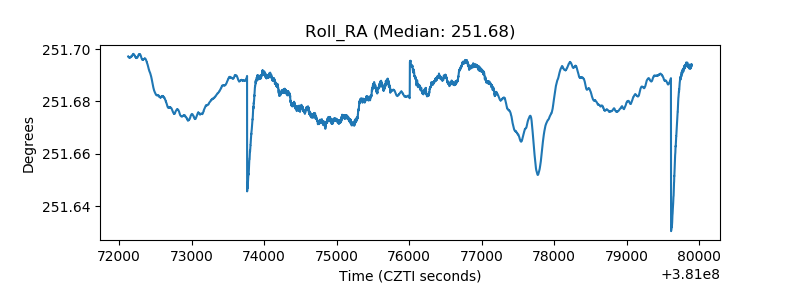 |
| Veto Counter | 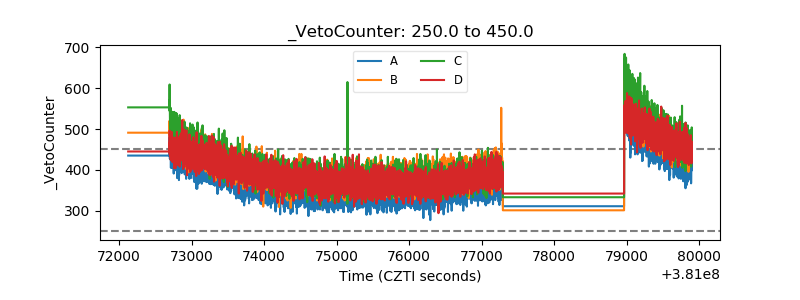 |